Keynote technicals intraday levels 101011
•
0 likes•99 views

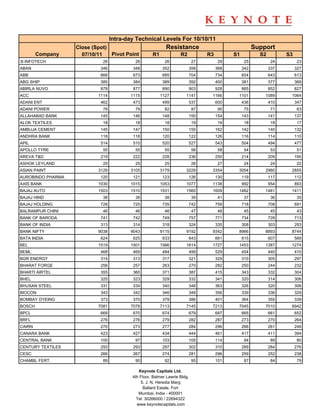
The document provides daily technical levels for various stocks including resistance and support levels. It lists the stock name, previous day's close, pivot point, and resistance and support levels R1 through R3 and S1 through S3 respectively for intraday trading on 10/10/11. Over 50 stocks from different sectors are included in the analysis.

Recommended
More Related Content
What's hot
What's hot (20)
Viewers also liked
Viewers also liked (16)
Similar to Keynote technicals intraday levels 101011
Similar to Keynote technicals intraday levels 101011 (17)
More from Keynote Capitals Ltd.
More from Keynote Capitals Ltd. (20)
Recently uploaded
Recently uploaded (20)
Keynote technicals intraday levels 101011
- 1. Intra-day Technical Levels For 10/10/11 Close (Spot) Resistance Support Company 07/10/11 Pivot Point R1 R2 R3 S1 S2 S3 3I INFOTECH 26 26 26 27 29 25 24 23 ABAN 346 348 352 358 368 342 337 327 ABB 666 673 685 704 734 654 643 613 ABG SHIP 385 384 389 392 400 381 377 369 ABIRLA NUVO 878 877 890 903 928 865 852 827 ACC 1114 1115 1127 1141 1166 1101 1089 1064 ADANI ENT 462 473 499 537 600 436 410 347 ADANI POWER 78 79 82 87 95 75 71 63 ALLAHABAD BANK 145 146 148 150 154 143 141 137 ALOK TEXTILES 18 18 18 19 19 18 18 17 AMBUJA CEMENT 145 147 150 155 162 142 140 132 ANDHRA BANK 118 118 120 122 126 116 114 110 APIL 514 510 520 527 543 504 494 477 APOLLO TYRE 55 55 55 56 58 54 53 51 AREVA T&D 219 222 228 236 250 214 209 195 ASHOK LEYLAND 25 25 25 26 27 24 24 22 ASIAN PAINT 3129 3105 3179 3229 3354 3054 2980 2855 AUROBINDO PHARMA 120 121 123 126 130 119 117 112 AXIS BANK 1030 1015 1053 1077 1138 992 954 893 BAJAJ AUTO 1503 1510 1531 1560 1609 1482 1461 1411 BAJAJ HIND 38 38 38 39 41 37 36 35 BAJAJ HOLDING 728 725 735 742 759 718 708 691 BALRAMPUR CHINI 46 46 46 47 48 45 45 43 BANK OF BARODA 741 742 749 757 771 734 728 713 BANK OF INDIA 313 314 318 324 335 308 303 293 BANK NIFTY 9038 9043 9115 9192 9342 8966 8893 8744 BATA INDIA 624 625 633 643 661 615 607 589 BEL 1519 1501 1566 1614 1727 1453 1387 1274 BEML 468 469 484 499 529 454 440 410 BGR ENERGY 314 313 317 321 329 310 305 297 BHARAT FORGE 256 257 263 270 282 250 244 232 BHARTI AIRTEL 355 360 371 387 415 343 332 304 BHEL 325 323 329 332 341 320 314 306 BHUSAN STEEL 331 334 340 348 363 326 320 306 BIOCON 343 342 346 349 356 339 336 329 BOMBAY DYEING 373 370 379 386 401 364 355 339 BOSCH 7081 7078 7113 7145 7213 7045 7010 6942 BPCL 669 670 674 679 687 665 661 652 BRFL 276 276 279 282 287 273 270 264 CAIRN 270 273 277 284 296 266 261 249 CANARA BANK 423 427 434 444 461 417 411 394 CENTRAL BANK 100 97 103 105 114 94 89 80 CENTURY TEXTILES 293 293 297 302 310 289 284 276 CESC 266 267 274 281 296 259 252 238 CHAMBL FERT. 89 90 92 95 101 87 84 79 Keynote Capitals Ltd. 4th Floor, Balmer Lawrie Bldg. 5, J. N. Heredia Marg Ballard Estate, Fort Mumbai, India - 400001 Tel: 30266000 / 22694322 www.keynotecapitals.com
- 2. Intra-day Technical Levels For 10/10/11 Close (Spot) Resistance Support Company 07/10/11 Pivot Point R1 R2 R3 S1 S2 S3 CHENNAI PETRO 203 204 208 213 222 199 195 186 CIPLA 285 286 289 293 299 282 279 273 CNX IT 5641 5672 5741 5842 6012 5571 5501 5331 COLGATE 986 987 1002 1017 1047 972 957 927 CONCOR 919 924 938 956 988 906 892 860 CORE PROTEC. 286 285 288 290 295 283 280 275 CROMPTON GREAVES 149 149 151 153 157 147 146 142 CUMMINS INDIA 406 405 410 414 423 401 396 387 DABUR 101 101 102 103 105 100 98 96 DCB 39 39 40 41 42 39 38 37 DCHL 54 55 56 57 59 54 53 51 DENA BANK 74 74 74 75 77 73 72 71 DISH TV 79 78 81 82 87 76 73 69 DIVIS LAB 724 726 730 736 745 720 716 707 DLF 218 217 221 225 232 214 210 202 DR. REDDYS 1503 1508 1520 1538 1568 1490 1478 1448 EDUCOMP 255 253 260 264 275 248 242 231 EKC 70 70 71 72 75 68 67 64 ESCORTS 71 71 72 74 76 70 69 66 ESSAR OIL 77 77 79 81 84 76 74 71 EXIDE INDS. 131 132 133 135 139 130 129 125 FEDERAL BANK 352 351 361 370 389 341 331 312 FINANCIAL TECH. 744 747 756 767 787 736 728 708 FORTIS 121 122 123 125 128 120 119 116 FSL 11 11 11 11 12 11 11 10 GAIL 411 413 417 423 433 407 403 392 GE SHIPPING 239 238 244 249 261 233 226 214 GLAXO 2099 2106 2123 2146 2186 2083 2066 2026 GMDC 158 160 162 167 174 156 153 146 GMR INFRA 26 26 27 27 29 25 25 24 GODREJIND 188 187 190 192 197 185 182 178 GRASIM 2335 2346 2384 2432 2518 2298 2261 2175 GSPL 102 103 105 109 114 100 98 92 GTL 55 55 56 57 60 54 53 51 GTL INFRA 11 11 11 11 12 11 11 11 GT OFFSHORE 117 117 120 123 128 115 112 107 GVK POWER 15 15 16 16 17 15 14 14 HAVELLS 344 346 352 360 374 338 332 319 HCC 28 28 28 29 29 28 27 26 HCL TECH. 405 408 414 422 436 400 394 380 HDFC 645 646 655 665 684 636 627 608 HDFC BANK 450 452 458 466 480 444 438 424 HDIL 93 94 95 96 99 92 91 88 HERO HONDA 1941 1951 1990 2039 2126 1902 1863 1776 HEXAWARE 82 82 84 85 88 81 79 76 Keynote Capitals Ltd. 4th Floor, Balmer Lawrie Bldg. 5, J. N. Heredia Marg Ballard Estate, Fort Mumbai, India - 400001 Tel: 30266000 / 22694322 www.keynotecapitals.com
- 3. Intra-day Technical Levels For 10/10/11 Close (Spot) Resistance Support Company 07/10/11 Pivot Point R1 R2 R3 S1 S2 S3 HINDALCO 126 126 127 129 132 124 122 119 HIND.OIL. EXP 106 105 108 110 115 103 100 95 HIND PETRO 368 367 370 372 376 365 363 358 HIND UNILEVER 329 329 332 335 342 326 322 315 HIND ZINC 118 117 121 123 129 114 111 104 HOTEL LEELA 36 36 38 39 42 34 32 29 INDIABULLS REALEST. 71 71 73 75 79 69 67 63 ICICI BANK 824 824 832 840 857 816 807 790 IDBI 99 99 101 102 106 97 95 91 IDEA 90 91 95 101 111 86 81 71 IDFC 116 116 119 121 126 113 110 105 IFCI 29 29 30 30 31 29 28 28 IGL 427 428 438 449 470 417 407 386 INDIAN HOTELS 69 69 70 71 73 68 68 66 INDIA CEMENTS 71 71 73 75 78 70 68 65 INDIA INFOLINE 73 73 74 76 79 71 70 67 INDIAN BANK 196 197 199 201 206 194 192 188 INDUSIND BANK 243 246 257 270 294 233 222 199 INFOSYS TECH. 2509 2524 2560 2611 2698 2473 2437 2349 IOB 92 91 94 97 102 88 85 79 IOC 319 315 324 330 344 310 300 285 IRB 163 164 166 168 173 161 160 155 ISPAT IND. 13 13 13 13 14 13 12 12 ITC 199 198 202 204 210 195 192 185 IVRCL INFRA 36 36 37 37 38 36 35 34 JET AIRWAYS 232 234 237 243 251 229 225 216 JINDAL SAW 136 137 140 145 153 132 129 121 JINDAL STEEL 483 477 497 511 544 463 444 410 JINDAL SWHL 526 527 532 539 551 520 515 503 JISLJALEQS 136 136 138 141 146 133 131 126 JP ASSOCIATES 73 74 75 77 80 72 70 67 JP POWER 34 34 35 36 37 34 33 32 JSW STEEL 565 568 576 587 606 557 549 530 KFA 20 20 21 21 23 20 19 18 KOTAK BANK 447 448 454 462 475 440 434 420 KS OILS 10 10 10 10 10 10 10 9 KTK. BANK 82 83 86 90 97 79 76 69 LIC HSG. FIN. 217 217 219 221 225 215 212 208 LITL 15 15 15 16 16 15 15 14 L&T 1393 1389 1403 1412 1436 1379 1365 1342 LUPIN 459 462 475 491 520 446 433 404 M&M 796 797 804 811 825 790 784 770 MARUTI 1113 1112 1127 1140 1168 1098 1083 1055 MAX 170 173 177 185 196 166 161 149 MCDOWELL-N 832 818 853 873 928 798 763 708 Keynote Capitals Ltd. 4th Floor, Balmer Lawrie Bldg. 5, J. N. Heredia Marg Ballard Estate, Fort Mumbai, India - 400001 Tel: 30266000 / 22694322 www.keynotecapitals.com
- 4. Intra-day Technical Levels For 10/10/11 Close (Spot) Resistance Support Company 07/10/11 Pivot Point R1 R2 R3 S1 S2 S3 MCLEOD RUSSEL 227 227 230 232 237 225 223 218 MLL 23 23 24 24 25 22 22 20 MOSERBAER 22 21 22 22 23 21 20 19 MPHASIS 322 321 330 338 355 313 304 287 MRF 6564 6568 6636 6708 6848 6496 6428 6288 MRPL 61 61 62 63 64 61 60 58 MTNL 30 30 31 31 32 30 29 28 MUNDRA PORT 156 155 159 162 168 153 149 142 NAGARJUNA FERT. 24 25 26 28 32 22 21 17 NATIONALUM 62 62 62 63 64 61 61 60 NCC 58 59 60 61 64 57 56 53 NEYVELI LIGNITE 77 77 78 79 81 76 75 73 NIFTY MCAP50 2023 2028 2044 2064 2101 2007 1992 1956 NHPC 23 23 24 24 24 23 23 22 NIFTY 4888 4891 4920 4952 5013 4859 4829 4768 NMDC 236 233 242 247 261 228 219 205 NTPC 167 167 169 171 175 165 163 159 OFSS 1937 1930 1973 2008 2087 1894 1851 1772 OIL 1327 1330 1347 1366 1403 1310 1293 1256 ONGC 264 265 271 277 288 259 254 242 ON MOBILE 61 60 62 63 65 59 58 55 OPTO CIRCUITS 211 206 224 238 269 193 174 143 ORBIT CORP 34 34 36 37 41 32 30 27 ORCHID CHEM 154 155 158 161 168 151 148 142 ORIENTAL BANK 289 290 298 307 325 280 272 254 PANTALOON RETAIL 185 186 190 194 202 181 178 169 PATEL ENGG. 93 93 94 95 98 91 90 87 PATNI 288 289 294 299 309 284 280 270 PETRONET 155 156 161 167 178 149 144 133 PFC 139 138 142 144 150 136 133 127 PIRAMAL HEALTH 352 353 357 362 370 348 344 336 PNB 925 928 942 958 989 911 897 866 POLARIS 129 128 131 132 137 126 124 119 POWER GRID 97 98 99 100 102 96 95 93 PRAJ IND 71 71 73 75 79 69 67 63 PTC 69 69 69 70 71 68 67 66 PUNJ LLOYD 54 54 55 56 57 53 53 51 RANBAXY 517 521 527 537 553 511 505 489 REL. COM. 73 73 75 76 79 72 71 68 REC 160 160 163 166 172 157 154 148 REL. CAPITAL 322 323 327 331 340 318 315 307 RELIANCE 803 799 812 822 845 789 776 752 REL. INFRA 391 390 396 402 413 385 379 368 REL. MEDIA 88 89 90 92 95 87 86 83 RENUKA SUGAR 52 52 53 55 57 51 50 48 Keynote Capitals Ltd. 4th Floor, Balmer Lawrie Bldg. 5, J. N. Heredia Marg Ballard Estate, Fort Mumbai, India - 400001 Tel: 30266000 / 22694322 www.keynotecapitals.com
- 5. Intra-day Technical Levels For 10/10/11 Close (Spot) Resistance Support Company 07/10/11 Pivot Point R1 R2 R3 S1 S2 S3 ROLTA 72 73 74 76 79 71 69 66 REL. POWER 81 81 82 83 85 80 79 77 RUCHI SOYA 112 112 113 115 118 110 109 106 SAIL 104 103 105 106 109 102 100 96 SBI 1752 1758 1773 1793 1828 1737 1722 1687 SCI 69 70 72 74 79 67 66 61 SESA GOA 205 204 208 210 217 201 197 191 SIEMENS 837 843 851 865 886 829 821 799 SINTEX 115 115 117 119 124 113 110 106 SKUMAR SYNF 39 39 40 40 42 38 38 37 SOBHA 212 210 215 219 228 207 201 193 SRE INFRA 32 32 33 33 35 31 30 29 SRIRAM TRANS. FIN. 577 587 600 624 661 563 550 513 STERLITE 114 113 115 116 120 111 109 105 STERLING BIO 68 68 69 71 74 66 65 62 STR TECH. 35 36 36 37 39 35 34 33 SUN PHARMA 470 469 478 487 504 461 452 434 SUN TV 263 255 273 284 312 244 226 197 SUZLON 36 36 37 37 38 35 35 34 SYNDICATE BANK 100 100 102 104 107 98 97 93 TATA CHEM 298 299 302 307 316 294 290 282 TATA COMM 182 182 184 186 190 180 178 174 TATA GLOBAL 83 83 83 84 86 82 81 80 TATA MOTORS 159 158 162 165 172 155 150 143 TATA MOTORS DVR 88 86 91 93 100 84 80 73 TATA POWER 98 100 102 106 112 96 94 88 TATA STEEL 420 417 424 428 439 413 407 396 TCS 1049 1055 1072 1095 1135 1031 1014 974 TECH M 563 555 574 585 615 544 524 494 TITAN 208 206 212 215 224 203 198 189 TRIVENI 21 21 21 22 23 20 20 19 TTML 17 17 17 18 18 16 16 15 TULIP 155 155 156 158 161 153 151 148 TVS MOTOR 58 59 60 61 63 58 57 55 UCO BANK 64 64 65 67 70 62 61 58 ULTRA CEMCO 1096 1109 1133 1171 1233 1071 1046 984 UNION BANK 230 232 238 245 259 224 218 205 UNITED PHOS. 128 128 130 132 135 126 125 121 UNITECH 26 26 26 27 28 26 25 24 VIDEOCON INDS. 171 171 172 173 176 169 168 165 VIJAYA BANK 53 53 54 55 56 52 52 50 VOLTAS 105 106 108 111 117 102 100 94 WELCORP 110 110 112 113 117 108 107 103 WIPRO 334 336 343 351 366 328 321 306 YES BANK 263 260 268 273 287 255 246 233 Keynote Capitals Ltd. 4th Floor, Balmer Lawrie Bldg. 5, J. N. Heredia Marg Ballard Estate, Fort Mumbai, India - 400001 Tel: 30266000 / 22694322 www.keynotecapitals.com
- 6. Intra-day Technical Levels For 10/10/11 Close (Spot) Resistance Support Company 07/10/11 Pivot Point R1 R2 R3 S1 S2 S3 ZEEL 112 113 115 119 124 110 108 102 Sanjay Bhatia (AVP – Technicals), Email Id sanjay@keynotecapitals.net Pivot Point: Intra- Day Trading Tool. Pivot Point (PP): This is a trigger point for Intra Day Buy / Sell based on the price range of the previous day. R1: Resistance 1: 1st Resistance level over Pivot Point, R2: Resistance 2: Next Resistance level after R1. R3: Resistance 3: Next Resistance level after R2. S1: Support 1: 1st Support level after Pivot Point, S2: Support 2: Next Support level after S1. S3: Support 3: Next Support level after S2. Note: As per this tool, the trader should take BUY position just above the Pivot Point and keep the Pivot Point level as stop loss and the first target would be R1 level (Resistance 1). If R1 is crossed then R2 (Resistance 2) becomes the next target with the stop loss placed at R1 level. If R2 is crossed then R3 (Resistance 3) becomes the next target with the stop loss placed at R2 level. Similarly if price goes below the Pivot Point the trader should take a SELL position and keep the Pivot Point level as the stop loss and the first target would be S1 level (Support 1). If S1 level is breached then S2 level (Support 2) becomes the next target with the stop loss placed at S1 level. If S2 level is breached then S3 level (Support 3) becomes the next target with the stop loss placed at S2 level. This is an intra-day tool. The key to the use of this tool is the use of Stop Loss Disclaimer: This document is not for public distribution and has been furnished to you solely for your information and must not be reproduced or redistributed to any other person. Persons into whose possession this document may come are required to observe these restrictions. This material is for the personal information of the authorized recipient, and we are not soliciting any action based upon it. This report is not to be construed as an offer to sell or the solicitation of an offer to buy any security in any jurisdiction where such an offer or solicitation would be illegal. It is for the general information of clients of Keynote Capitals Ltd. It does not constitute a personal recommendation or take into account the particular investment objectives, financial situations, or needs of individual clients. We have reviewed the report, and in so far as it includes current or historical information, it is believed to be reliable though its accuracy or completeness cannot be guaranteed. Neither Keynote Capitals Ltd., nor any person connected with it, accepts any liability arising from the use of this document. The recipients of this material should rely on their own investigations and take their own professional advice. Price and value of the investments referred to in this material may go up or down. Past performance is not a guide for future performance. Certain transactions -including those involving futures, options and other derivatives as well as non-investment grade securities - involve substantial risk and are not suitable for all investors. Reports based on technical analysis centers on studying charts of a stock’s price movement and trading volume, as opposed to focusing on a company’s fundamentals and as such, may not match with a report on a company’s fundamentals. Opinions expressed are our current opinions as of the date appearing on this material only. While we endeavor to update on a reasonable basis the information discussed in this material, there may be regulatory, compliance, or other reasons that prevent us from doing so. Prospective investors and others are cautioned that any forward- looking statements are not predictions and may be subject to change without notice. Our proprietary trading and investment businesses may make investment decisions that are inconsistent with the recommendations expressed herein. We and our affiliates, officers, directors, and employees world wide may: (a) from time to time, have long or short positions in, and buy or sell the securities thereof, of company (ies) mentioned herein or (b) be engaged in any other transaction involving such securities and earn brokerage or other compensation or act as a market maker in the financial instruments of the company (ies) discussed herein or act as advisor or lender / borrower to such company (ies) or have other potential conflict of interest with respect to any recommendation and related information and opinions. The analyst for this report certifies that all of the views expressed in this report accurately reflect his or her personal views about the subject company or companies and its or their securities, and no part of his or her compensation was, is or will be, directly or indirectly related to specific recommendations or views expressed in this report. No part of this material may be duplicated in any form and/or redistributed without Keynote Capitals Ltd’s., prior written consent. Keynote Capitals Ltd. 4th Floor, Balmer Lawrie Bldg. 5, J. N. Heredia Marg Ballard Estate, Fort Mumbai, India - 400001 Tel: 30266000 / 22694322 www.keynotecapitals.com