Download to read offline

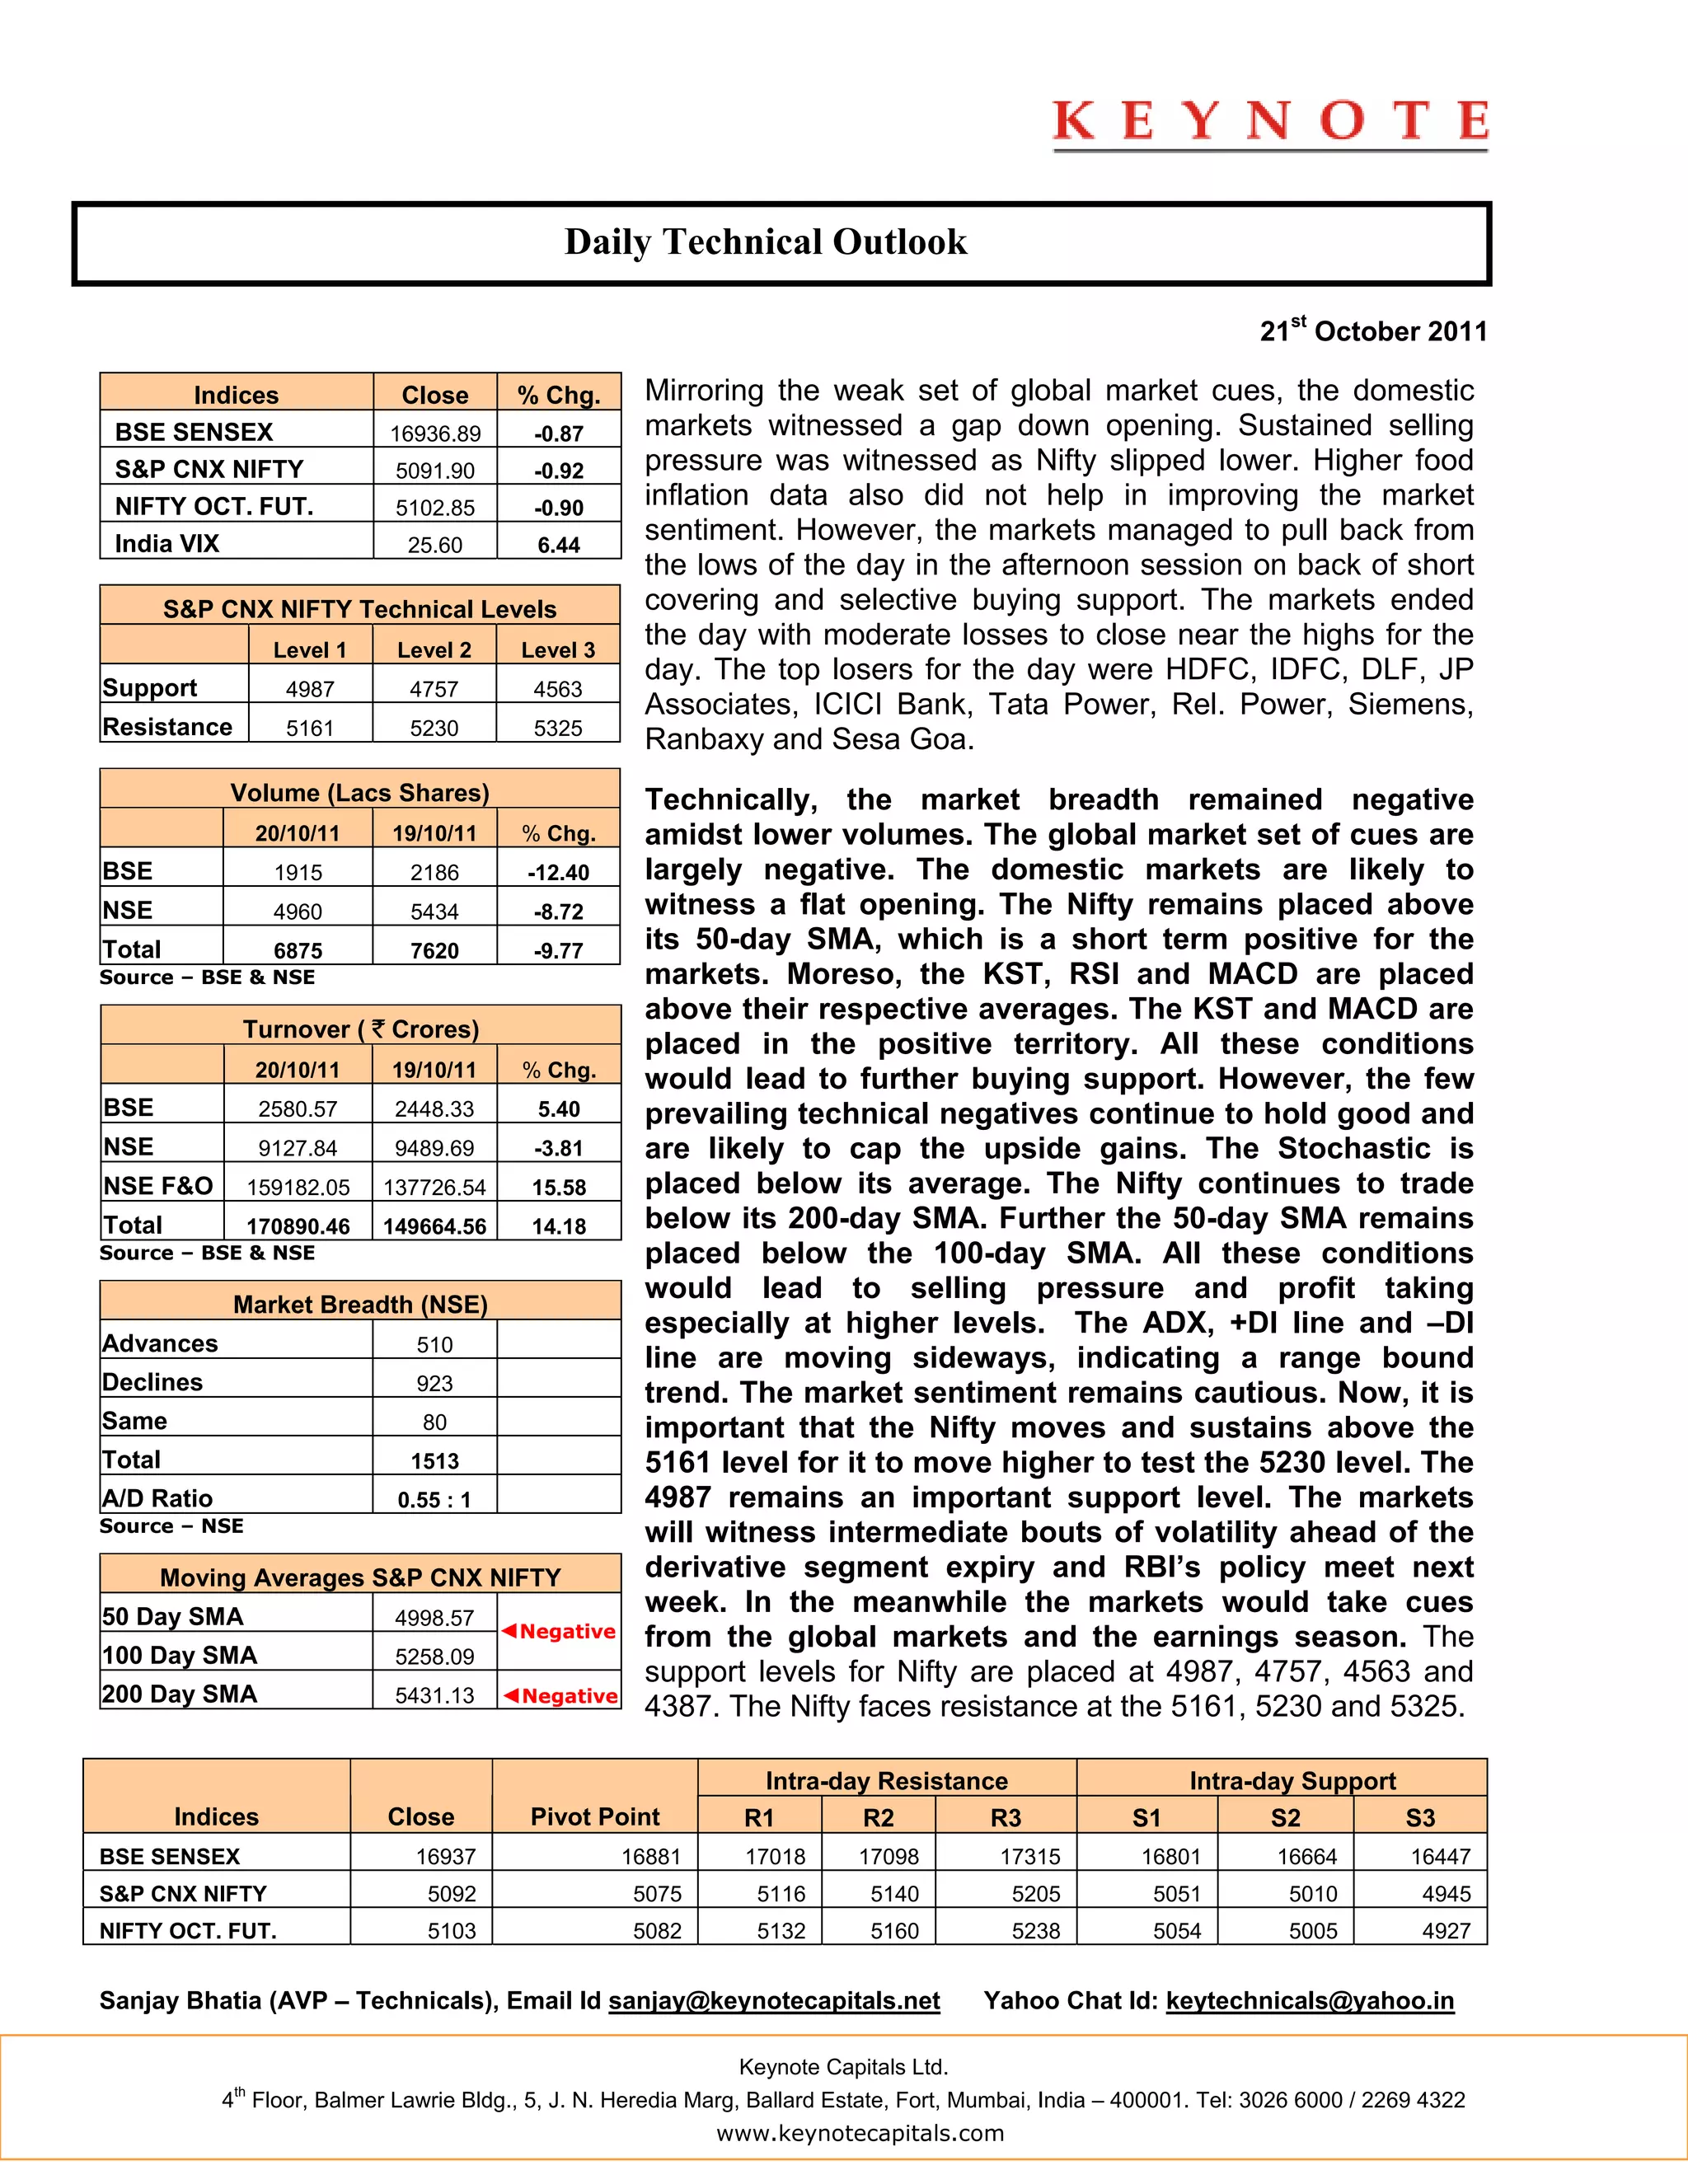
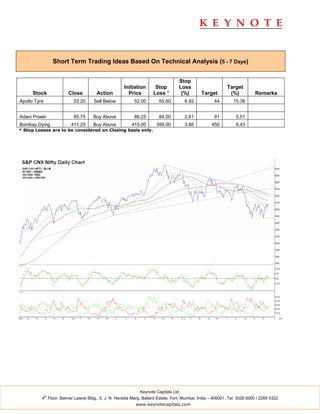


The domestic Indian markets opened lower and witnessed sustained selling pressure, falling further due to higher than expected food inflation data. However, the markets pulled back from the lows in the afternoon on short covering and selective buying. The markets ended the day with moderate losses, closing near the highs. Technically, the market breadth remained negative amidst lower trading volumes. Key support and resistance levels for the Nifty are identified. Short term trading ideas based on technical analysis are also provided.


