Download to read offline

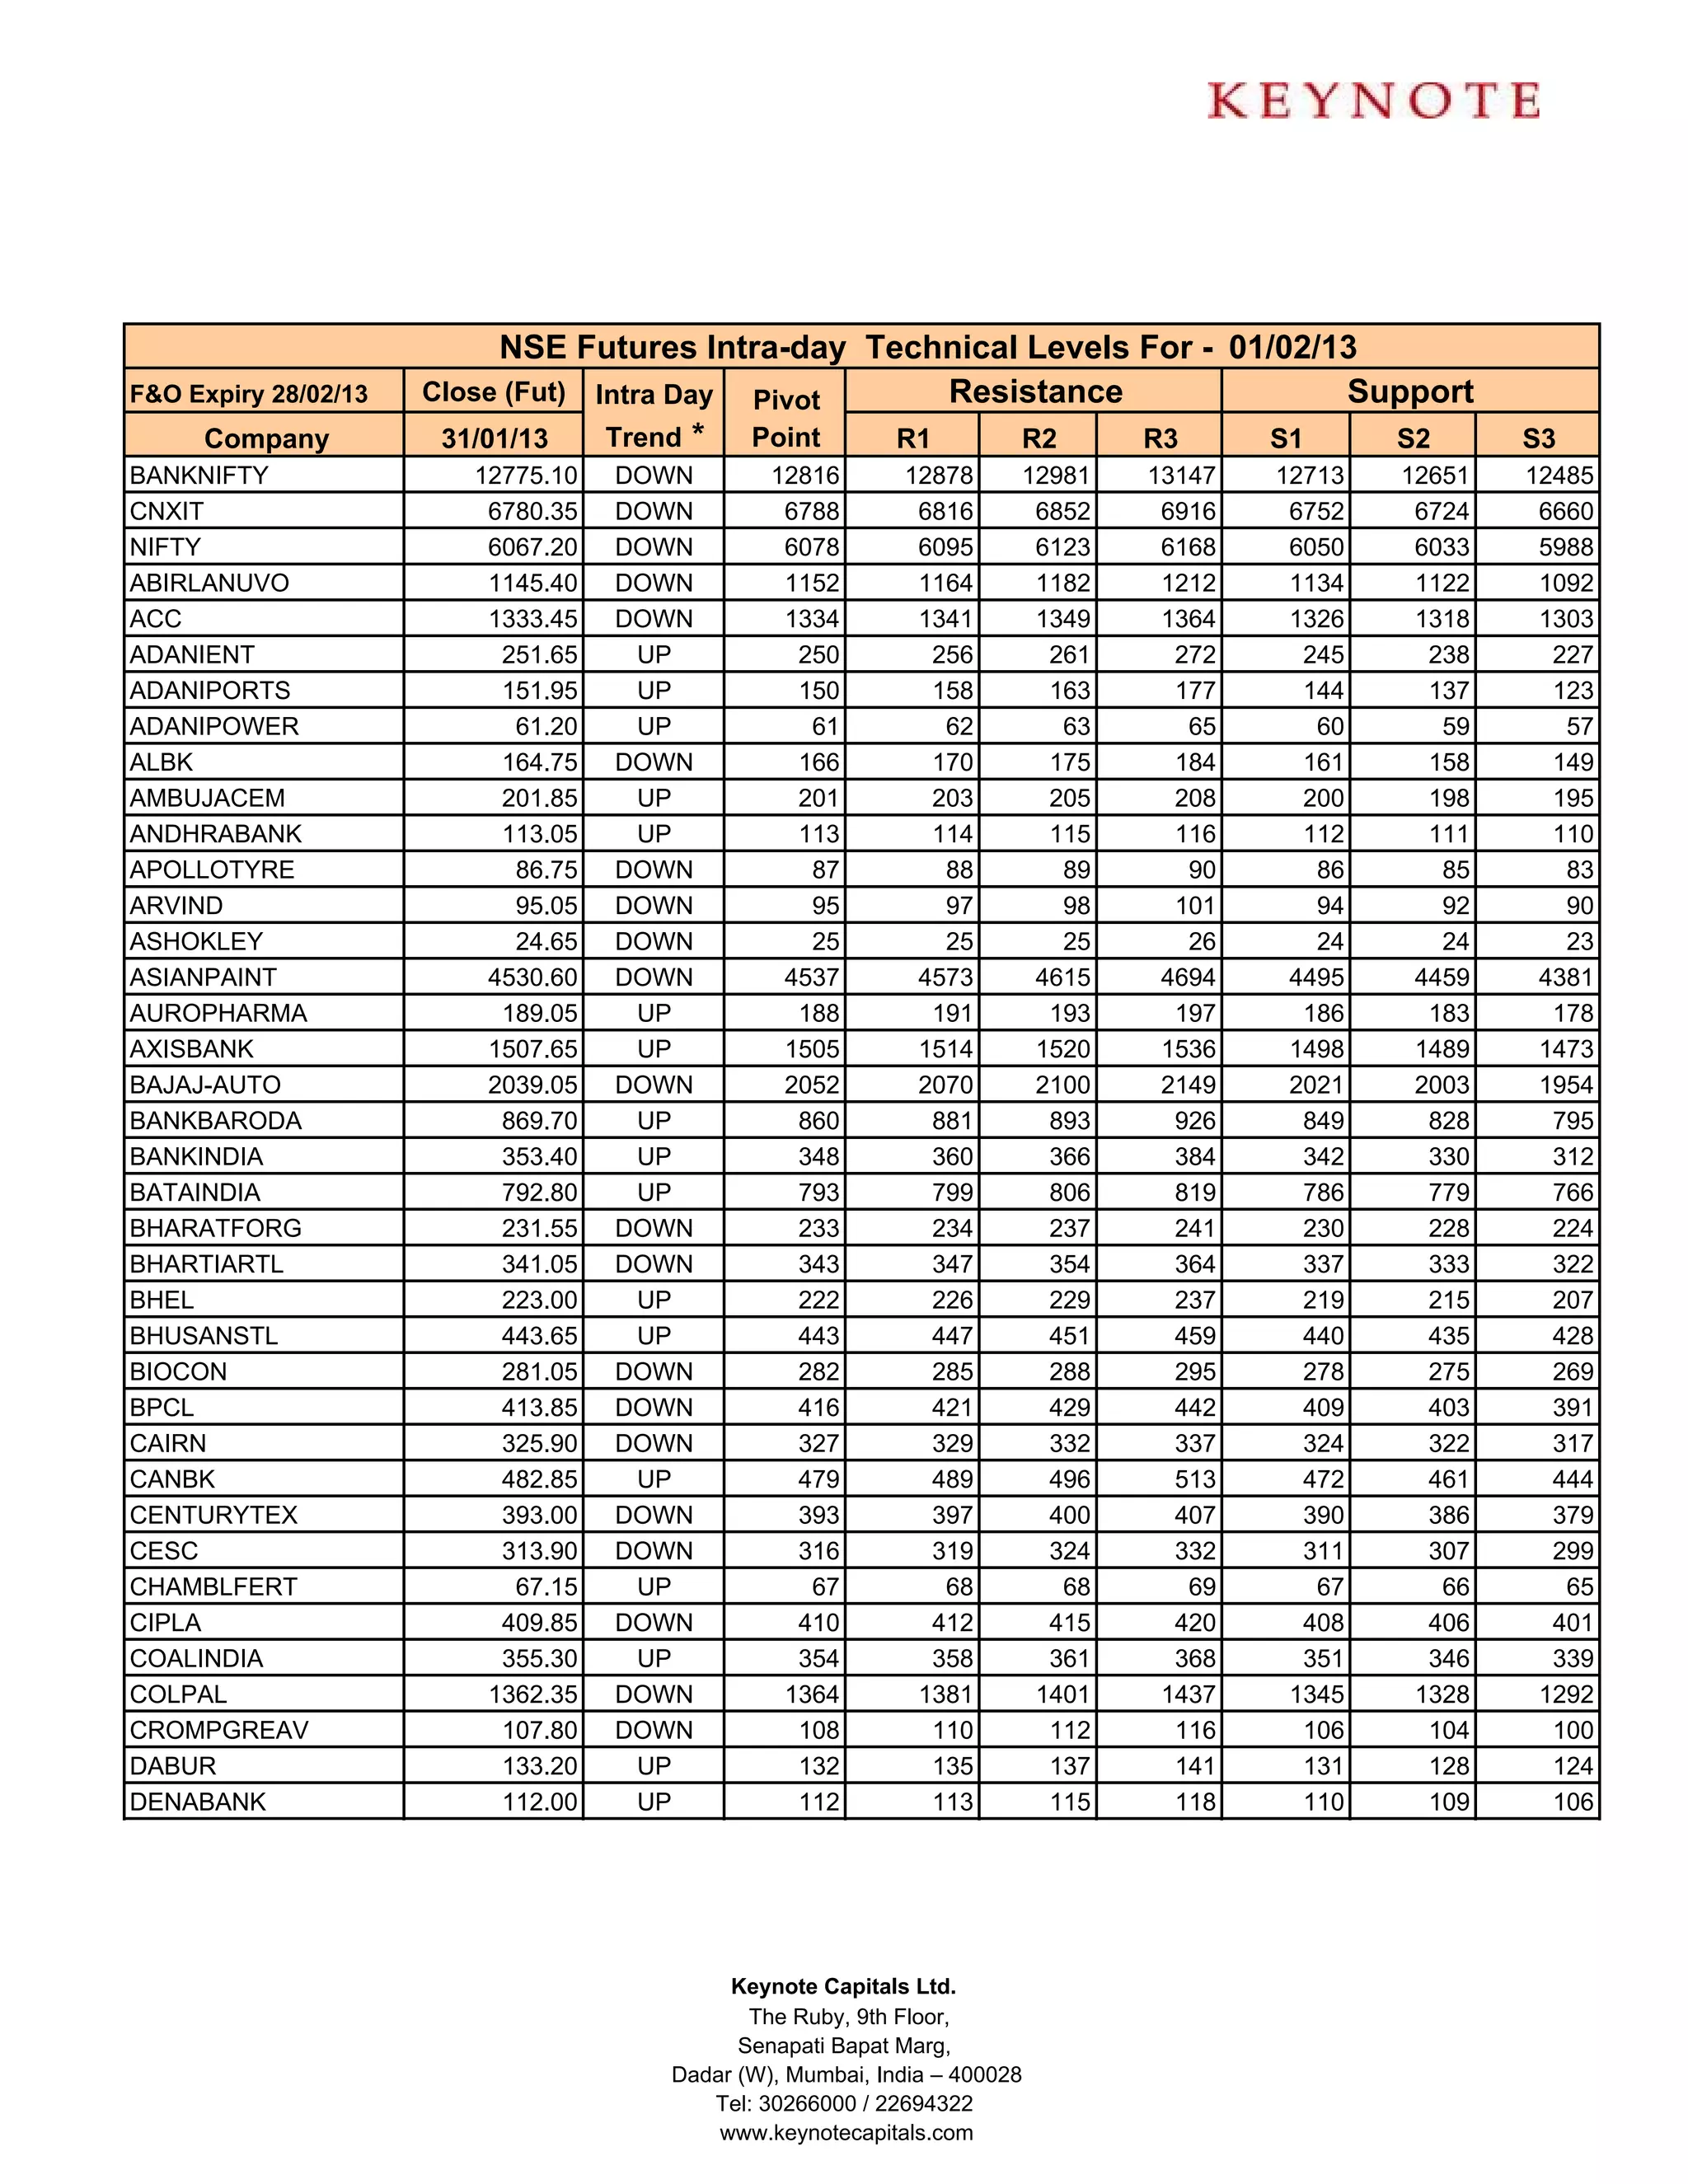
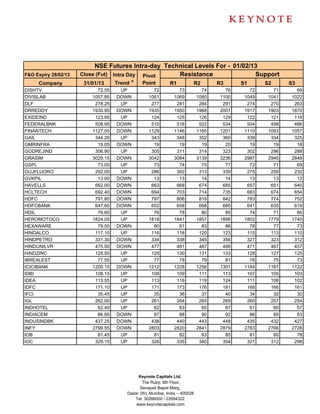
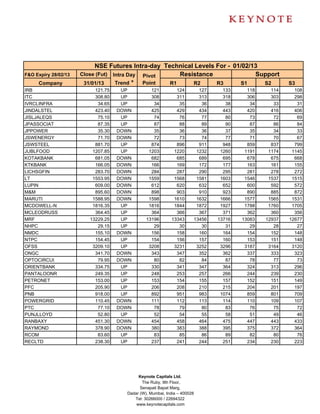
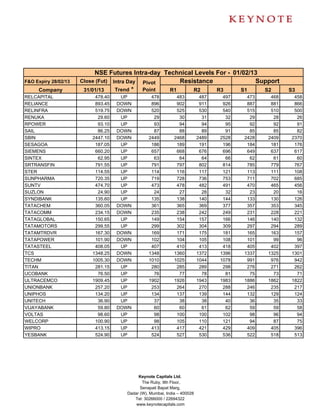
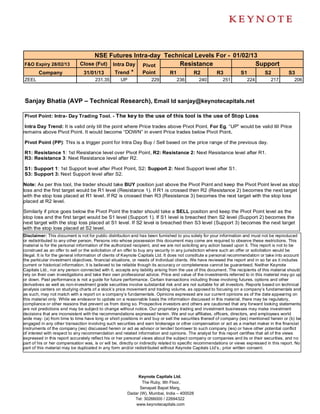

The document provides the intra-day technical levels for various stocks trading on the National Stock Exchange of India on February 1, 2013. It lists the closing price, intra-day pivot point, resistance and support levels for over 50 companies. The pivot point, resistance and support levels are used to analyze the trend and potential trading zones for the stocks.


