1. Rates
a) เวลาที่มีความเสี่ยงจากการทาPD / จานวนครั้งของการติดเชื้อ (pt-
months/episode)
b) จานวนครั้งของการติดเชื้อ / เวลาที่มีความเสี่ยงจากการทา PD
(episodes/pt-year)
2. % of pt who are infection-free per period of time
3. Median infection rate for the program
(Beth Piraino, Professor of Med at U of Pittsburgh)
P E RI T O N I T I S
• Defined as t he presence of at least 2 of t he
following conditions:
• Abdominal pain or tender ness
• Presence of white blood cells in peritoneal
effluent in excess of 100 cells/mL,
comprising at least 50% PMN
• Posit ive dialysate culture results
PD Related Infections Recommendations: 2010 update, Perit Dial Int : 2010; 30:393 - 423
43.
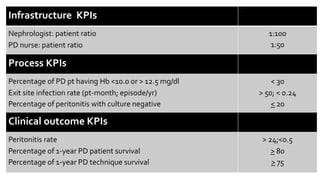
Infrastructure KPIs
Nephrologist: patientratio
PD nurse: patient ratio
1:100
1:50
Process KPIs
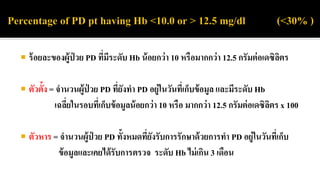
Percentage of PD pt having Hb <10.0 or > 12.5 mg/dl
Exit site infection rate (pt-month; episode/yr)
Percentage of peritonitis with culture negative
< 30
> 50; < 0.24
< 20
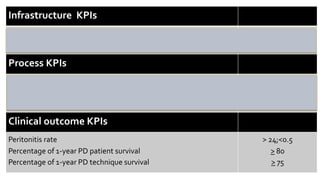
Clinical outcome KPIs
Peritonitis rate
Percentage of 1-year PD patient survival
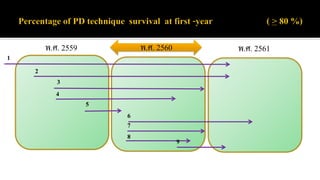
Percentage of 1-year PD technique survival
> 24;<0.5
> 80
> 75
44.
Infrastructure KPIs
Nephrologist: patientratio
PD nurse: patient ratio
1:100
1:50
Process KPIs
Percentage of PD pt having Hb <10.0 or > 12.5 mg/dl
Exit site infection rate (pt-month; episode/yr)
Percentage of peritonitis with culture negative
< 30
> 50; < 0.24
< 20
Clinical outcome KPIs
Peritonitis rate
Percentage of 1-year PD patient survival
Percentage of 1-year PD technique survival
> 24;<0.5
> 80
> 75
46.
ร้อยละของผู้ป่ วยPD ที่รอดชีวิตใน 1 ปี (%survival at first year)
ตัวตั้ง = จานวนผู้ป่ วย new case ที่เข้าปีก่อนหน้าทั้งหมด เหลือรอดมีชีวิต จนครบ 1 ปี
ตัวหาร = จานวนผู้ป่ วย new case ที่เข้าปีก่อนหน้าทั้งหมดทุกราย
หมายเหตุ: ควรนับเฉพาะรายที่สามารถทา PD ได้นานเกินกว่า 90 วันหลัง first PD
date (วันแรกที่เริ่มทา PD อย่างสม่าเสมอ อาจเป็นที่บ้าน ที่สถานพยาบาล หรือที่
nursing home)