Download as PDF, PPTX


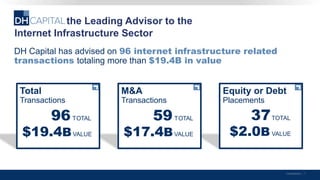
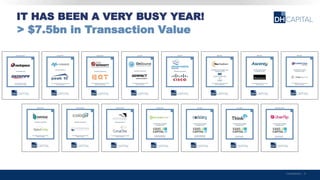

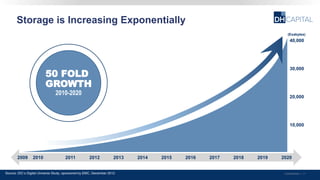

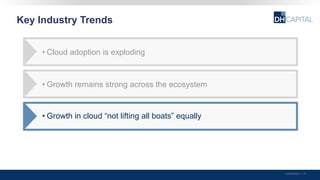
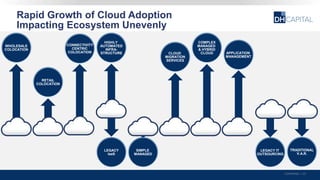
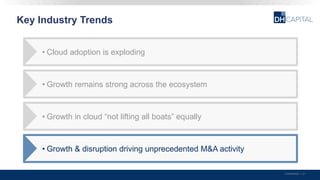
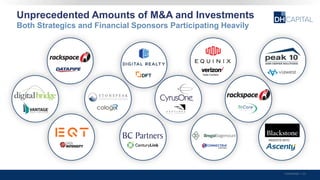

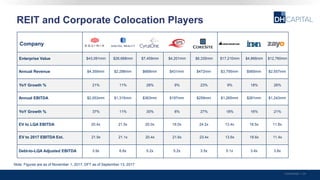
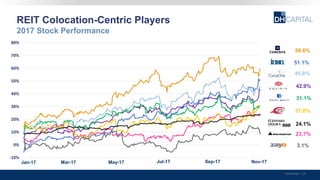


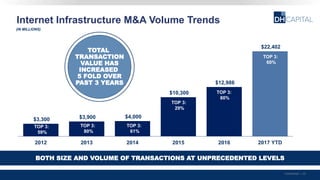
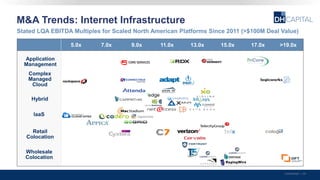
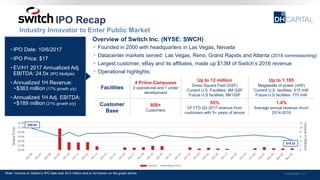

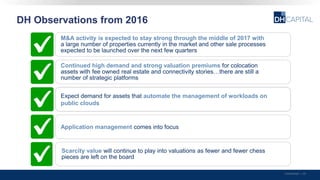

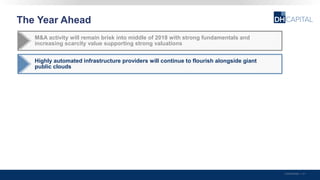


The document outlines key industry trends in the internet infrastructure sector, highlighting the explosive growth in cloud adoption and the strong performance of mergers and acquisitions (M&A) in this area. It reviews financial performance data, market trends, and the activities of major players, indicating a competitive landscape with significant capital investments. Overall, 2017 was marked by unprecedented M&A activity and substantial growth across cloud services and related sectors.


