Keeping track on enviromental changing in the worled
•
1 like•482 views

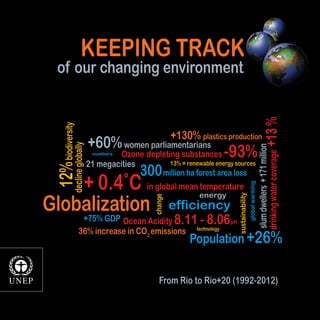
This document provides an overview and summary of environmental trends from 1992 to the present based on statistical data and indicators. It finds that while there have been some improvements, such as reductions in ozone-depleting chemicals and increases in renewable energy, the environment continues to deteriorate in many areas. Population and economic growth continue to increase pressure on natural resources, and issues like climate change, biodiversity loss, water scarcity, and pollution persist or are worsening. The report aims to inform discussions at the 2012 Rio+20 Conference on progress toward sustainable development goals and identify priority actions going forward.

Recommended
Recommended
More Related Content
What's hot
What's hot (17)
Viewers also liked
Viewers also liked (20)
Similar to Keeping track on enviromental changing in the worled
Similar to Keeping track on enviromental changing in the worled (20)
More from walled ashwah
More from walled ashwah (20)
Recently uploaded
Recently uploaded (20)
Keeping track on enviromental changing in the worled
- 1. A Globalization + 0.4˚C 300million ha forest area loss technology change
- 2. B © 2011 United Nations Environment Programme Publication: Keeping Track of Our Changing Environment: From Rio to Rio+20 (1992-2012) United Nations Environment Programme, Nairobi. Published October 2011 ISBN: 978-92-807-3190-3 Job Number: DEW/1234/NA This Report has been prepared within the framework of UNEP’s fifth Global Environment Outlook (GEO-5) reporting process. It complements the detailed information on the status and trends of the global environment and information on related policy measures. Disclaimers The content and views expressed in this publication are those of the authors and do not necessarily reflect the views or policies, or carry the endorsement of the contributory organisations or the United Nations Environment Programme (UNEP). The designations employed and the presentation of material in this publication do not imply the expression of any opinion whatsoever on the part of UNEP concerning the legal status of any country, territory or city or its authorities, or concerning the delimitation of its frontiers and boundaries. Reference to a commercial company or product in this publication does not imply the endorsement of UNEP. © Maps, photos, and illustrations as specified. Reproduction This publication may be reproduced in whole or in part and in any form for educational or non-profit purposes without special permission from the copyright holder, provided acknowledgement of the source is made. UNEP would appreciate receiving a copy of any publication that uses this publication as a source. No use of this publication may be made for resale or any other commercial purpose whatsoever without prior permission in writing from UNEP. Applications for such permission, with a statement of purpose and intent of the reproduction, should be addressed to the Director, Division of Communications and Public Information (DCPI), UNEP, P.O. Box 30552, Nairobi 00100, Kenya. The use of information from this publication concerning proprietary products for publicity or advertising is not permitted. This publication was printed on 100 Per Cent chlorine free paper from sustainable managed forests using vegetable inks and water-based varnish. Citation UNEP (2011). Keeping Track of Our Changing Environment: From Rio to Rio+20 (1992-2012). Division of Early Warning and Assessment (DEWA), United Nations Environment Programme (UNEP), Nairobi Produced by UNEP Division of Early Warning and Assessment United Nations Environment Programme P.O. Box 30552 Nairobi, 00100, Kenya Tel: (+254) 20 7621234 Fax: (+254) 20 7623927 E-mail: uneppub@unep.org Web: www.unep.org This publication is available from http://www.unep.org UNEP promotes environmentally sound practices globally and in its own activities.This publication is printed on 100 Per Cent chlorine free paper from sustainably managed forests. Our distribution policy aims to reduce UNEP’s carbon footprint.
- 3. i Keeping Track of Our Changing Environment From Rio to Rio+20 (1992-2012)
- 4. ii ForewordIn 1992, the first United Nations Conference on Sustainable Development, popularly known as the Rio Earth Summit, was convened in Rio de Janeiro, Brazil to address the state of the environment and sustainable development. The Earth Summit yielded several important agreements including “Agenda 21”, a plan of action adopted by over 178 governments to address human impacts on the environment at local, national and global levels, and key treaties on climate change, desertification and biodiversity. At the second Conference in 2002—the World Summit on Sustainable Development—governments agreed on the Johannesburg Plan of Implementation, reaffirming their commitment to Agenda 21. In 2012, the United Nations Conference on Sustainable Development, or Rio+20 Earth Summit, will focus on the Green Economy in the context of sustainable development, poverty eradication, and the institutional framework for sustainable development. The object is to renew political commitment to sustainable development, review progress and identify implementation gaps, and address new and emerging challenges. This publication serves as a timely update on what has occurred since the Earth Summit of 1992 and is part of the wider Global Environment Outlook-5 (GEO-5) preparations that will lead to the release of the landmark GEO-5 report in May 2012. It underlines how in just twenty years, the world has changed more than most of us could ever have imagined—geopolitically, economically, socially and environmentally. Very few individuals outside academic and research communities envisaged the rapid pace of change or foresaw developments such as the phenomenal growth in information and communication technologies, ever-accelerating globalisation, private sector investments across the world and the rapid economic rise of a number of “developing” countries. Many rapid changes have also taken place in our environment, from the accumulating evidence of climate change and its very visible impacts on our planet, to biodiversity loss and species extinctions, further degradation of land surfaces and the deteriorating quality of oceans. Certainly, there have been some improvements in the environmental realm, such as the significant reduction in ozone-depleting chemicals and the emergence of renewable energy sources, new investments into which totalled more than $200 thousand million in 2010. But in too many areas, the environmental dials continue to head into the red. This innovative report is based entirely on statistical data and indicators and shows where the world stands on many social, economic and environmental issues as we enter the second decade of the 21st century. Drivers of environmental change including population increase and economic growth, and especially the status of natural resources and landscapes, are clearly illustrated. Numbers plotted on straightforward graphs show upward and downward trends, which, along with satellite images, tell the story of dramatic changes. Maintaining a healthy environment remains one of the greatest global challenges. Without concerted and rapid collective action to curb and decouple resource depletion and the generation of pollution from economic growth, human activities may destroy the very environment that supports economies and sustains life. The upcoming Rio+20 Conference presents a timely, global-level opportunity to address one of its own stated objectives: to assess progress and gaps in implementing goals as part of an acceleration and scaling-up of transformative actions, programmes and policies. As we move towards the Rio+20 Conference in an ever-more globalised and integrated world, the need to chart progress towards a global Green Economy and more efficient and effective international environmental governance becomes vital. Without quantified targets, our environmental goals cannot turn theory into reality. Numeric and time-bound targets have certainly aided in progress made towards the Millennium Development Goals (MDGs), for example, and should be applied towards our environmental objectives as well. This publication helps to tell the story of where the world was 20 years ago and where we collectively stand today, and to show the direction in which we need to move in a post-Rio+20 world. It also highlights the missing pieces in our knowledge about the state of environment— such as those related to freshwater quality and quantity, ground water depletion, ecosystem services, loss of natural habitat, land degradation, chemicals and waste—due to lack of regular monitoring, collection and compilation of data. Scientifically-credible data for environmental monitoring remains inadequate and the challenge of building in-country capacity to produce better policy-relevant data needs urgent attention. We hope this report will inform all those participating in the Rio+20 events and the entire process and help set the world on a path towards a more sustainable environment. Achim Steiner United Nations Under-Secretary-General and Executive Director, UNEP
- 5. iii Table of Contents iv Introduction & Scope v What’s New Since Rio 1992? vii Goals & Targets in the Global Environment Population & Human Development 2 Total Population 2 Historical World Population 3 Population Growth Rate 4 Urban Population 5 Megacities 5 Top 10 Megacities 6 Population in China’s Pearl River Delta (Satellite Image) 7 People Living in Slums 8 Age Distribution 8 Life Expectancy 9 Food Supply 10 Human Development Index 11 Proportion of Seats Held by Women in National Parliaments Economy 13 GDP per Capita, Total 13 GDP per Capita, Change 14 Per Capita Gross Domestic Product 14 Gross Domestic Product–per Capita (Map) 15 Trade 16 Global Materials Extraction 17 Resource Efficiency Environmental Trends Atmosphere 21 Emissions of CO2 - Total 21 Emissions of CO2 - per Capita 22 Emissions of CO2 - Total, by Type 22 Emissions of CO2 - Change, by Type 23 Emissions of CO2 per GDP 24 GHG Emitters by Sector 25 Consumption of Ozone-Depleting Substances 25 Ozone Hole, Area and Minimum Ozone 26 Ozone Hole Images Climate Change 28 Atmospheric CO2 Concentration/Keeling Curve 29 Global Annual Mean Temperature Anomaly 29 Temperature Deviation 2000-2009 vs. Mean 1951-1980 (Map) 30 WarmestYears on Record 31 Earth Global Temperature Changes by Latitude 32 Ocean Temperature Deviation 32 Global Mean Sea Level 33 Ocean Acidification 34 Mountain Glacier Mass Balance 35 September Arctic Sea Ice Extent 35 September Arctic Sea Ice Extent (Satellite Image) Forests 37 Forest Net Change 37 Mangrove Forest Extent 38 Mato Grosso, Amazon Rainforest (Satellite Image) 39 Forest Plantation Extent 39 Roundwood Production 40 Certified Forest Area Water 42 Improved Sanitation & Drinking Water Coverage 43 Mesopotamian Marshlands (Satellite Image) Biodiversity 45 Living Planet Index 46 Red List Index 47 Protected Areas, Total Area 47 Protected Areas, Per cent Chemicals & Waste 49 Oil Spills from Tankers 50 Plastics Production Natural Hazards 52 Impacts of Natural Disasters 52 Reported Natural Disasters 53 Floods–Mortality Risk, Exposure andVulnerability 53 Tropical Cyclones - Mortality Risk, Exposure andVulnerability Governance 55 Multilateral Environmental Agreements, Number and Signatories 55 Number of MEAs Signed (Map) 56 ISO 14001 Certifications 57 Carbon Market Size 58 Total Foreign Aid and Environmental Aid 59 Aid Allocated to Environmental Activities Agriculture 61 Food Production Index 62 Cereal Production, Area Harvested and Fertilizer Consumption 63 Total Area Equipped for Irrigation 64 Saudi Arabia Irrigation Project (Satellite Image) 65 Organic Farming 66 Selected Crops in Humid Tropical Countries, Area 66 Selected Crops in Humid Tropical Countries, Change in Area 67 Grazing Animal Herds Fisheries 69 Exploitation of Fish Stocks 70 Total Fish Catch 70 Tuna Catches 71 Fish Catch and Aquaculture Production 72 Shrimp and Prawn Aquacultures (Satellite Image) Energy 74 Energy Consumption per Capita - Total 74 Energy Consumption per Capita - Change 75 Electricity Production 75 Electricity Production per Capita 76 Nightlights 77 Primary Energy Supply 78 Renewable Energy Supply, Total 78 Renewable Energy Supply, Change 79 Biofuels Production 80 Investment in Sustainable Energy 81 Nuclear Power Plants 81 Electricity Production & Nuclear Share 82 Oil Sands (Satellite Image) Industry, Transport & Tourism 84 Cement & Steel Production 85 Air Transport 86 International Tourism, Arrivals Technology 88 Internet Users & Mobile Phone Subscribers 90 Epilogue 91 Data Sources 93 References 93 Acronyms 97 Technical Notes 98 Annex for Aid To Environmental Activities 99 Acknowledgments
- 6. iv Introduction & Scope This publication was conceived with the idea of showing how the planet has changed in two decades—just twenty years— since decision-makers met at the United Nations Conference on Environment and Development in Rio de Janeiro. To relay this information in a compelling and succinct manner, environmental and related trends are charted and presented using globally-aggregated (and mainly statistical) data sets collected by international agencies, research bodies and other official entities. Major economic, environmental, social and technological trends are shown through numerically-based graphs, with their upward, downward or stable trend lines as dictated by the data. While most of these trends speak for themselves, short explanations of the phenomena observed are also provided for further elucidation. Also included are a number of illustrative “before and after” satellite images, primarily covering the same time period of 1992-2010 and showing environmental changes at the local level. In some cases, these impacts are ongoing. Scope and Methodology Most of the time-series data were collected directly from countries and aggregated to regional and global levels by authoritative international agencies.The time series indicators presented here are based on the best and most comprehensive data available to date. Three main criteria were used to select the indicators employed in this publication. First, an approximately 20-year temporal data record on which the trend charts could be based was required, so as to accurately portray the time period in question. In a few cases (and particularly for recent phenomena such as carbon trading), a correspondingly shorter time period was used to provide at least a partial picture to date. Second, the data on which the charts are based had to be global in coverage—that is, covering all or at least most countries so as to represent the entire world and not only certain regions. Third, the data had to be clearly sourced and taken from authoritative and reliable institutions with extensive experience in the thematic areas treated in each case. To ensure reliability, indicator charts are only presented for areas where all three data requirements were met. For areas where one or another of the criteria was not met, such as freshwater water availability, groundwater depletion, land degradation and chemicals and waste, any analysis might not be reliable, and so trends are not provided. Also, the availability of data related to the environment and natural resources that are disaggregated by gender (i.e., qualitatively) or sex (i.e., quantitatively) is generally poor, especially for developing countries. The implications of any shortcomings in the data are clear. To promote evidence-based environmental policies and actions, the underlying data needed to support sound decision-making must be part of the equation and be of proven scientific quality. Today, there are several reasons why the quality of international statistics varies greatly. First, statistics may not be available at the national level; second, the statistics that are collected may be of poor quality or outdated; and third, the comparability of statistics over time inherently presents challenges.These deficiencies and issues demonstrate the need for a comprehensive data and information system to optimally manage the vast array of related policy, scientific, technical, methodological and practical issues. For this to be achieved, the following steps are necessary: (1) strengthen national-level capacity for collecting and compiling environmental observations, especially where data gaps exist; (2) publish and provide access to data using various media; and (3) develop services to efficiently and rapidly provide information to decision-makers in (an) understandable format(s). Thus, a comprehensive capability at the global scale is needed to pull together and analyze the wealth of data collections that are available, and to enhance data collection for areas where information may be lacking. Within these limitations, it is hoped that this publication provides a clear and reasonably comprehensive twenty-year story on the state and trends in environment and development since 1992.
- 7. v “What’s New?” since Rio 1992 In terms of environment, what did not exist or was not well-known in 1992? In the twenty years since the first Earth Summit in 1992, the world has changed in ways most of us could not imagine. The Internet, mobile phones and other information and communications technologies have made the world a much smaller place—and more of a ‘globalized village’. An estimated five billion people have subscribed to mobile phone services and there are some two billion Internet users worldwide. Social media have further increased connectivity in recent years, with Facebook, for example, having more than 800 million users since it was launched in 2004. At the same time, space-based satellites can now even zoom in to street level, and provide detailed images in real-time on sophisticated smart-phones. We also see that economic power and production patterns are shifting among regions to the East and South, and that overall trade volumes are rising steeply. Perhaps the ways in which our environment has changed are not so immediately obvious to everyone, but they are at least as significant. Natural resources are being depleted or degraded— sometimes before we realize it—and certain metals seem to become “rare” all of a sudden. The ever-increasing demand for resources such as water, energy, food, minerals and land is driven by growing populations with rising incomes, while in parallel these resources are increasingly constrained by ecosystem changes, inherent variability of weather conditions and resource productivity, and the impacts of climate change. Within the context of the “mega-trends” taking place in our rapidly changing world and society, a number of new environmental issues and phenomena have arisen since 1992: 1992 2012 Evolution of the Internet: 1992-2012
- 8. vi New Multilateral Environmental Agreements and Conventions Several new Multilateral Environmental Agreements (MEAs) and Conventions have been established or entered into force in the last two decades to address emerging global environmental issues, including the United Nations Framework Convention on Climate Change (UNFCCC), the Convention on Biological Diversity (CBD), agreements related to chemicals (Basel, Rotterdam and Stockholm Conventions), and the United Nations Convention to Combat Desertification (UNCCD). Awareness of Climate Change Among much debate and controversy, Climate Change has become a “hot topic” and entered the policy arena, topping the global environmental agenda. The Green Economy Viable pathways for fundamentally shifting economic development to become more low-carbon, climate resilient, resource efficient, and socially inclusive, as well as for valuing ecosystem services, are now being proposed widely and increasingly pursued. Carbon Trading and other Environmental Market Tools Placing a monetary value on greenhouse gas emissions and creating a market for trade in carbon is a new and increasingly utilized concept to address climate change. Other new market frameworks include biodiversity offset and compensation programs, habitat credit trading and conservation banking, with a goal toward reducing biodiversity loss and mainstreaming impacts into economic decisions. Worldwide, at least 45 compensatory mitigation programs and more than 1 100 mitigation banks now exist (UNDP and GEF 2011). Markets for Organic Products and Eco-labeling Consumer demand for goods that are produced in a sustainable way has boosted certification and eco-labeling, such as the Forest Stewardship Council (FSC) and the Programme for the Endorsement of Forest Certification (PEFC) for forest products, the Marine Stewardship Council (MSC) for fish products, and “bio” or organic labels for many agricultural products including coffee, tea and dairy products. Genetically Modified Organisms Genetically Modified Organisms (GMOs) have been researched for decades, but have gained widespread attention in recent years, mainly due to prospects for increased food production. However, they remain controversial for a variety of reasons. Recycling Although recycling efforts are only beginning in many parts of the world, processing waste into new resources, products and materials is becoming mainstream policy and practice in several countries and regions. Commercialization of Biofuels, Solar and Wind Energy While the overall use of renewable energy is still modest, biofuels are gaining a significant market share, and wind and solar power production is increasing steeply. Windmills and solar panels are increasingly abundant, and in the transport sector, hybrid cars have entered the streets and air transport using biofuels are becoming a reality. Chemicals Management Management of toxic and other hazardous chemicals that threaten human and ecosystem health has improved. A number of deadly chemicals have been banned, and as of January 2010 the world is free of chlorofluorocarbons (CFC) production. Nano Materials Nanotechnology offers significant opportunities and benefits for industry and society at large, especially in the fields of energy, health care, clean water and climate change. But debate about this new technology continues and related potential environmental hazards and risks could be emerging.
- 9. vii Goals & Targets in the global environment One of the obstacles to achieving environmental goals set by the international community is the lack of sufficient, solid data and monitoring systems to measure progress. While for two of the interdependent areas of sustainable development—economic development and social development—the goals are normally measured and tracked quantitatively, environmental targets are largely defined in qualitative terms. On the other hand, those environmental agreements for which specific numerical targets were set, have been relatively successful. Already in the 1960s, for example, the World Commission on Protected Areas (WCPA) set a target of 10% of global land area to be designated as formally protected; today, nearly 13% of the world’s surface is now set aside as protected. Similarly, the Montreal Protocol on Substances that Deplete the Ozone Layer defines mandatory targets and specific timeframes within which the required reductions must be met, and it conducts regular reviews of phase-outs in accordance with scientific updates. It has been hailed as perhaps the most effective environmental agreement to date. More such initiatives are needed to promote evidence-based environmental policies and measure progress. The following is a summary of environment-related goals that incorporate targets and indicators since 1992. Specific Sets of Environmental Targets The Millennium Development Goals (MDGs) In September 2000, leaders from 189 nations agreed on a vision for the future: a world with less poverty, hunger and disease; greater survival prospects for mothers and their infants; better- educated children; equal opportunities for women; a healthier environment; and a world in which developed and developing countries work in partnership for the betterment of all. This vision took the shape of eight Millennium Development Goals (MDGs), which provide a framework of time-bound targets by which progress can be measured. A concise framework of eight goals and 21 targets towards the MDGs was adopted, along with 60 indicators to measure and show progress. While environment as a crosscutting theme is part of several MDGs, its significance in the overall framework is most prominently highlighted in MDG-7: Ensuring Environmental Sustainability. MDG-7 is divided into four targets as set forth below. They emphasize sustainability principles and reversing natural resource degradation; reducing biodiversity loss; increasing access to safe drinking water and sanitation; and improving slums (Table 1). Table 1: UN Millennium Development Goal-7 Goal 7: Ensure environmental sustainability targets Indicators Target 7.A: Integrate the principles of sustainable 7.1 Proportion of land area covered by forest development into country policies and programmes 7.2 CO2 emissions, total, per capita and per $1 GDP (PPP) and reverse the loss of environmental resources 7.3 Consumption of ozone-depleting substances 7.4 Proportion of fish stocks within safe biological limits Target 7.B: Reduce biodiversity loss, achieving, by 7.5 Proportion of total water resources used 2010, a significant reduction in the rate of loss 7.6 Proportion of terrestrial and marine areas protected 7.7 Proportion of species threatened with extinction Target 7.C: Halve, by 2015, the proportion of people 7.8 Proportion of population using an improved drinking without sustainable access to safe drinking water and water source basic sanitation 7.9 Proportion of population using an improved sanitation facility Target 7.D: By 2020, to have achieved a significant 7.10 Proportion of urban population living in slums improvement in the lives of at least 100 million slum dwellers
- 10. viii The World Summit on Sustainable Development Additional environmental targets were subsequently adopted in 2002 at the World Summit on Sustainable Development (WSSD).These relate to: fisheries; marine protection; biodiversity loss; access to renewable energy; and phasing out of organic pollutants (Table 2). The Copenhagen Accord In 2009, the Copenhagen Accord recognised the need for emission targets that will hold the increase in global temperature below 2°C —equated by scientists to a concentration level of 450 ppm (parts per million) of carbon dioxide in the atmosphere. The Accord today is supported by 114 countries. Aichi Biodiversity Targets At its tenth meeting in Nagoya, Japan in October 2010, the Convention on Biological Diversity (CBD) Conference of the Parties adopted a revised and updated Strategic Plan for Biodiversity for the 2011-2020 period, including the set of Aichi BiodiversityTargets comprising five strategic goals and 20 targets. However, these targets have no clear numerical goals, except the following ones: Target 5: By 2020, the rate of loss of all natural habitats, including forests, is at least halved and where feasible brought close to zero, and degradation and fragmentation is significantly reduced. Target 11: By 2020, at least 17% of terrestrial and inland waters, and 10% of coastal and marine areas, especially areas of particular importance for biodiversity and ecosystem services, are conserved through effectively and equitably managed, ecologically representative and well- connected systems of protected areas and other effective area-based conservation measures, and integrated into the wider landscapes and seascapes. To conclude, with specific quantitative goals being absent, the above targets may read more like recommendations. However, when goals incorporate numerical levels or values, the required achievement is more clearly defined and potentially obtainable. In fact, empirical evidence shows that goal-setting can work when clear quantitative targets are set. Another lesson learned from the history of environmental target-setting is that it works best for well-defined issues, such as the phasing out of Ozone Depleting Substances (ODS) or leaded gasoline, and for issues related to industrial chemicals for which technologies exist or can be developed to solve environmental problems associated with their production and use. Finally, it has become clear that it is critical to have baseline information to allow progress towards the targets to be tracked. For example, relatively little measurable progress has been made—or can be demonstrated— towards the WSSD target to “reverse the loss of biodiversity by 2010”, since there are insufficient, reliable and comprehensive biodiversity baseline data upon which to base trends and assess progress. Table 2: Environmental targets adopted at the WSSD, 2002 Targets Indicators Maintain or restore depleted fish To be determined stocks to levels that can produce the maximum sustainable yield by 2015 Reverse the loss of biodiversity Identified by Convention by 2010 on Biological Diversity (CBD) Establish a representative network To be determined of marine protected areas by 2012 Increase the share of renewable To be determined energy in the total energy supply, and provide 35% of African households with modern energy within 20 years Phase out by 2020, production To be determined and use of chemicals that harm health and environment
- 12. 2 Since 1992, the human population has grown by 1 450 000 000 people... Since 1992, the world’s population increased by an annual rate of 1.3%, adding nearly 1 500 million people to the planet. Between 1992 and 2010, world population grew from around 5 500 million to close to 7 000 million, representing a 26% increase. There are large differences in population numbers and changes between regions. For example, nearly 60% of the global population lives in Asia, 15% in Africa, and another 15% in North America and Europe combined. However, total population increases are much greater in West Asia (67% since 1992) and Africa (53%), while the population number in Europe has grown only slightly (4%). 0 10 000 9 000 8 000 7 000 6 000 5 000 4 00 1 Thousand Million People Source: U.S. Census Bureau World Population since 10 000 BC 0 2 4 6 8 1992 1997 2002 2007 2010 Thousand Million People Total Population West Asia North America Latin America & Caribbean Europe Africa Asia + Pacific+26% +53% +4% +28% +21% +67% Source: UNEP GEO Data Portal, as compiled from UNPD Global +26% since 1992
- 13. 3 ...however, the population growth rate is declining At the same time the population growth rate has been declining during the past several decades, dropping from around 1.65% per year in the early 1990s to 1.2% per year in the late 2000s. This represents a 27% decline in the growth rate between 1992 and 2010. There is a strong correlation between a country’s economic state and its growth rate: developing countries tend to have a 2-3 times higher growth rate than developed countries. This overall, global “decrease in the increase” means that the world’s population and its population growth rate are increasing more slowly, and could eventually stabilise around 10 thousand million people in 2100 (UN 2011). 3 000 2 000 1 000 0 1 000 2 050 1 2 3 4 5 6 7 8 9 Thousand Million People 2012 1992 0 0.5 1 1.5 2 1992 1997 2002 2007 2010 Developing Developed Global Source: UNEP GEO Data Portal, as compiled from UNPD Population Growth RatePer Cent
- 14. 4 In 2011, over 3 500 millionpeople—more than half the world’s population—are living in urban areas In 1992, 2 400 million of us lived in urban agglomerations. By 2009, the number had climbed to 3 500 million, a 45% increase. The additional 1 000 million “urban people”—nearly 200 000 new city dwellers per day—are the equivalent of 32 times the population of Tokyo, or 110 times that of Paris (Brinkhoff 2011). This unprecedented urban growth, projected to continue (although at a decreasing rate) in the coming decades, will require special attention in order to make life in cities more socially, economically and environmentally sustainable. While over half of the world population now lives in urban areas, they also account for 75% of global energy consumption (UN-Habitat 2009) and 80% of global carbon emissions (The World Bank Group 2010), at least when viewed from a consumption perspective (Satterthwaite 2011). On the other hand, the top 25 cities in the world create more than half of the world’s wealth (UN-Habitat 2008). This ongoing rapid urbanisation indicates that long-term investments addressing the associated vulnerabilities are critically needed. “[The] urgency is acute considering that 30-50% of the entire population of cities in developing countries live in settlements that have been developed in environmentally fragile areas, vulnerable to flooding or other adverse climate conditions, and where the quality of housing is poor and basic services are lacking” (UN 2009b). 0 1 2 3 4 1992 1997 2002 2007 2009 Thousand Million People Urban Population - Total Developing Developed Global 0 1 2 3 1992 1997 2002 2007 2009 Per Cent Urban Population - Growth Rate Developing Developed Global 30 40 50 60 70 80 1992 1997 2002 2007 2009 Per Cent Urban Population - Per Cent of Total Population Developing Developed Global UNEP GEO Data Portal, as compiled from UNPD UNEP GEO Data Portal, as compiled from UNPD UNEP GEO Data Portal, as compiled from UNPD
- 15. 5 The number of “megacities” has more than doubled since 1990 According to UN-Habitat, megacities are high density metropolises with at least 10 million inhabitants. The number of these megacities climbed from 10 in 1992 to 21 in 2010, a 110% increase, adding on average one megacity every two years. Fifteen of the world’s 21 megacities are found in developing countries. The largest megacity today is Tokyo which counts nearly 37 million persons, more than Canada’s total population. With large and dense metropolises come the associated environmental impacts of urban life. Very dense population structures and people living in close quarters bring sanitation, waste management, air quality, pollution and other concerns for residents and the environment alike. Not only do anthropogenic factors play a major role in megacities but the natural environment also presents risks to highly concentrated populations including floods, mudslides, tsunamis and earthquakes (UN 2009b, UN- Habitat 2009). Tokyo, Japan Delhi, India Sao Paulo, Brazil Mumbai, India Mexico City, Mexico New York-Newark, USA Shanghai, China Kolkata, India Dhaka, Bangladesh Karachi, Pakistan Million People 36.7 22.2 20.3 20.0 19.5 19.4 16.6 15.6 14.6 13.1 Rank 1990 1 11 4 5 3 2 18 7 23 21 1 2 3 4 5 6 7 8 9 10 Top 10 Megacities 2010 Source: UNPD 0 6 12 18 24 1990 1995 2000 2005 2010 Number of Megacities Megacities >10 Million Inhabitants +110% since 1990 Source: UNPD 10 13 16 19 21
- 16. 6 The population of China’s Pearl River Delta has tripled since 1992 and includes two of the world’s megacities The Greater Pearl River Delta area in southeastern China is the world’s largest “mega-region” with a population of approximately 120 million people (UN 2010). Over the past two decades, the populations of the delta cities of Guangzhou and Shenzhen have each reached nearly 10 million people while Hong Kong, Foshan and Dongguan have grown to around 5 million each (UN 2009). The individual cities are beginning to merge into one contiguous urban area. The core delta area shown in the above image had a little over 20 million people in the early 1990s but has since tripled to roughly 60 million people (SEDAC 2010). This intense urbanization has led to the loss of productive farmland and natural areas among other environmental problems (Yan and others 2009). Source: USGS; Visualization UNEP-GRID Sioux Falls
- 17. 7 Since 1990, the share of the urban population living in slums in the developing world has declined significantly, dropping from 46% in 1990 to 33% in 2010. This decrease shows that many efforts to give inhabitants of slums access to improved water or sanitation, and/or more durable housing have been successful. On the other hand, the absolute number of people living in slums has increased by 26% over the same period, equaling 171 million additional people and raising their number from 656 million in 1990 to 827 million in 2010. “Redoubled efforts will be needed to improve the lives of the growing numbers of urban poor in cities and metropolises across the developing world” (UN 2011b). Note: A slum household is defined as a group of individuals living under the same roof lacking one or more of these conditions: access to improved water; access to improved sanitation; sufficient-living area; durability of housing; security of tenure. However, since information on secure tenure is not available for most of the countries, only the first four indicators are used to define slum household, and then to estimate the proportion of urban population living in slums (UNSD n.d.). A smaller proportion of urban dwellers live in slums, but their total number has risen to 827 000 000 People Living in Slums 20 30 40 50 400 600 800 1 000 1990 1995 2000 2005 2010 Proportion of Urban Population in Slums [%] Population in Slums [Million People] 46% 33%656 Million 827 Million Source: UN-Habitat Percentage Total Number
- 18. 8 The population aged over 65 is growing at a faster rate than other age groups in most regions of the world While the population of the groups below 14 and above 65 years of age in all developed countries together has remained largely the same since 1990, this population in developing countries has continued to grow (from 1 760 million to 2 040 million in 2010, an increase of 16%). At the same time, there are significant differences in age structure between developed and developing regions. In the developed countries, the number of persons over 65 has been increasing rapidly, and now nearly equals the under 14 population. By contrast, in the developing countries, the under 14 population continues to grow and far outstrips the over 65 age group, although the latter is also rising, both in numbers and percentage of total population. This developed-developing countries’ dichotomy, as well as the fact that older populations are growing faster than the total population and that the difference in growth rates is increasing, has major implications for economies, the education and health care sectors, and the environment itself (UN 2009). Life expectancy depends heavily on good public health, medical care and a balanced diet, as well as peaceful and stable surroundings. Although living conditions improved in all regions and globally the average life span increased by four to eight years, Africa lags far behind, noting that there are large differences within the continent. 50 60 80 70 Africa Asia + Pacific Europe Latin America & Caribbean North America West Asia 1990 2010 Years Global Source: UNEP GEO Data Portal, as compiled from UNPD Age Distribution - High and Low Age Groups - Life Expectancy 0 500 1 000 1 500 2 000 1990 1995 2000 2005 2010 Million People Developing, Total, > 65 years Developed, Total, > 65 years Developed, Total, < 14 years Developing, Total, < 14 years Source: UNEP GEO Data Portal, as compiled from UNPD
- 19. 9 The average global citizen consumes 43 kg of meat per year, up from 34 kg in 1992 100 120 140 1992 1997 2002 2007 Fish & Seafood Meat Global Population +32% since 1992 +26% since 1992 +22% since 1992 Source: UNEP GEO Data Portal, as compiled from FAO 110 Index, 1992=100 130 Global dietary patterns have changed enormously over the last decades. “Income growth, relative price changes, urbanization and shifts in consumer preferences have altered dietary patterns particularly in developing countries” (FAO 2008). Diets shifted away from basic foods towards livestock products, as well as oils, fruits and vegetables, increasing the demand for meat by 26% and for fish and seafood by 32% between 1992 and 2007. During that time, for example, global average meat consumption grew from 34 kg per person per year to 43 kg. Nearly all of these increases can be attributed to growing demand in Asia and to a lesser extent, Latin America. Based on different studies and considering the entire commodity chain (including deforestation for grazing, forage production, etc), meat production accounts for 18-25% of the world’s greenhouse gas emissions (UNEP 2009, Fiala 2008, FAO 2006). Food Supply - Meat, Fish & Seafood -
- 20. 10 Human development levels are improving throughout the world, but there are large regional differences The Human Development Index (HDI), which serves as a frame of reference for both social and economic development, combines three dimensions to measure progress: a “long and healthy life” (life expectancy), “access to knowledge” (school enrollment) and “standard of living” (gross national income). Over the past 20 years, the HDI has grown globally by 2.5% per year, climbing from 0.52 in 1990 to 0.62 in 2010, or 19% overall, showing substantial improvement in many aspects of human development. Although progress has been made, large differences in values and growth are visible between regions, with Africa lagging far behind. “Most people today are healthier, live longer, are more educated and have more access to goods and services. Even in countries facing adverse economic conditions, people’s health and education have greatly improved” (UNDP 2011). 0.2 0.4 0.6 0.8 1 1990 2000 2010 Index Global Africa Latin America and the Caribbean Asia OECD Source: UNDP Human Development Index
- 21. 11 Women’s influence, as measured by seats in national parliaments, is steadily rising In the realm of gender parity, one indicator is the number of women in national parliaments. This figure has risen steadily over the last 20 years, from roughly 12% in 1997 to 19% in 2010, representing a 60% increase. This equals over 8 600 seats in more than 170 countries, up from just over 4 000 in 1997 (IPU 2011). “But this is far short of the target of 30% of women in leadership positions that was to be met by 1995, and further still from the MDG target of gender parity” (UN 2010). Women play a key role in improving environmental-related legislation and seeing that these measures are adequately funded and implemented. 10 12 14 16 18 20 1997 2002 2007 % of all Seats 2010 +60%since 1997 Source: World Bank Proportion of Seats Held by Women in National Parliaments
- 23. 13 GDP has continued to climb at a steady rate... Since 1992, the world’s overall Gross Domestic Product (GDP) has increased significantly i.e., from US$ 36 to 63 million millions in 2010, an increase of 75% or 3.2% per year on average. GDP per capita rose by 40% in that same period. Due to strong economic growth in many developing countries, their level of GDP per capita increased substantially, particularly in the last decade (80% since 1992, 45% since 2002). However, differences between developing and developed countries on per capita basis are almost seven-fold, reflecting the wide economic discrepancy between these two worlds. GDP indicates the level of economic activity, but is often misinterpreted as a measure of a country’s living standard. However, GDP as such does not adequately reflect standards of living, human well-being or quality of life. One successful attempt to move measurements and indicators of development beyond GDP is the Human Development Index, launched just before Rio 1992 and updated every year since. 100 120 140 160 180 1992 1997 2002 2007 2010 Index, 1992=100 Developing Developed World +33% since 1992 +39% since 1992 +80% since 1992 Source: UNEP GEO Data Portal, as compiled from World Bank, UNPD GDP per Capita - Change - 0 10 20 30 40 1992 1997 2002 2007 2010 Thousand Constant 2000 US$ GDP per Capita - Total - Developing Developed World 5 300 US$/person/yr 9 200 US$/person/yr 33 800 US$/person/yr Source: UNEP GEO Data Portal, as compiled from World Bank, UNPD
- 24. 14 Certainly not every country or citizen has benefited from overall higher levels of economic welfare. The gap between the lowest and highest income countries remains large, with many countries in Africa, Latin America and Asia still below the global average. In addition, many countries experience significant domestic income inequalities between rich and poor. In new and rising economic powers such as China and India, millions have been lifted out of poverty, but often at a high environmental cost. “The economic growth of recent decades has been accomplished mainly through drawing down natural resources, without allowing stocks to regenerate, and through allowing widespread ecosystem degradation and loss” (UNEP 2011). ...but huge differences in economic development persist All data for year 2010; except year 2009 data used for the following countries: Australia, Brunei Darussalam, Iran (Islamic Republic of), Libyan Arab Jamahiriya, Qatar, Saudi Arabia, United Arab Emirates, Yemen Source: UNEP GEO Data Portal, as compiled from World Bank, UNPD *All data for year 2010; except year 2009 data used for the following countries: Australia, Brunei Darussalam, Iran (Islamic Republic of), Libyan Arab Jamahiriya, Qatar, Saudi Arabia, United Arab Emirates, Yemen GDP per Capita (2010*) below global mean above global mean no data available
- 25. 15 The absolute value of trade among countries, a major aspect of globalisation, has tripled 0 20 40 60 80 0 10 20 30 40 1992 1997 2002 2007 2009 Million Million US$ Trade (US$) Trade (% of GDP) % of GDP Source: UNEP GEO Data Portal, as compiled from World Bank Trade has been present throughout much of human history, but its importance in economic, social and political terms has increased steeply over the last decades, and is a main facet of what is generally understood by “globalisation”. The value of internationally traded products has tripled between 1992 and 2009, from over US$ 9 to 28 million millions. The share of trade as of the global total Gross Domestic Product (GDP) increased in that period from 39% to 49%, reaching nearly 60% before the economic crisis in 2008. By far the largest sectors of international trade in 2010 concern mineral fuels and oils (15%), electrical and electronic equipment (13%), machinery (12%) and vehicles (7%) (ITC 2011). Trade - Total and Percentage of GDP -
- 26. 16 As societies grow and become wealthier, demand for basic materials is further increasing The global use of natural resource materials increased by over 40% between 1992 and 2005, from about 42 to nearly 60 thousand million tonnes. On a per capita basis, the increase was 27%. Among the four major material groups (biomass, fossil fuels, ores and industrial minerals, and construction minerals) there has been a major increase in extraction of construction minerals of almost 80%, followed by ores and industrial minerals (close to 60%). This growth is strongly linked to increasing population numbers and the need for shelter, food and an improved standard of living (UNEP 2011). International trade in resource materials has also increased. “The total value of world trade in natural resources was US$ 3 700 thousand millions in 2008, or nearly 24 Per Cent of world merchandise trade. This value has increased more than six-fold between 1998 and 2008” (WTO 2011). 0 20 40 60 80 Thousand Million Tonnes Ores and Industrial Minerals Fossil Fuels Construction Minerals Biomass +41%since 1992 Source: Krausmann and others 2009 1992 20021997 2005 Global Materials Extraction
- 27. 17 More energy and natural resources are being consumed, but the amounts needed per product are declining Although overall energy and material use continue to grow, there is a simultaneous general decline in emissions, energy and material use per unit of output (UNEP 2011, Krausmann and others 2009), indicating that we are becoming more efficient at how we produce, use and dispose of materials. “Resource extraction per capita has been stable or increasing only slightly. What economies worldwide need is absolute decoupling of the environmental pressure associated with resource consumption from economic growth. This will be easier to achieve to the extent that resource use itself becomes more efficient” (UNEP 2011). One policy option concerns eco-taxes, which put a price on the full costs of resource extraction and pollution, including emitting CO2 , polluting the environment through the use of chemicals, deforestation, overpumping of aquifers and overfishing; such incentives can stimulate employment and help in the transition to absolute decoupling and Green Economy (ILO 2009, UNEP 2011b). 80 100 120 140 160 180 1992 1997 2002 2007 Index, 1992=100 Population Material Intensity Resource Extraction Economic Development (GDP) Source: SERI Resource Efficiency
- 29. 19
- 31. 21 Global CO2 emissions continue to rise, with 80% emitted by only 19 countries Globally, CO2 emissions increased by 36% between 1992 and 2008, from around 22 000 million to just over 30 000 million tonnes. With general economic growth, plus developing countries such as Brazil, China and India investing significantly in large development, infrastructural and manufacturing projects, the growth of CO2 emissions in developing countries over the last few years climbed even more (between 1992 and 2008, a 64% increase of total CO2 emissions and 29% on a per capita basis). Latest estimates show that global CO2 emissions accumulated to 30 600 million tonnes in 2010 (IEA 2011). Large differences exist between regions and countries, with 80% of the global CO2 emissions being generated by 19 countries—mainly those with high levels of economic development and/or large populations. Total emissions of CO2 in developed countries increased by nearly 8%, and although per capita emissions declined steadily by 18%, they are still 10 times higher than those of developing countries. In addition, many developed countries profited from a significant shift of production to developing countries, thus leading to declining domestic emissions, but nevertheless increasing consumption-based emissions (Peters and others 2011). * from fossil fuels, gas flaring, cement production, as provided through the original source 0 10 20 30 40 50 1992 1997 2002 2008 Tonnes Emissions of CO2 * - per Capita - Developing +29%since 1992 Source: UNEP GEO Data Portal, as compiled from CDIAC, UNPD Developed -18%since 1992 Global +7%since 1992 0 10 20 30 1992 1997 2002 2008 Thousand Million Tonnes of CO2 Emissions of CO2 * - Total - 2010 Developed +8%since 1992 Developing +64%since 1992 Source: UNEP GEO Data Portal, as compiled from CDIAC Global +36%since 1992
- 32. 22 Despite global efforts to reduce CO2 emissions, they continue to rise due to the increasing use of fossil fuels... The main uses of fossil fuels are for generating electricity, enabling transport and producing heat. Their combustion leads to a release of CO2 into the atmosphere which in turn influences the earth’s climate. The production of cement not only demands very high levels of energy inputs, but also releases CO2 directly through the heating of calcium carbonate, which produces lime and carbon dioxide. It has also become the fastest growing source of CO2 emissions (+230% since 1992). Global efforts since 1992 to slow the growth of, and ultimately reduce the total level of CO2 emissions, have not yet fully succeeded. Those efforts must be strengthened; otherwise, it is very unlikely that the target of limiting temperature increase to 2°C by 2100 to reduce global warming, as agreed by global leaders in Cancun in 2010, will be met (IEA 2011). * from fossil fuels, gas flaring, cement production, as provided through the original source 0 5 10 15 20 25 30 1992 1997 2002 2007 2008 Source: UNEP GEO Data Portal, as compiled from CDIAC Emissions of CO2 * - Change, by Type - Solid Fuels Consumption Liquid Fuels Consumption Gas Fuels Consumption Cement Production Gas Flaring 100 125 150 175 200 225 250 Index, 1992=100 1992 1997 2002 2007 2008 Source: UNEP GEO Data Portal, as compiled from CDIAC Thousand Million Tonnes of CO2 Gas Flaring Cement Production Gas Fuels Consumption Liquid Fuels Consumption (e.g. fuel oil) Solid Fuels Consumption (e.g. coal) Emissions of CO2 * - Total, by Type - Source: UNEP GEO Data Portal, as compiled from World Bank, CDIAC
- 33. 23 ...however, production processes are becoming more energy-efficient Increasing efforts to “decouple” emissions and economic development are being witnessed, meaning reduction of emissions while still experiencing economic growth. Applying new technologies to use energy and resources more efficiently is an example of a means to accomplish decoupling. The graph above shows an annual efficiency gain of around 1.6%, and a total gain of 23% since 1992 (until 2007), indicating the start of a successful decoupling of emissions for each dollar of GDP generated. However, this may be partially influenced by the increasing value of the service industry, which has less energy- (and thus emission-) intensive impacts. In any case, the efficiency gains are still outweighed by the ongoing absolute increase in global emissions. 300 400 500 600 700 Grams of CO2 per $ 1 GDP -23% since 1992 Source: UNEP GEO Data Portal, as compiled from World Bank CDIAC 1992 1997 2002 2007 2008 Emissions of CO2 per GDP
- 34. 24 Over 60% of Greenhouse Gases are emitted by three economic sectors The energy supply sector, industry/manufacturing and forestry sectors together account for over 60% of all greenhouse gas (GHG) emissions. The forestry sector’s contribution is mainly through worldwide deforestation, as trees cut down to clear space for agriculture and other land uses can no longer absorb carbon dioxide, and if left to rot or burned, emit CO2 stored in trunks and leaves. Which sectors emit the most Greenhouse Gases? Per Cent contribution to global anthropogenic GHG emissions, 2004 0 5 10 15 20 25 30 Source: IPCC 2007 26 19 17 14 13 8 3 Energysupply (e.g.,electricityandheating) Industry Forestry(e.g.,deforestation) Agriculture Transport Residentialand commercial buildings Wasteandwastewater Per Cent
- 35. 25 The Montreal Protocol: “Perhaps the single most successful international agreement” 0 200 400 600 1992 1997 2002 2007 Thousand Tonnes of Ozone Depleting Potential 2009 -93% since 1992 Source: UNEP GEO Data Portal, as compiled from UNEP 0 40 80 120 160 200 0 10 20 30 40 50 1992 1997 2002 2007 2010 Area DU Source: NASA Dobson Units (DU)Area, Million km2 The ozone concentration in higher altitudes protects life on earth from the damaging ultraviolet (UV) rays of the sun. The ozone layer, especially above Antarctica, was rapidly diminishing until recently due to the use of Ozone- Depleting Substances (ODS). Thanks to the participation and commitment of nearly all countries (195 in 2011) in perhaps the “single most successful international agreement to date” (Kofi Annan, former UN Secretary-General, on the Montreal Protocol), the consumption of ozone- depleting substances decreased by 93% from 1992 to 2009, and 98% since the Protocol’s establishment in 1987. Production and consumption of ozone- depleting substances still continues through the use of compounds such as hydrochlorofluorocarbons (HCFCs), which have a global warming potential 77 to 2 300 times higher than CO2 and are still to be phased out, as well as through limited and strictly-controlled essential use exemptions (e.g. for specific agricultural purposes) or illegal use. The ozone hole over the Antarctic is showing only slow progress of recovery. The amount of ozone, measured in Dobson Units, varies yearly due to different temperatures in the Antarctic, but shows a small, positive, increase (WMO/ UNEP 2010). Consumption of Ozone-Depleting Substances Ozone Hole - Area and Minimum Ozone -
- 36. 26 The use of ODS has been controlled from 1987 onwards (and subsequently banned) under the Montreal Protocol. As of 1 January 2010, no new production of chlorofluorocarbons (CFCs) is permitted. Given that many of these substances are also potent greenhouse gases, the Protocol provided at the same time “substantial co-benefits by reducing climate change” (WMO/UNEP 2010): “From 1990 to 2010, the Montreal Protocol’s controls on production and consumption of ODSs [will] have reduced GHG emissions by the equivalent of a net 135 thousand million tonnes CO2 , which is equivalent to 11 thousand million tonnes CO2 per year” (Molina and others 2009). Over the past decade concentration and extent of ozone neither notably decreased nor increased (WMO/UNEP 2010). The ozone layer outside the Polar regions is expected to recover to its pre-1980 levels before 2050. However, the springtime ozone hole over Antarctica is expected to recover much later. Further expansion of the “ozone hole” has halted, but full recovery is still far away Source: NASA September 1992 September 1994 September 1996 September 1998 September 2000 September 2002 September 2004 September 2006 September 2008 September 2011 total ozone (Dobson Units) 110 220 330 440 550
- 38. 28 The concentration of carbon dioxide (CO2 ) in the Earth’s atmosphere has been measured at Mauna Loa, Hawaii since 1958, and at five other stations subsequently. It shows a steady mean increase from 357 ppmv (parts per million by volume) in 1992 to 389 ppmv in 2011. Seasonal variations of about 5 ppmv each year correspond to seasonal changes in uptake of CO2 by the world’s land vegetation, influenced by the greater vegetation extent and mass in the Northern hemisphere. The increase in atmospheric CO2 is primarily attributed to the combustion of fossil fuel, gas flaring and cement production and has been accelerating in recent years (IPCC 2007). The average amount of CO2 in the Earth’s atmosphere shows a steady rise over the last two decades 330 340 350 360 370 380 390 400 1992 1997 2002 2007 2010 2011 Parts per Million (ppm) Source: UNEP GEO Data Portal, as compiled from NOAA/ESRL +9%since 1992 Atmospheric CO2 Concentration / Keeling Curve
- 39. 29 Global mean temperature increased by 0.4°C between 1992 and 2010 0.0 0.2 0.4 0.6 0.8 1992 1997 2002 2007 2010 °C Global Annual Mean Temperature Anomaly NASA Goddard Institute for Space Studies * NOAA National Climatic Data Center * UK Meteorological Office, Hadley Centre and Climate Research Unit ** * relative to 1951-1980 mean global temperature ** relative to 1961-1990 mean global temperature Source: NASA, NOAA, UK-MetOffice Temperature Deviation - 2000-2009 vs. Mean* - Source: NASA *1951-1980 mean temperature The average annual mean atmospheric temperature shows yearly variations, caused for example by tropical El Niño-La Niña cycles. Viewed over a longer time period, one can nevertheless observe a slow, but steady increase with occasional peaks. The annual mean temperature, as displayed, is calculated by three leading climate research centres, producing slightly different values — the general upward trend however is the same for all of them, with an increase of about 0.2°C per decade (Hansen and others 2006). “Most of the observed increase in global average temperature since the mid- 20th century is very likely due to the observed increase in anthropogenic greenhouse gas concentrations” (IPCC 2007b). This map shows how much warmer temperatures during the decade 2000-2009 were compared to average temperatures recorded between 1951 and 1980 (a common reference period for climate studies). “The most extreme warming, shown in red, was in the Arctic. Very few areas saw cooler than average temperatures, shown in blue” (Voiland 2010). The last decade was the warmest on record since 1880; it was warmer than the previous record decade 1990-1999.
- 40. 30 The 10 hottest years ever measured have all occurred since 1998 According to rankings from four top US, British and Japanese climate research centers, the ten hottest years on record have all occurred since 1998. Eighteen out of the last 21 years feature among the 20 warmest years on record since (reliable) recording of temperature started in 1880. These data and findings add weight to the common conclusion of all four agencies and most of the scientific community, that in spite of short-term spatial and temporal variability the clear long-term trend is one of global warming (NOAA 2011, NASA 2011, UK-MetOffice 2011, JMA 2011). 1st 2nd 3rd 4th 5th 6th 7th 8th 9th 10th 1992 1993 1994 1995 1996 1997 1998 1999 2000 2001 2002 2003 2004 2005 2006 2007 2008 2009 2010 Rank 1st 2nd 3rd 4th 5th 6th 7th 8th 9th 10th Rank Source: UK-MetOffice, JMA Hadley Centre UK Meteorological Office NOAA National Climatic Data Center NASA Goddard Institute for Space Studies Japanese Meteorological Agency The Ten Hottest Years on Record highest rank = warmest year since recording began in 1880
- 41. 31 Far northern latitudes are seeing the most extreme changes in temperature The increase in global mean temperature is not occurring uniformly across the globe’s latitudinal zones. This graph of departure from the historical mean temperature (1951-1980) for the past six years shows this variation by latitude. Far northern latitudes are seeing the most extreme changes in temperature (see in particular the upper part of the graph representing the higher latitudes, and corresponding larger temperature anomalies). Among the consequences of this warming are melting of ice sheets and thawing permafrost. Furthermore, a study of 1 700 species found poleward migration of 40 km between 1975-2005 and vertical migration in alpine regions of 6 m per decade in the second half of the 20th century (Hansen and others 2006). 2005 2006 2007 2008 2009 0° 30°N 30°S 60°S 60°N 90°N 3.0º2.5º2.0º1.5º1.0º0.5º0º Cº above mean * per latitude zone 2010 Source: NASA 3.0º2.5º2.0º1.5º1.0º0.5º0º-0.5º* relative to 1951-1980 mean global temperature
- 42. 32 Oceans are also warming, while sea-level rise continues unabated As the global atmospheric temperature increased over the last decades, so also did the average ocean temperature. By comparing the last 20 years to the average of the last century, one can observe a steady warming of ocean waters, increasing from 0.22°C above the long-term average in 1992 to nearly 0.5°C in 2010. -10 0 20 40 60 MSL (MM) Global Mean Sea Level 1992 1997 2002 2007 2011 Source: University of Colorado 0 0.1 0.2 0.3 0.4 0.5 0.6 1992 1998 2004 2010 °C Ocean Temperature Deviation from 1901-2000 Average Source: NOAA Globally, sea level has been rising at an average rate of about 2.5 mm per year between 1992 and 2011. This is due to rising sea-water temperature and resulting thermal expansion, as well as the melting ice of the Arctic, Antarctic and Greenland ice sheets (Bindoff and others 2007). Scientific evidence supports the claim that current sea level rise is caused by global warming (Bindoff and others 2007), although different opinions exist about the exact link as well as future projections (Rahmstorf and Vermeer 2011).
- 43. 33 Oceans are becoming more acidic, with negative implications for corals and other marine life Increasing carbon dioxide (CO2 ) concentrations in the air alter the chemistry of the ocean’s surface, causing it to become more acidic (measured by the logarithmic pH) (Caldeira and Wickelt 2003). The ocean’s pH declined from 8.11 in 1992 to 8.06 in 2007 (Feely and others 2009). There is a “growing concern that the process called ocean acidification could have significant consequences on marine organisms which may alter species composition, disrupt marine food webs and ecosystems and potentially damage fishing, tourism and other human activities connected to the seas” (UNEP 2010b). Coral reefs are currently experiencing higher ocean temperatures and acidity than at any other time in at least the last 400 000 years. If this trend continues, all coral reefs will likely be threatened by mid-century, with 75 Per Cent facing high to critical threat levels (WRI 2011). The increase in oceanic CO2 concentrations (pCO2 in the graph), measured off the coast of Hawaii, is consistent with the atmospheric increase measured at Mauna Loa, Hawaii, within the statistical limits of the measurements (Feely and others 2009). R = 0.27 R = 0.95521 R = 0.22214 8.0 8.1 8.2 8.3 8.4 8.5 275 300 325 350 375 400 1992 1997 2002 2007 2010 pH ppm pCO2 CO2 pH Source: Feely and others 2009 Ocean Acidification
- 44. 34 Most mountain glaciers around the world are diminishing rapidly Changes in glaciers are key indicators of climate change. Nearly all mountain glaciers around the world are retreating and getting thinner, as measured by their annual mass balance, with “severe impacts on the environment and human well- being, including vegetation patterns, economic livelihoods, natural hazards, and the water and energy supply” (WGMS 2010). Diminishing glacier and ice cap volumes not only influence current sea-level rise but also threaten the well-being of approximately one-sixth of the world’s population who depend on glacier ice and seasonal snow for their water resources during dry seasons (WGMS 2008). Moreover, as most glaciers are rapidly diminishing, the speed with which this happens has been increasing in recent decades as well. For 30 glaciers observed (Zemp and others 2009), the average annual melting rate has increased from around 0.4 metres per year in the early 1990s to 0.7 metres of water equivalent per year over the last decade, thus almost doubling from one decade to the next, with record losses in 2004 and 2006 (WGMS 2010). The ongoing trend of worldwide and rapid glacier shrinkage may lead to the deglaciation of large parts of many mountain ranges by the end of the 21st century (WGMS/UNEP 2008). -15 -13 -11 -9 -7 -5 -3 1992 1997 2002 2007 Metres of Water Equivalent since 1980 2009 Source: UNEP GEO Data Portal, as compiled from WGMS equals an annual loss of ~ 0.4 m per year equals an annual loss of ~ 0.7 m per year Glacier Mass Balance
- 45. 35 The annual minimum extent of Arctic sea ice continues its steady decline Arctic sea ice extent has been declining since well before satellite measurements began in 1979 (NSIDC 2011). This decline has been most pronounced in September at the end of the summer melt season (Stroeve and others 2008). Several of the most extreme years have been since 2002, with the smallest sea ice extent ever recorded (4.17 million km2 ) occurring in 12 September 2007 (NSIDC 2011). Preliminary data for 2011 indicates that ice extent had reached its second smallest extent ever (4.33 million km2 on 9 September) (NSIDC 2011). The trend is believed to be the result of natural variability in air temperature and ocean and atmospheric circulation patterns, combined with climate change (Wang and Overland 2009). While the short data record precludes confident predictions, there is concern that multiple feedback processes such as reduced albedo could lead to rapid transition to virtually ice-free Septembers in the future—as soon as 2040 by one analysis (Wang and Overland 2009). Source: NSIDC 0 2 8 1992 1997 2002 2007 2010 Million km2 September Arctic Sea Ice Extent -35% since 1992 Source: NSIDC 4 6
- 47. 37 Primary forest area decreased by 300 million ha since 1990, or an area larger than Argentina Forests currently cover around 30% of the Earth’s land mass. Although the rate of deforestation is slowing down, large areas of primary forest and other naturally regenerated forests are declining, especially in South America and Africa, while forested areas in Europe and Asia are stable or increasing due to large- scale afforestation programmes. Around 13 million hectares of forest were converted to other uses or lost through natural causes each year between 2000 and 2010, compared to 16 million hectares per year during the preceding decade (FAO 2010). This results not only in biodiversity loss, but also contributes 12-15% to global warming by releasing CO2 into the atmosphere and hampering further CO2 storage (van der Werf and others 2009, UCSUSA 2011). “Millions of hectares of tropical forest are cleared every year to make way for agriculture, pastures and other non-forest uses, or are degraded by unsustainable or illegal logging and other poor land-use practices” (ITTO 2011). Also in decline since several decades ago are mangrove forests—important from social, economic and biological points of view. For example, “mangrove forests act as extremely effective carbon sinks, able to absorb [nearly 100] tonnes of carbon per hectare, or more than three times the absorptive capacity of non-mangrove forests” (UNDP 2011b). Between 1990 and 2010, 3% of mangrove extent was lost, mostly as a result of coastal development and conversions to agriculture and aquaculture (rice fields, shrimp farms). Using high-resolution satellite imagery, the extent of mangroves in 2000 was even found to be 13% less (blue point on the graph) than country statistics show (Giri and others 2010). -5 -4 -3 -2 -1 0 1 Million Hectares per Year 2 3 13 14 15 16 17 1990 1995 2000 2005 2010 Thousand Hectares Mangrove Forest Extent -3% since 1990 Source: FAO Forest Net Change Africa Asia + Pacific Europe Latin America + Caribbean North America 1990-00 2000-05 2005-10 Source: UNEP GEO Data Portal, as compiled from FAO
- 48. 38 Large portions of the Amazon rainforest were cleared for cattle pastures and farm fields Satellite images show that enormous areas of Amazon rainforest were cleared, mostly along an “arc of deforestation” on the southern boundary of the Amazon Basin. The Brazilian states of Rondônia, Para and Mato Grosso saw the largest losses (INPE 2010). Major roads such as the BR-163 running from north to south across the 1985 image of Mato Grosso (above), provided access to the forest (Fearnside 2007). Twenty years later much of the forest is gone, replaced by soy fields and cattle pastures. Severe droughts in 2005 and 2010 increased the frequency of fire, and have reinforced concerns that the Amazon is reaching a tipping point where large areas of forest could be replaced by a more savanna-like ecosystem (Lewis and others 2011, Nepstad and others 2008, Malhi and others 2009). Source: USGS; Visualization UNEP-GRID Sioux Falls SimonChirgwin/BBCWorldService/Flickr.com
- 49. 39 A gradually increasing percentage of the world’s forests has been replanted and is typically less diverse 0 50 100 150 200 250 300 1990 2000 2010 Million Hectares Forest Plantation Extent +54% since 1990 Forest plantations are generally intended for the production of timber, pulp and firewood, but along with other social and environmental benefits also stabilise soil and improve watershed protection. Since 1990, they have been growing at an annual rate of 2.2%, or around 4 600 thousand hectares annually, increasing from 170 to 265 million hectares globally. Over the 20-year period, this gain equals the size of a country such as Tanzania. The total plantation extent in 2010 represents 7% of the total forest area globally (FAO 2010b). Although these forests do not necessarily enrich local biodiversity since they are mostly composed of the same and/or introduced species, they can provide important ecosystem services such as timber, carbon and water storage and soil stabilisation. Roundwood production depends heavily on demand from the construction sector. Economic growth around the world stimulated production, until the economic crisis in 2008, when new construction activities — and thus demand for timber — severely declined. Some of the peaks (as for example in 2000, 2005 and 2007) in roundwood production are due to increased extraction of the numbers of trees as a result of severe storms (Eurostat 2011). Source: UNEP GEO Data Portal, as compiled from FAO 3 100 3 300 3 500 3 700 Million Solid Volume Units (CUM) Roundwood Production Source: UNEP GEO Data Portal, as compiled from FAO 1992 1997 2002 2007 2010
- 50. 40 Only about 10% of global forests are under certified sustainable management The Forest Stewardship Council (FSC) and the Programme for the Endorsement of Forest Certification (PEFC), the two largest forest certification bodies worldwide with slightly different approaches to management and certification, certify socially and environmentally responsible forestry. An impressive annual 20% growth rate of labeled forests indicates that both producers and consumers are actively influencing timber production. Nevertheless, in 2010 still only about 10% of the total forest extent was managed under FSC and PEFC practices. 0 50 100 150 200 250 Million Hectares +320% since 2002 +420% since 2002 FSC PEFC 2002 2006 2010 Source: UNEP GEO Data Portal, as compiled from FSC, PEFC Certified Forest Area
- 52. 42 Drinking water coverage increased to 87%, but the world is far from meeting the sanitation target of 75% Globally, improved sanitation coverage was just above the 60% mark in 2008, up from 54% in 1990, with over 2 500 million people still without access. Half of the people living in developing regions have no access to improved sanitation. In all regions, coverage in rural areas lags behind that of cities and towns. At the current rate of progress, the world will miss the MDG target of halving the proportion of people without access to improved sanitation by 2015. In fact, at the current rate of progress, it will take until 2049 to provide 75% of the global population with flush toilets and other forms of improved sanitation (UN 2011b). However, the good news is that the world will meet or even exceed the MDG drinking water target by 2015 if the current trend continues. By that time, nearly 90% of the population in developing regions, up from 77% in 1990, will have gained access to improved sources of drinking water. % of Population Drinking Water Coverage Improved Sanitation Coverage +13% since 1990 +13% since 1990 54 77 61 87 75 89 MDGTargets 2015 Source: UNEP GEO Data Portal, as compiled from WHO/UNICEF 100 50 60 70 80 90 1990 1995 2000 2005 2008 Improved Sanitation & Drinking Water Coverage
- 53. 43 The Mesopotamian Marshlands, nearly destroyed in the 1990s, have been partially restored but remain at risk The Mesopotamian Marshlands are the largest wetland ecosystem in the Middle East (Partow 2001). Construction of numerous dams, water diversions and hydropower facilities on the Tigris and Euphrates Rivers over the past century and the deliberate draining of the marshes by the Iraqi regime in the early 1990s had almost destroyed the wetlands by 2000 (Aoki and Kugaprasatham 2009). Reflooding beginning in 2003 helped restore many ecosystem functions for a large portion of the marshes (Richardson and Hussain 2006). In 2008, the eastern Hawizeh marshes were designated as Iraq’s first Ramsar Wetland Convention site and preparations are underway to inscribe the entire marshes as a joint cultural and natural site under the World Heritage Convention (Garsteck and Amr 2011). Ecosystem recovery, however, has been seriously undermined by a severe drought (2008-2010) and uncoordinated water-related developments in the Tigris-Euphrates basin (Garsteck and Amr 2011). The lack of a water sharing agreement between riparian countries and potential declines in Euphrates flows are a major threat to the wetlands’ survival. Source: USGS; Visualization UNEP-GRID Sioux Falls
- 55. 45 The Living Planet Index has declined by 12% at the global level and by 30% in the tropics The Living Planet Index reflects changes in the health of the earth’s ecosystems. It is based on monitoring almost 8 000 populations of over 2 500 vertebrate species. In contrast to the temperate biome, which is somewhat stable (after hundreds of years of biodiversity losses), all other indices show various degrees of decline. Biodiversity in the tropics is dramatically declining, by 30% since 1992, indicating the ecosystem’s severe degradation due to high deforestation rates of primary forest and transformation into agricultural land and pasture (WWF 2010). 60 80 100 120 1992 1997 2002 2007 Index, 1992=100 Global Tropical Temperate Freshwater Marine Terrestrial Source: WWF/ZSL Living Planet Index
- 56. 46 Each year 52 vertebrate species move one Red List category closer to extinction The Red List Index (RLI) measures the risk of extinction, divided into seven categories of extinction risk, as calculated from the IUCN Red List of Threatened Species. An RLI value of 1.0 equates to species not being expected to become extinct in the near future; a RLI value of zero indicates that all species have become ‘Extinct’ (Hoffman and others 2010). The graph shows that for those vertebrate groups where sufficient data are available, the trend is generally negative; i.e., that birds, mammals and amphibians are becoming increasingly threatened. The five principal pressures driving biodiversity loss are habitat change, overexploitation, pollution, invasive alien species and climate change (CBD 2010). “Almost one-fifth of extant vertebrate species are classified as ‘threatened’, ranging from 13% of birds to 41% of amphibians” (Hoffman and others 2010). On average, 52 species per year moved one category closer to extinction from 1980 to 2008. Amphibians are more threatened than birds and mammals, and are declining at a faster rate. The status of other groups is likely to be similar if not worse; nearly a quarter of plant species are estimated to be threatened with extinction (CBD 2010), and in some plant groups over 60% of species are considered threatened (Hoffman and others 2010). As renowned ecologist Edward O. Wilson puts it: “One small step up the Red List is one giant leap towards extinction”. The highest numbers of threatened vertebrates can be observed in the tropical regions, with figures disproportionally higher than in other regions (Hoffman and others 2010).0.70 0.75 0.80 0.85 0.90 0.95 1.00 1992 1997 2002 2007 2008 Red List Index of Species Survival Birds Amphibians Mammals worsebetter Source: Hoffman and others 2010 Red List Index
- 57. 47 13% of the world’s land surface, 7% of its coastal waters and 1.4% of its oceans are protected By 2010, there were over 148 000 protected areas in the world (IUCN 2011), covering almost 13% of the land area or 17 million square kilometres — an area as large as the Russian Federation. Marine protected areas, however, cover only around 7% of coastal waters (extending out to 12 nautical miles) and just above 1.4% of the oceans (IUCN/UNEP 2011, Toropova and others 2010). Likely due to time lags in reporting, the overall rate of increase in setting aside protected areas is levelling off in recent years, yet saw a total increase of 42% between 1992 and 2010. New targets for the extent of protected areas globally were set by governments in the Nagoya Protocol, negotiated in October 2010. Under a 20-point plan, they made commitments to protect 17% of terrestrial and inland waters, and 10% of coastal and marine areas, especially areas of particular importance for biodiversity and ecosystem services, until 2020 (CBD 2010b). 0 5 10 15 20 1992 1997 2002 2007 2010 Million km2 Protected Areas - Total Area - Marine & Coastal Terrestrial & Coastal Terrestrial Coastal +42% since 1992 +120% since 1992 +38% since 1992 +210% since 1992 Source: UNEP GEO Data Portal, as compiled from IUCN, UNEP-WCMC 0 2 4 6 8 10 12 14 1992 1997 2002 2007 2010 Per cent Protected Areas - Per cent - Terrestrial Coastal 17% target “terrestrial” 2020 10% target “coastal & marine” Marine & Coastal Source: UNEP GEO Data Portal, as compiled from IUCN, UNEP-WCMC
- 59. 49 Both the number of tanker oil spills recorded and the quantity of oil involved have declined in 20 years 0 50 100 150 200 0 10 20 30 40 50 1992 1997 2002 2007 2010 Quantity [Thousand Tonnes]Number of Spills Source: ITOPF The number as well as the total quantity of oil from accidental oil spills from tankers (including combined carriers and barges) have decreased significantly since 1992. Although the vast majority of spills are relatively small (i.e., less than seven tonnes) (ITOPF 2011), the accumulated amount is nearly one million tonnes since 1992. “Most spills from tankers result from routine operations such as loading, discharging and bunkering which normally occur in ports or at oil terminals” (ITOPF 2011). Oil Spills from Tankers
- 60. 50 The amount of plastics* produced globally grew steadily from 116 million tonnes in 1992 to around 255 million tonnes in 2007, when the economic crisis led to a drop. But in 2010, a new record value of 265 million tonnes had already been reached. This total increase of 149 million tonnes in eighteen years equals a growth of around 130%, or 15% annually. The average use of plastic in developed regions reached around 100 kg per year per capita in 2005, whereas consumption in developing regions is only around 20 kg, with rapid increases foreseen in the next decade (UNEP 2011c). About 50% of plastic is used for single-use disposable applications, such as packaging, agricultural films and disposable consumer items (Hopewell and others 2009). Plastics debris in the ocean has become particularly notorious in recent years. Concentrated along shorelines or in huge, swirling open-sea gyres, such material threatens the lives of many marine organisms, especially seabirds and small mammals (UNEP 2011c). Plastics decompose very slowly, creating a major long-term environmental impact 100 150 200 250 300 1992 1997 2002 2007 2010 Million Tonnes +130%since 1992 Source: EuroPlastics *not including Polyethylene terephthalate (PET), Polyamide (PA) and polyacryl fibres Plastics Production
- 62. 52 Both human losses and economic damage from natural disasters show an upward trend Although there is no clear indication that hazard occurrences (such as floods, droughts and hurricanes) have changed much in recent times (UN 2011c), the number of reported disasters has been increasing significantly. Indeed, “over the past two decades the number of reported natural disasters has doubled from around 200 to over 400 per year. In 2010, over 90 Per Cent of disaster displacement within countries was attributed to climate-related hazards” (NRC 2011). The risks are changing, mainly due to population increase, climate change and ecosystem degradation. The risks to humans and economic losses are increasing in absolute terms for all principal hazards, except for landslides, where the tendency appears to be stable. Relative risk, however, when measured as a proportion of population or GDP, is stable, and in the case of mortality, may even be declining (UN 2011c). 0 100 200 300 400 500 600 1992 1997 2002 2007 2010 Number Source: EM-DAT 0 100 000 200 000 300 000 400 000 500 000 0 50 100 150 200 250 1992 1993 1994 1995 1996 1997 1998 1999 2000 2001 2002 2003 2004 2005 2006 2007 2008 2009 2010 Damage Deaths Damage Thousand Million US$, Inflation-adjustedNumber of Deaths Source: EM-DAT Impacts of Natural Disasters Reported Natural Disasters
- 63. 53 Increased exposure to natural disasters has resulted from more people living in hazard-prone areas 50 100 150 200 Index, 1980=100 1990 2000 2010 Exposure Vulnerability Risk Source: UNISDR Source: UNISDR 50 �� 100 125 150 Index, 1980=100 1990 2000 2010 Exposure Vulnerability Risk To quantify trends in disaster risk, one has to consider all three components of risk: hazard, exposure and vulnerability.* In all regions, human exposure is increasing mainly due to demographical factors: an increasing population with more people moving to hazard-prone areas. In most regions, vulnerability is decreasing, thanks to factors such as improved governance and better urban and land planning. At a global level, this decline in vulnerability compensates for the increase in exposure, thus stabilising or even decreasing the risk. However, this global trend is mostly related to a significant decline in vulnerability in China. If China were removed from the analysis, the risk would still be increasing due to a significant rise in exposure. The global trend hides large regional differences (UN 2011c). Note: *Risk is the probability of losses (mortality and economic losses) from a specific hazard, according to its intensity, location and time period. Risk has three components: the hazard (probability of a hazardous event occurring at a specific intensity); exposure (number of people or assets) located in hazard-prone areas; and vulnerability (percentage of losses, should a hazardous event occur). A disaster can occur when a vulnerable population is hit by a hazardous event. Floods - Mortality Risk, Exposure and Vulnerability - Tropical Cyclones - Mortality Risk, Exposure and Vulnerability -
- 65. 55 Numerous international agreements were negotiated in the two decades following the Rio Conference in 1992 The steady increase of countries signing Multilateral Environmental Agreements (MEAs) such as the Convention on Biological Diversity, the Ramsar Convention or the Kyoto Protocol signifies rising political recognition of environmental issues. The graph includes 14 MEAs* and shows the total number of signatories for those 14 taken together (thus, if all 14 MEAs were signed by all 196 countries, the number would be 14 x 196 = 2744). Altogether, the number of newly established global and regional MEAs is steadily decreasing, demonstrating that legal frameworks are in place to address many important issues. Neither establishing or signing an agreement or convention, however, means that the related environmental problems have been solved. Most countries have signed at least nine out of the 14 major MEAs; 60 countries have signed all of them. Only a few countries or territories or countries in conflict have not signed the majority of these MEAs. 4 - 9 10 - 14 no data Source: UNEP GEO Data Portal, as compiled from various MEA secretariats *Basel Convention, Cartagena Convention, Convention on Biological Diversity, Convention on International Trade in Endangered Species of Wild Fauna and Flora, Convention on Migratory Species, World Heritage Convention, Kyoto Protocol, Secretariat for the Vienna Convention and for the Montreal Protocol, Ramsar Convention, Rotterdam Convention, Stockholm Convention, Convention to Combat Desertification, Convention on the Law of the Sea, Framework Convention on Climate Change 0 10 20 30 40 50 0 500 1 000 1 500 2 000 2 500 1992 1997 2002 2007 2010 Accumulated Number of Signatories to 14 Global MEAs Number of new MEAs +330%since 1992 Number of Signatories New MEAs Source: UNEP GEO Data Portal, as compiled from various MEA secretariats,IEA Database Project Multilateral Environmental Agreements - Number and Signatories - Number of MEAs Signed
- 66. 56 The private sector is increasingly adopting environmental management standards The International Organization for Standardization (ISO) has developed over 18 500 international standards on a variety of issues. The ISO 14000 standard is primarily concerned with “environmental management”. In effect, it codifies what practices and standards companies should follow to minimize harmful impacts on the environment caused by their activities and to achieve continual improvement of environmental performance. With annual growth rates of over 30% and 230 000 certificates granted in 2009, this development demonstrates a growing number of companies’ commitment to adopting environmental management systems. 0 50 100 150 200 250 1999 2004 2009 Number of Certificates in Thousands +1500% since 1999 Source: UNEP GEO Data Portal, as compiled from ISO ISO 14001 Certifications
- 67. 57 Trading in CO2 emissions has grown rapidly, but in 2010 still only equalled 1/500 of the global GDP Following five consecutive years of robust growth, the carbon market reached a three-year plateau between 2008-2010 with a value of around US$ 140 thousand million (World Bank 2011), which equals about 1/500 of global GDP. The rise on global market trends since 2005 — the first year of the Kyoto protocol — is mostly due to increase in transactions volume. Carbon prices have not been spared by the economic downturn. In less than a year, prices fell from € 30 to € 8 on the European market (World Bank 2010). In addition, due to a lack of clarity about regulations in a post-Kyoto regime after 2012, some of the implemented mechanisms are today suffering rather large losses in value. Out of the total amount of allowances, the EU Emissions Trading System launched in 2005 accounts for 84% to 97% of the global carbon market value in 2010 (World Bank 2011). 0 30 60 90 120 150 2005 2006 2007 2008 2009 2010 Thousand Million US$ Source: World Bank Carbon Market Size +1200% since 2005
- 68. 58 Total foreign aid from bilateral and multilateral donors increased overall during the last two decades, starting at US$ 145 thousand million in 1992 and reaching close to US$ 215 thousand million in 2008. Funding dedicated to environmental aid purposes, however, fluctuated more widely and declined overall until 2003, before rising dramatically within the next few years. By 2008, the share of environmental aid from total foreign aid dropped again to less than 4%, down from 5.5-7.0% in 1992-1993. Funding to support the environment has not kept up with the increase in total foreign aid since 1992 0 40 80 120 160 200 240 3 5 7 9 11 13 15 1992 1996 2000 2004 2008 Total Environmental Aid Total Foreign Aid Source: AidData.org Thousand Million Constant 2000 US$ Thousand Million Constant 2000 US$ Total Foreign Aid and Environmental Aid
- 69. 59 Environmental governance and energy initiatives receive the largest share of environmental aid When one examines the amounts of aid received from bilateral and multilateral donors by different environmental sectors, it becomes clear that large differences exist. A major share of environmental aid funds is dedicated to energy conservation and to the development and implementation of environmental policies (Governance). This graph shows that from 1992- 1997, aid to energy conservation was distinctly larger than any other sector; however, by 2008 it was being surpassed by the Governance sector. Other areas such as biodiversity protection, land management, water resources and marine protection receive far smaller amounts. 0 2 4 6 1992 1994 1996 1998 2000 2002 2004 2006 2008 Thousand Million Constant 2000 US$ Energy Conservation and Renewables Sustainable Land Management Marine Protection Environmental Governance Water Resources Protection Natural Resources Management and Biodiversity Protection Waste Management Source: AidData.org *Note: see Annex Aid Allocated to Environmental Activities*
- 71. 61 Food production has continued to rise steadily at a pace exceeding population growth 100 120 140 160 1992 1997 2002 2007 2009 Index, 1992=100 Livestock Food Population +45% since 1992 +26% since 1992 Crops Source: FAO Global food production has continued to keep pace with and even exceed population growth over the past two decades. Gains in production have come primarily from improved yields and to a lesser extent from new agricultural land. However, despite solid gains made in food security, millions in developing countries still face chronic hunger and malnutrition. More significant gains in agricultural production will be necessary to meet continued global population growth. These will require expanding farm land and using more intensive production techniques. Such practices have known negative impacts on the environment, including loss of biodiversity and pollution from nitrogenous fertilizers and other agricultural chemicals. A more sustainable solution, as highlighted by the ‘Special Rapporteur of the UN on the Right to Food’, is to upscale agroecology, a method of creating beneficial interactions and synergies among the components of the agroecosystem (UN 2010b). Food Production Index
- 72. 62 Higher agricultural yields depend heavily on the use of fertilizers The increasing amounts of cereal crops being produced are only marginally linked to the total area under cultivation. Their increase is almost exclusively dependent on intensification, where the use of fertilizers plays a major role (UNEP 2011). The heavy dependence on machines and materials increases energy usage and leads to the fact that it takes an average of seven to ten calories of input energy (i.e., mostly fossil fuels) to produce one calorie of food (Heller and Keoleian 2000, Pimentel and Pimentel 1996). Nitrogenous fertilizers, the use of which grew by around 1 500 thousand tonnes per year, supply plant nutrients and enrich soil fertility, but can lead to eutrophication of inland and marine waters, and increase the release of very potent greenhouse gases, such as N2 O. 90 100 110 120 130 140 1992 1997 2002 2007 2009 Index, 1992=100 Nitrogenous Fertilizer Consumption Cereals - Production Cereals - Area Harvested Source: UNEP GEO Data Portal, as compiled from FAO Cereal Production, Area Harvested and Fertilizer Consumption
- 73. 63 While increasing irrigation infrastructure can raise crop yields, it puts further pressure on freshwater availability 2.5 3.0 3.5 Million km2 Total Area Equipped for Irrigation 2.0 1992 1997 2002 2007 2009 Areas equipped for irrigation have expanded steadily (21% since 1992), providing improved food security and productivity in many water-constrained environments. However, irrigation accounts for approximately 70% of total freshwater withdrawals worldwide (UNESCO 2001) and is seen as one of the principal factors in an increasing state of water scarcity. Globally, there is adequate potential for expanding irrigation to help meet production needs for a growing population. However, many of the regions where irrigation is likely to expand are subject to freshwater and/or land scarcity. Irrigation expansion into sensitive ecosystems may lead to significant losses of natural habitat. Conversely, intensification of agriculture through irrigation can reduce the footprint of agriculture, sparing valuable natural areas. There is a strong need in general to increase water use efficiency under irrigated agriculture regimes. Source: UNEP GEO Data Portal, as compiled from FAO Area equipped for irrigation (2000) s Source: Siebert and others 2007 +21% since 1992
- 74. 64 Enormous irrigation projects using fossil water turned Saudi Arabia into an exporter of food Rich in oil but lacking abundant renewable water resources, Saudi Arabia used oil revenues to develop domestic agriculture based on groundwater from non-renewable aquifers (Elhadj 2006). Subsidies, direct and indirect, led to astonishing growth in agricultural output (Royal Embassy of Saudi Arabia n.d.). Large center-pivot irrigation projects such as the one above at Wadi As-Sirhan appeared in the vast Saudi desert. However, by one calculation the cost of wheat produced reached around US$ 500 per tonne, several times the cost of imported wheat (Elhadj 2006). In 2008, the Saudi government announced plans to phase out wheat production by 2016 (Gulfnews 23 Apr. 2009). Source: USGS; Visualization UNEP-GRID Sioux Falls
- 75. 65 Organic farming is a form of agriculture that excludes or strictly limits the use of chemical fertilizers and pesticides, and builds on integrating crops and livestock, diversifying species and recycling nutrients on the farm, among other practices that favour natural processes (UN 2010b). It has expanded significantly from a very low baseline of around 110 000 km2 in 1999, to covering an area of over 370 000 km2 in 2009 (an increase of nearly 240%), an area that equals the size of a country such as Japan or Germany. Nevertheless, the percentage of agricultural land managed under certified ecological practices is still less than 1% globally. Land area used for organic farming is growing at an annual rate of nearly 13% 0 100 200 300 400 1999 2004 2009 Thousand km2 Source: Organic World Organic Farming +240% since 1999
- 76. 66 Three crops have expanded dramatically in the tropics, often replacing primary forests Sugar cane, soybeans, and palm oil are cultivated on a massive scale in the tropics; their area grew from just above 8 million km2 in 1992 to nearly 14 million km2 in 2009, a nearly 75% increase. Oil palm plantations showed the largest increase of 120% between 1992 and 2009, followed by soybeans (75%) and sugar cane (30%). However, soybean plantations occupy the largest area and also show the highest absolute growth, expanding from 6 250 thousand km2 in 1992 to nearly 10 000 thousand km2 in 2009. These crops are largely being raised for the production of ethanol (sugar cane), export for livestock fodder (soybeans) and ingredients for food and drug products or other biofuel production (palm oil). In many or most cases they are grown on industrial-scale farms established by the clear-cutting or burning of vast areas of tropical forest (ITTO 2011, UCSUSA 2011, FAO 2006). Soybeans and sugarcane have been powerful drivers of forest loss in South America, while palm oil is widely grown in Indonesia. The rapid losses of these forests are among the most dramatic land-use changes in human history. +30% since 1992 +75% since 1992 +120% since 1992 50 100 150 200 250 1992 1997 2002 2007 2009 Index, 1992=100 Palm oil Sugar Cane Soybeans Source: UNEP GEO Data Portal, as compiled from FAO Source: UNEP GEO Data Portal, as compiled from FAO0 5 10 15 1992 1997 2002 2007 Million km2 2009 Sugar Cane Soybeans Palm oilSource: UNEP GEO Data Portal, as compiled from FAO Selected Crops in Humid Tropical Countries - Change in Area - Selected Crops in Humid Tropical Countries - Area -
- 77. 67 Ever-increasing numbers of grazing animals degrade already impoverished grasslands The numbers of grazing animals (other than sheep) have surged over the last 20 years. The number of cattle and buffaloes has increased by 6% and 23% respectively, and goats by an even greater rate of 45%. These increases in grazing animal herds are significant, due to the impacts they have on the landscape, particularly fragile grasslands. Their hooves pulverize the soil, breaking up the thin crust formed by rainfall and allowing valuable topsoil to be more easily eroded by wind (Brown 2011). Degraded grassland turns into shrubland, which is unable to sustain cattle and sheep, but on which goat populations continue to thrive. The goat population is very unevenly distributed globally: in 2009, 60% were in Asia and 34% in Africa. 80 100 120 140 160 1992 1997 2002 2007 2009 Index, 1992=100 Buffaloes Cattle Goats Sheep +45% since 1992 +23% since 1992 +6% since 1992 -7% since 1992 Source: FAO Grazing Animal Herds