Downloaded 34 times

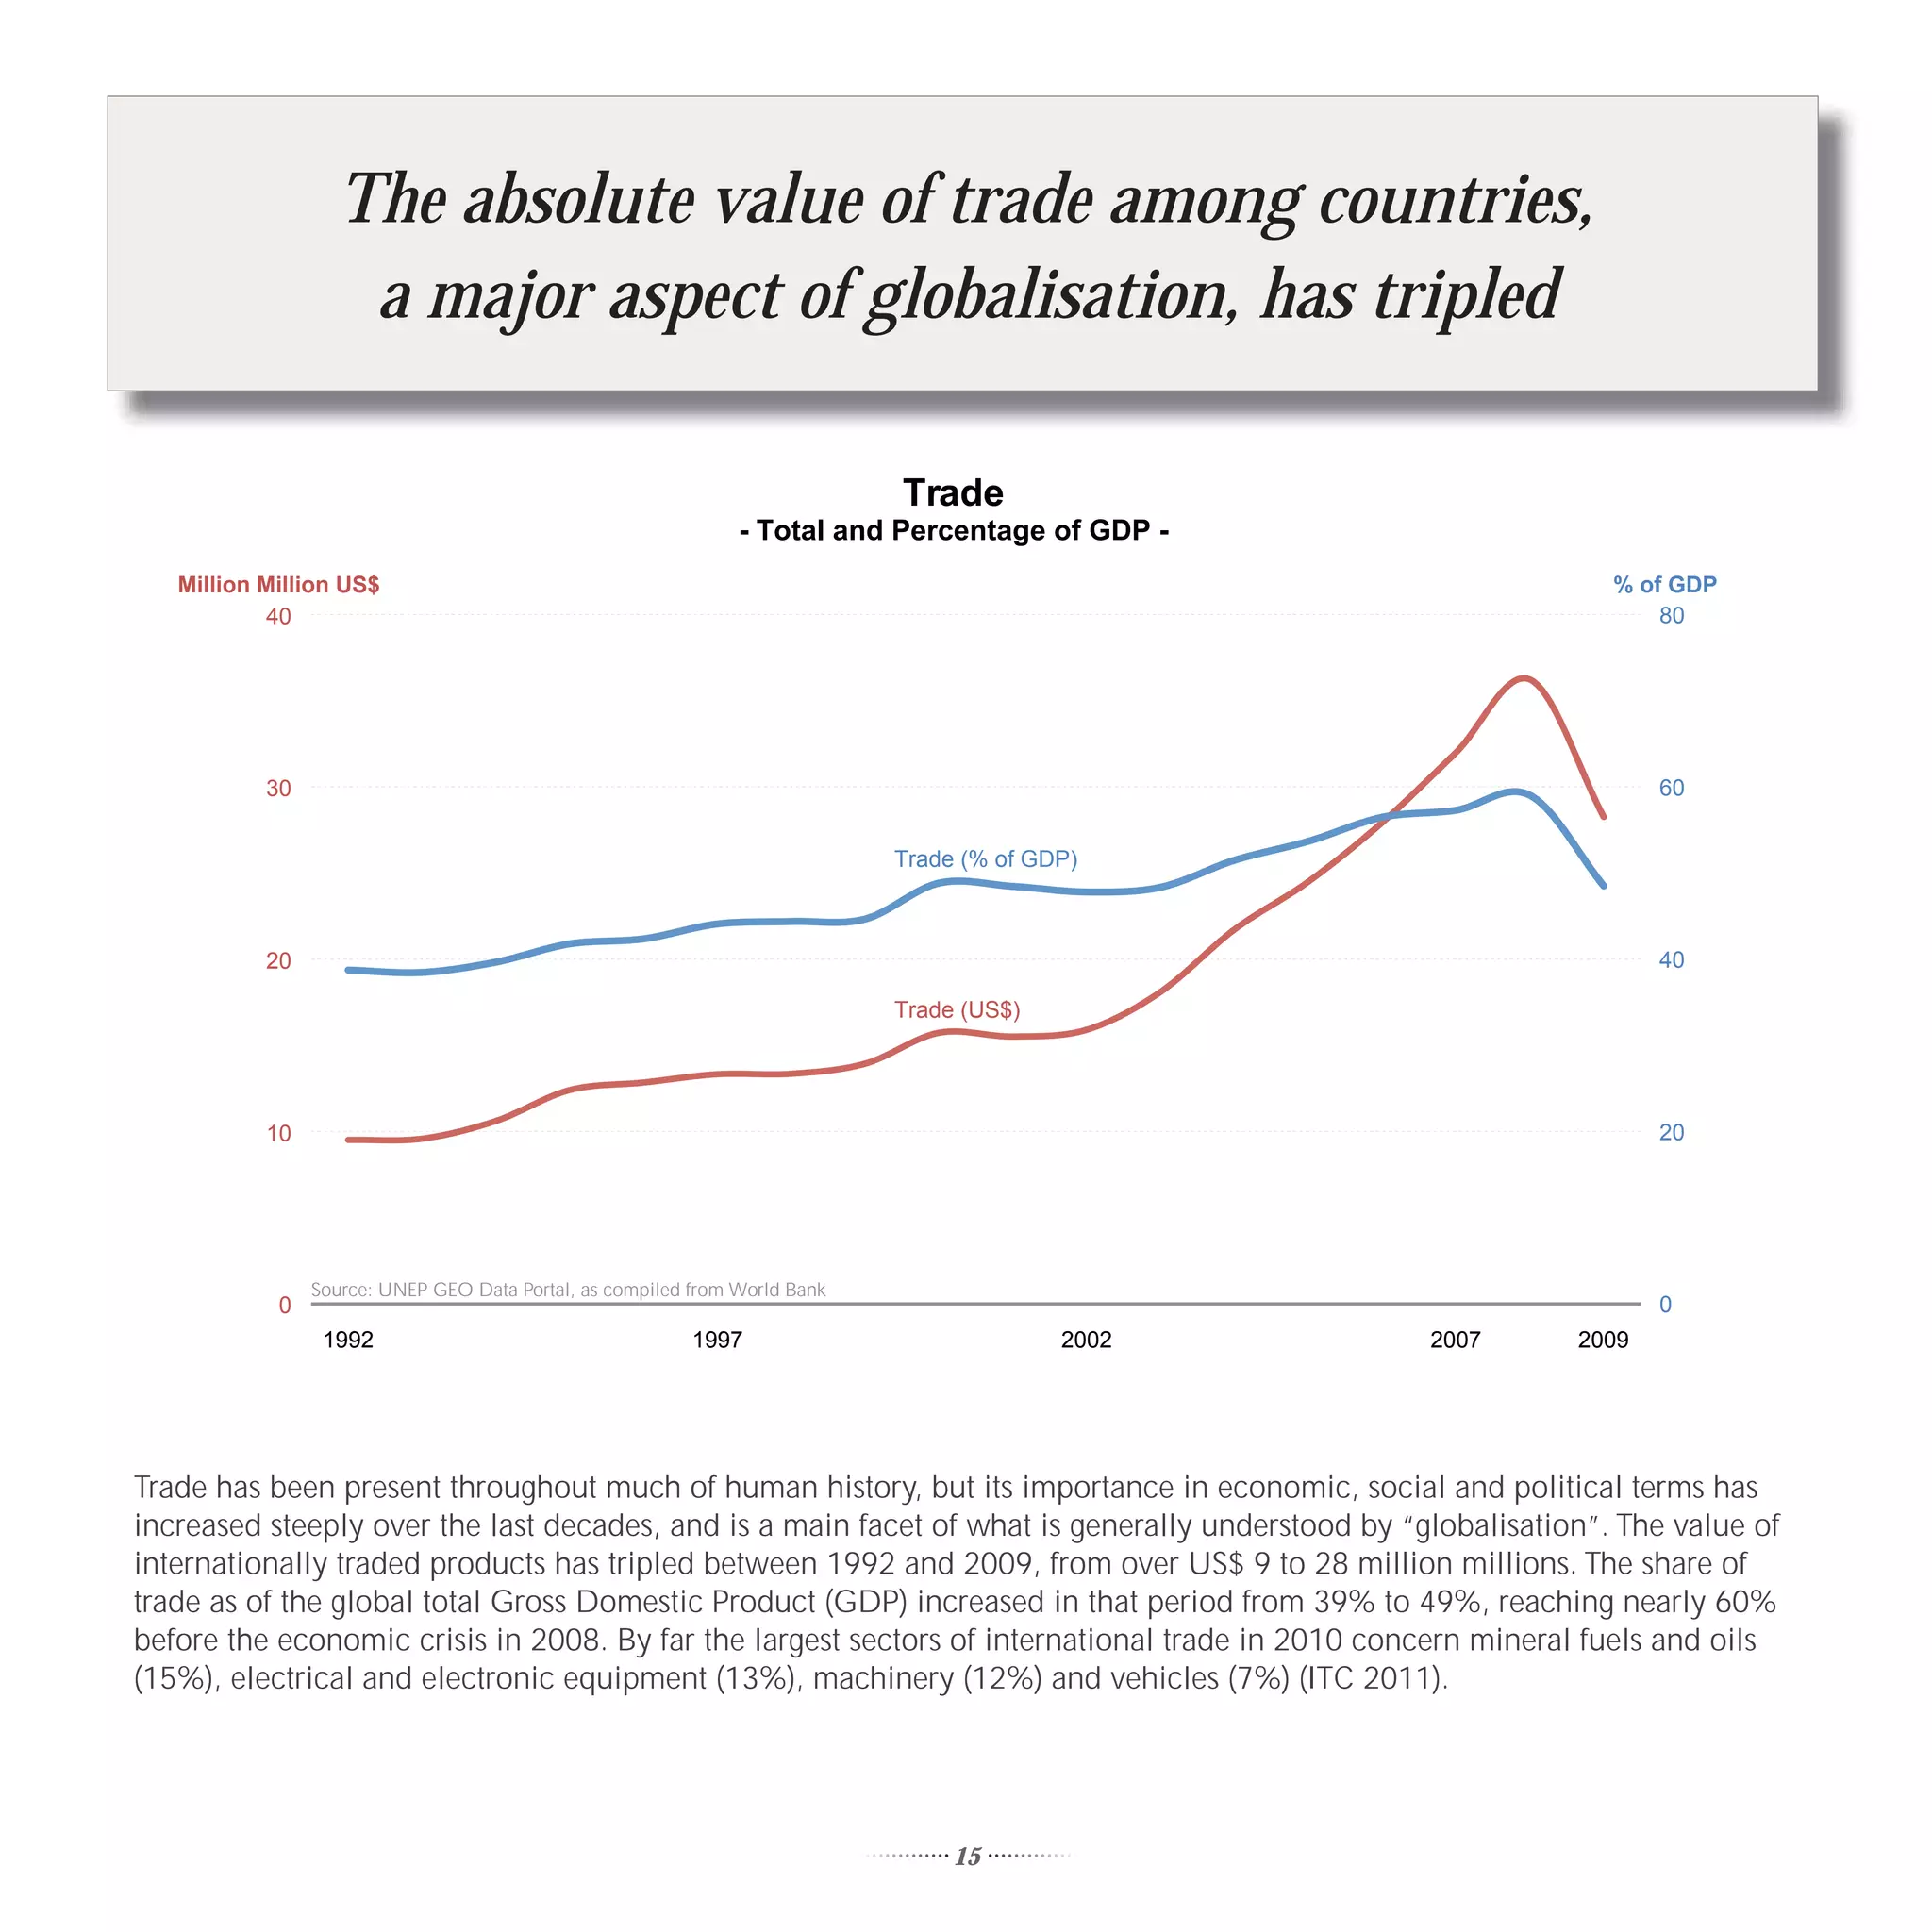
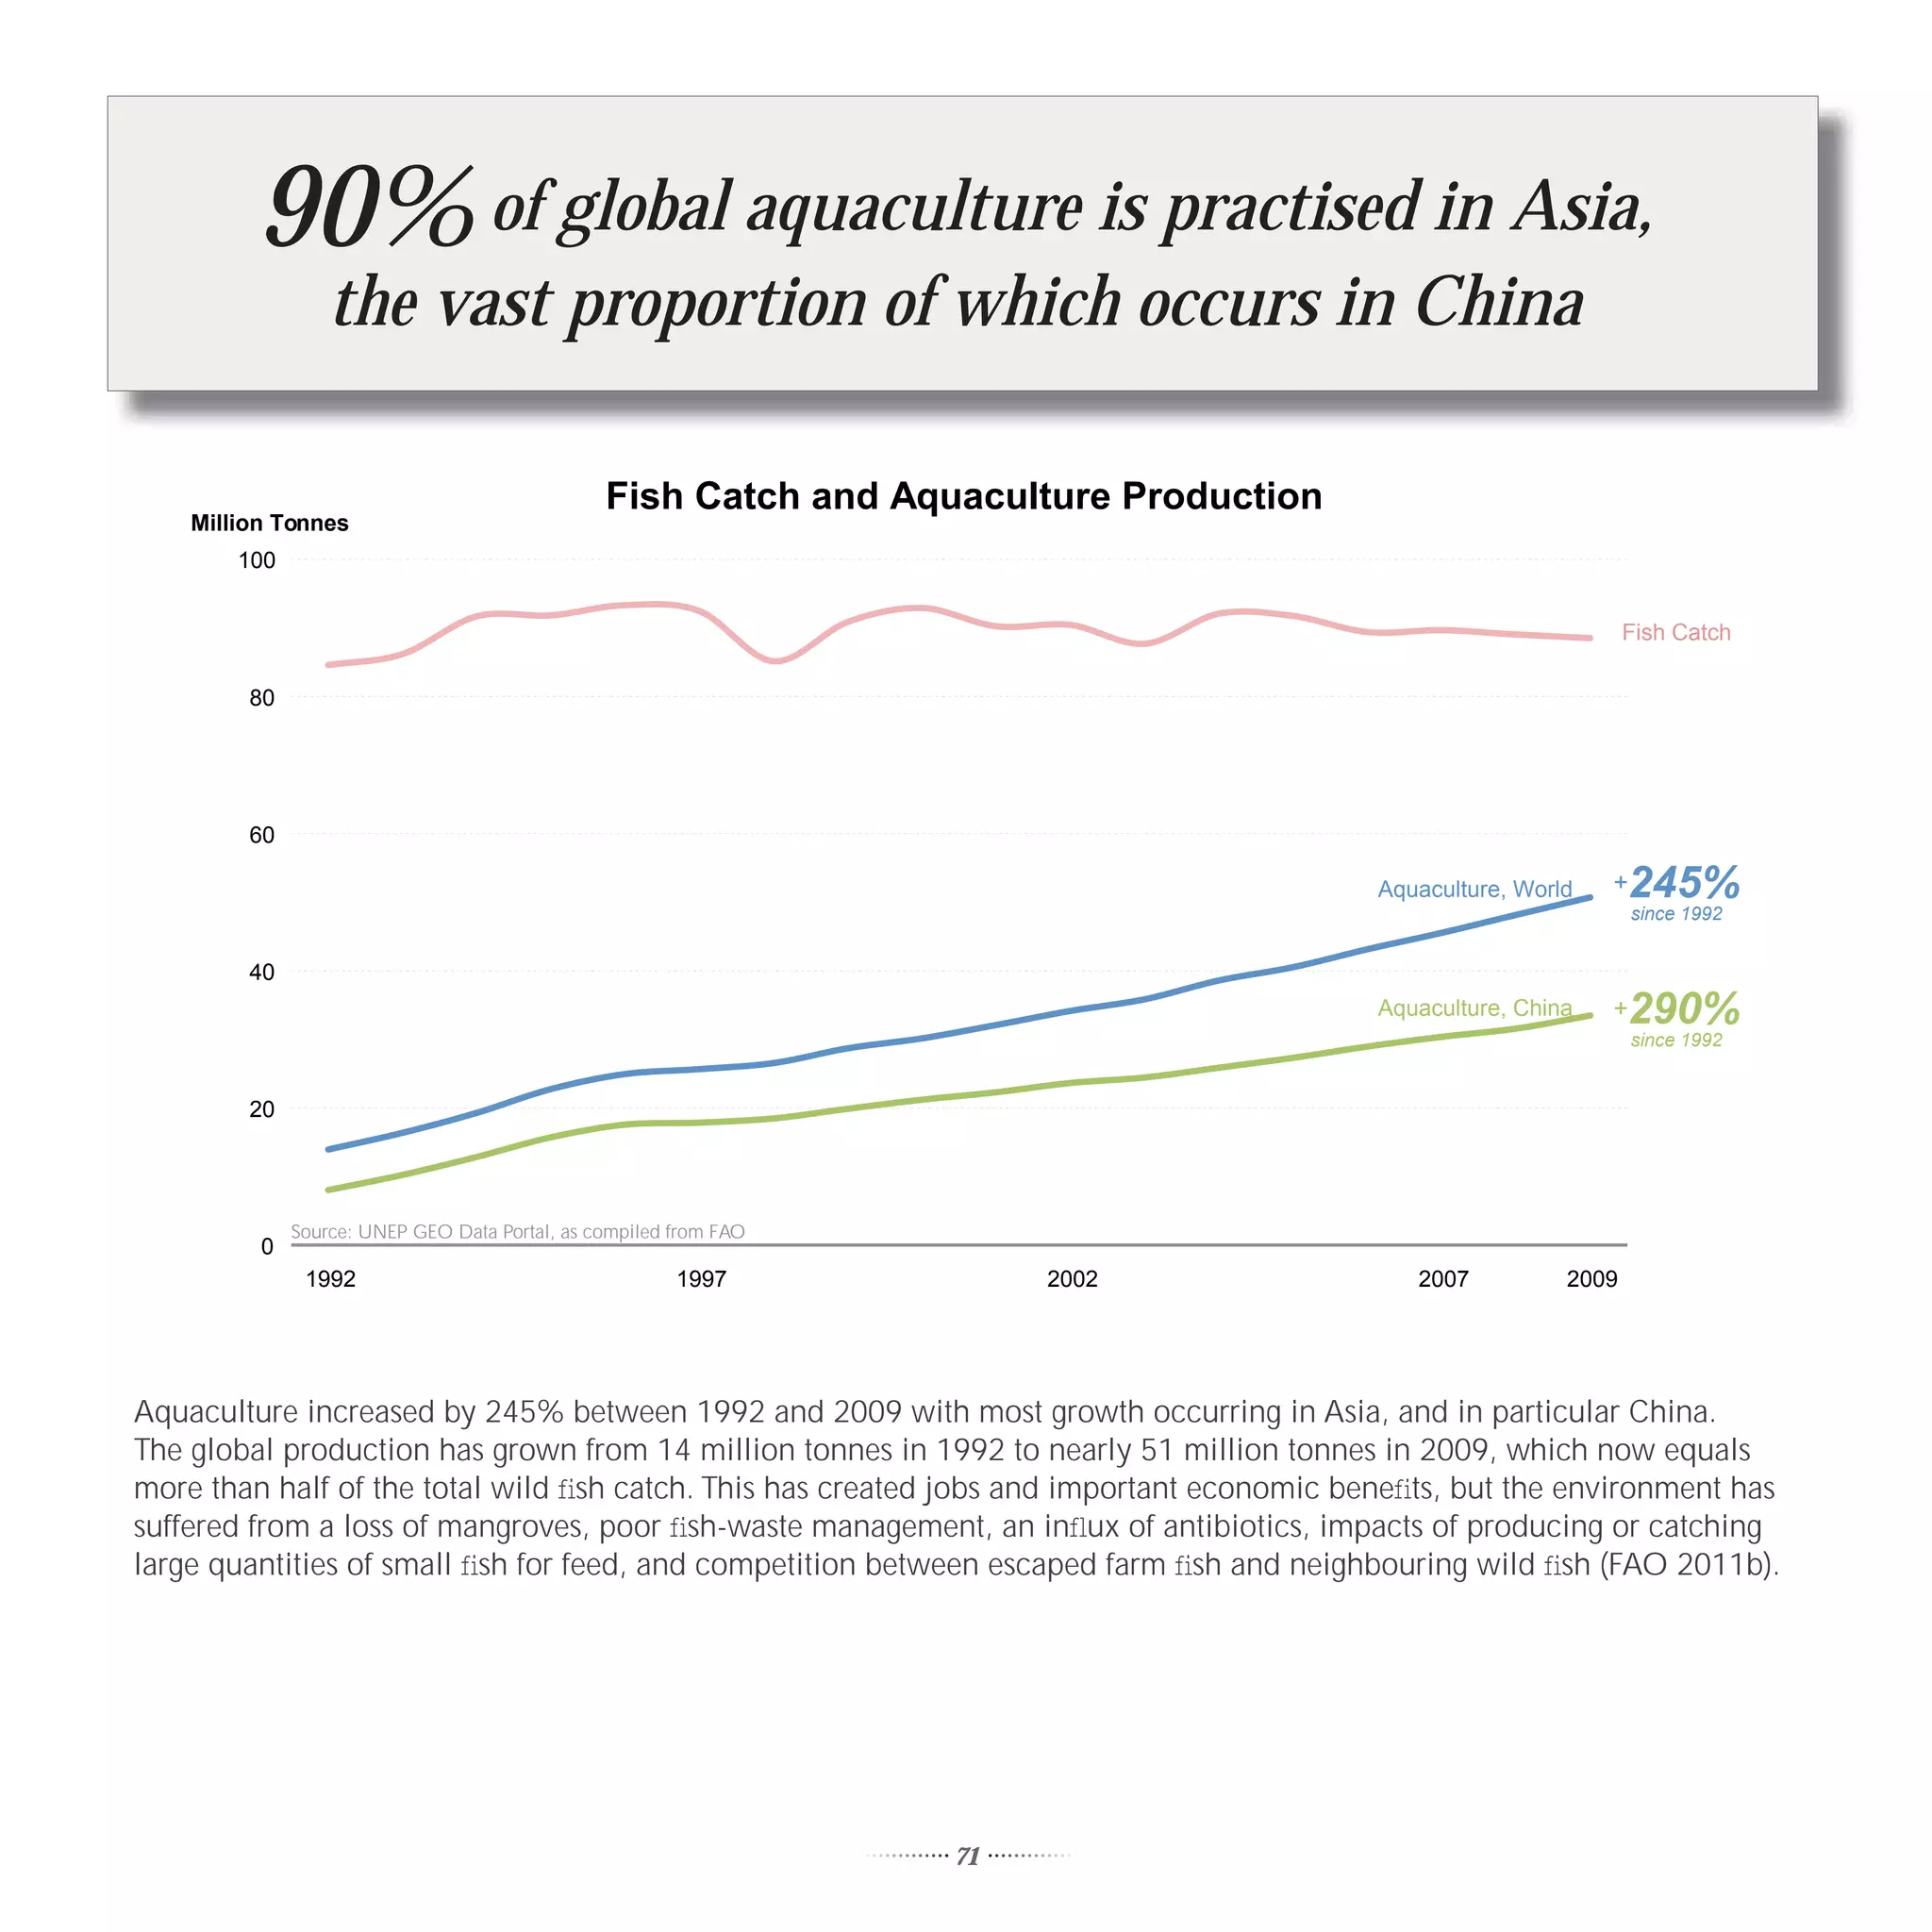
![In 2011, over 3 500 million
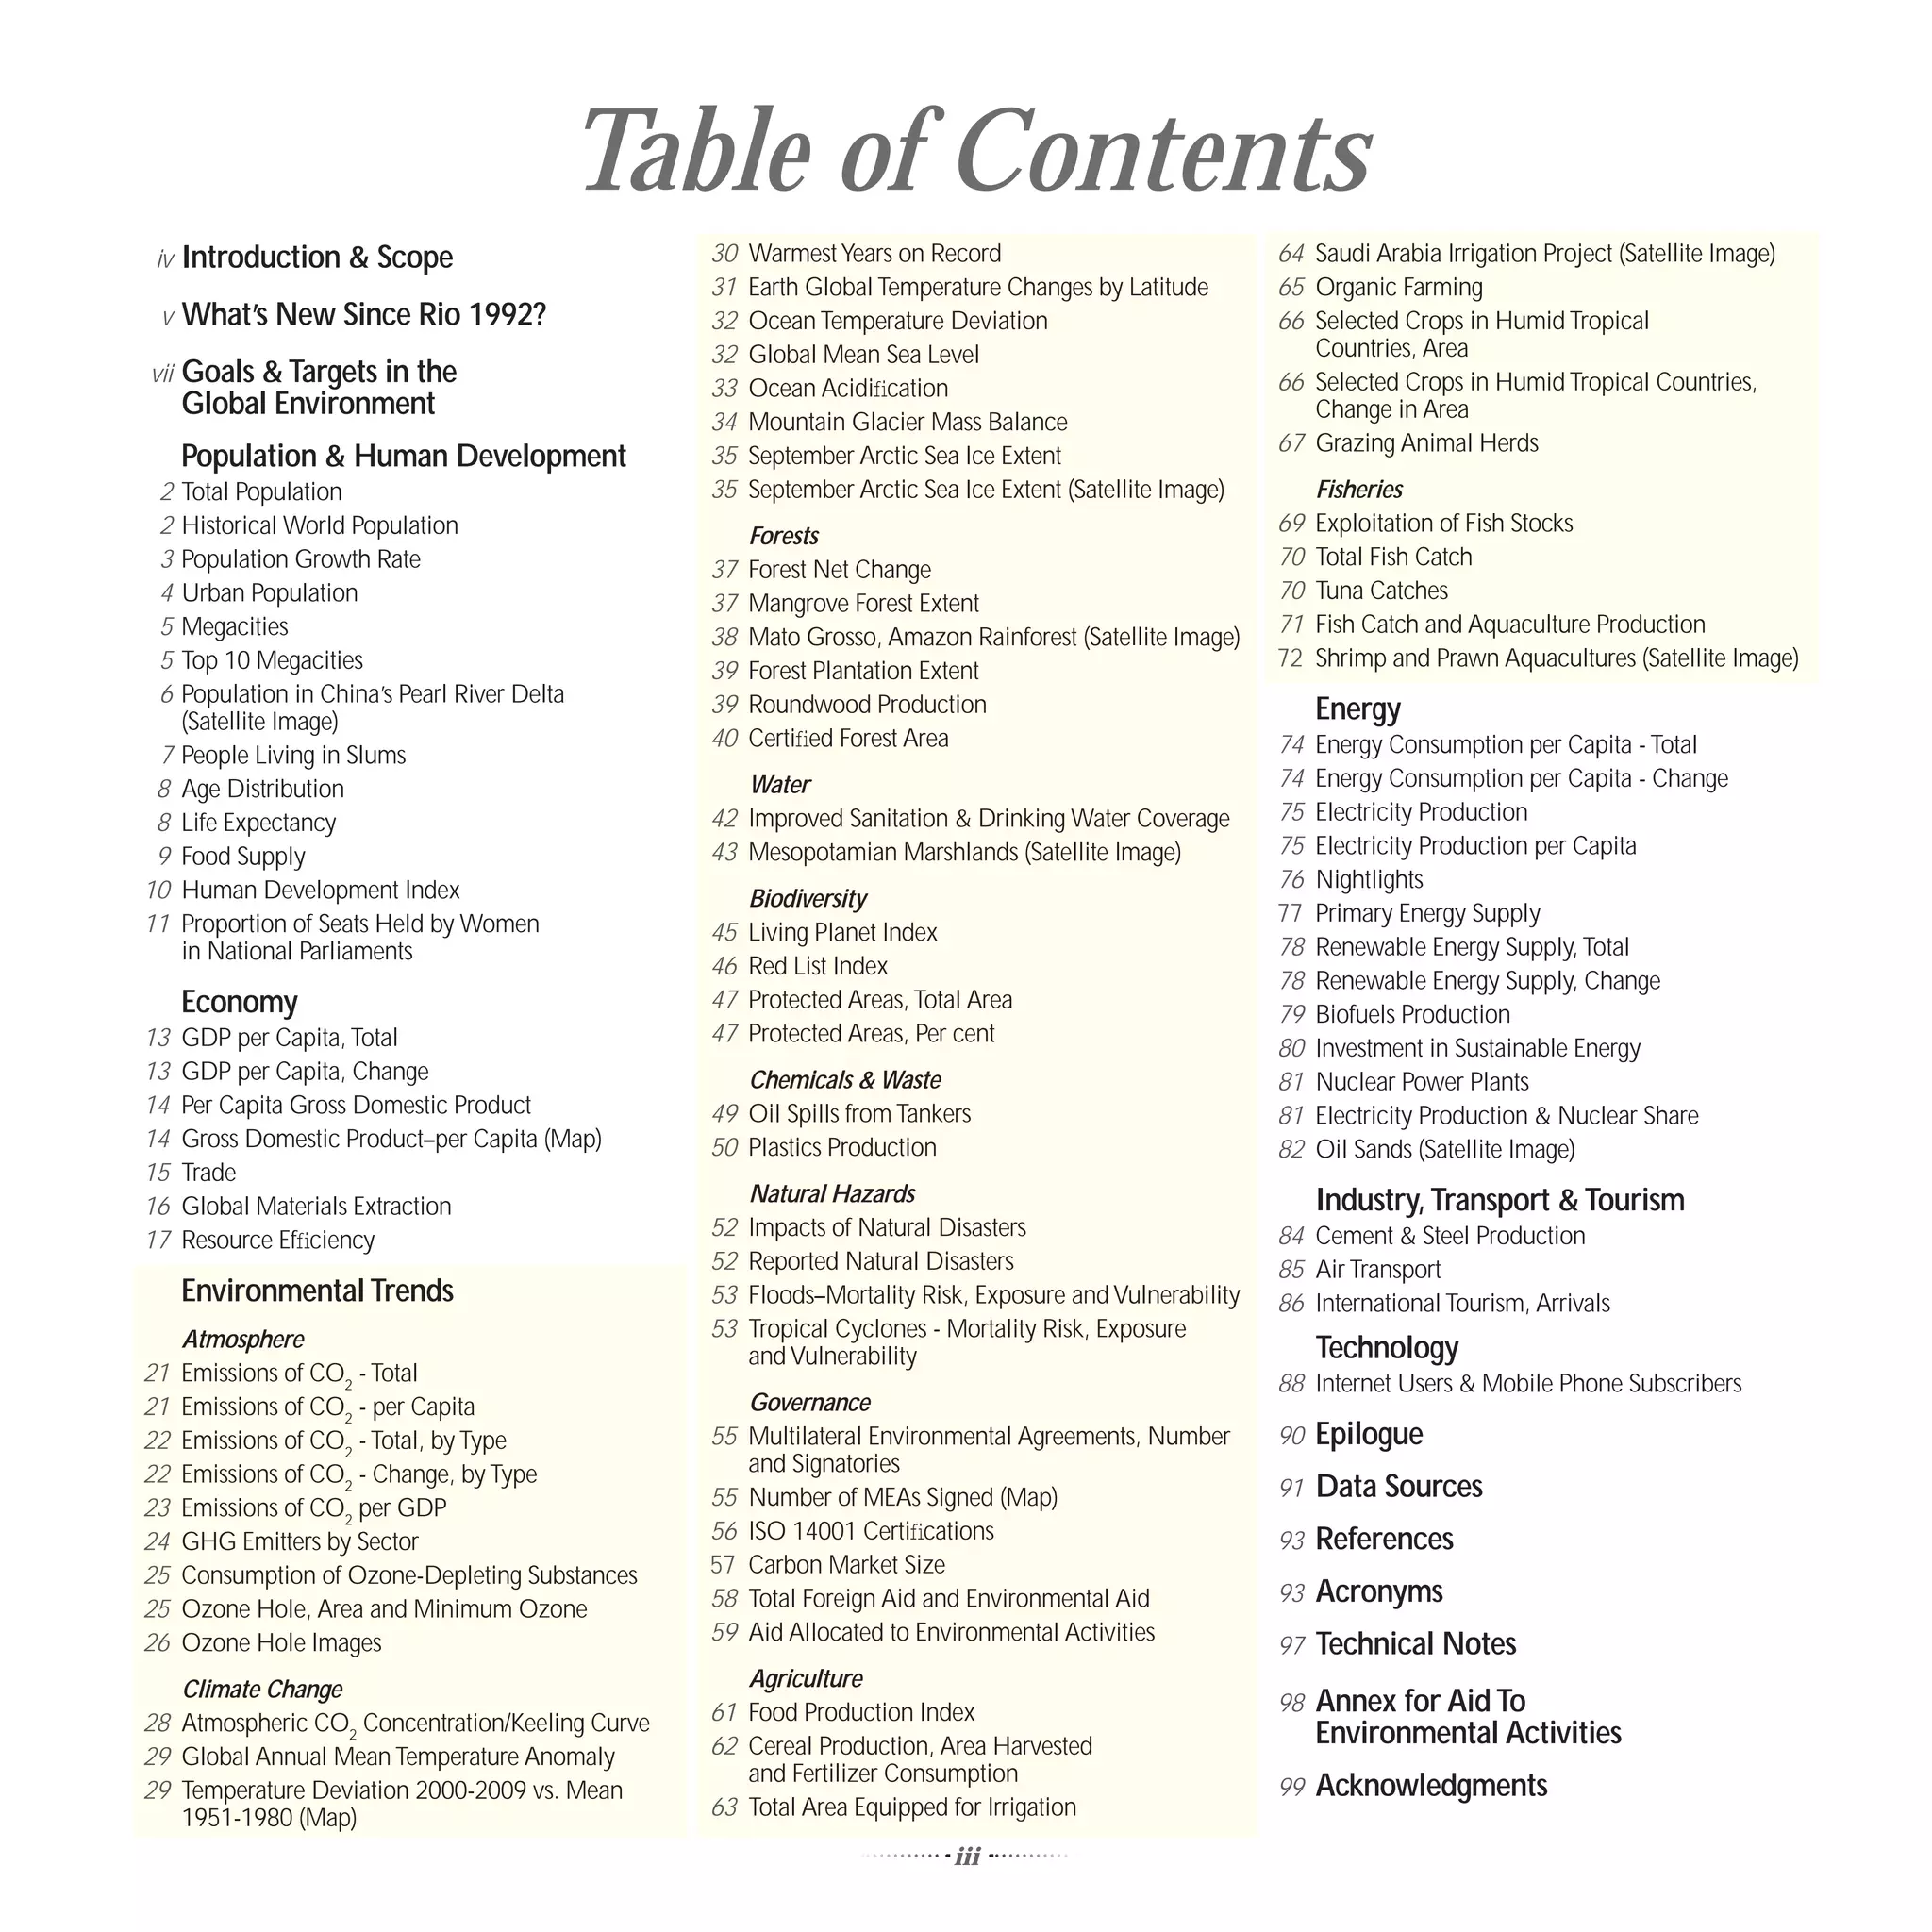
people—more than
half the world’s population—are living in urban areas
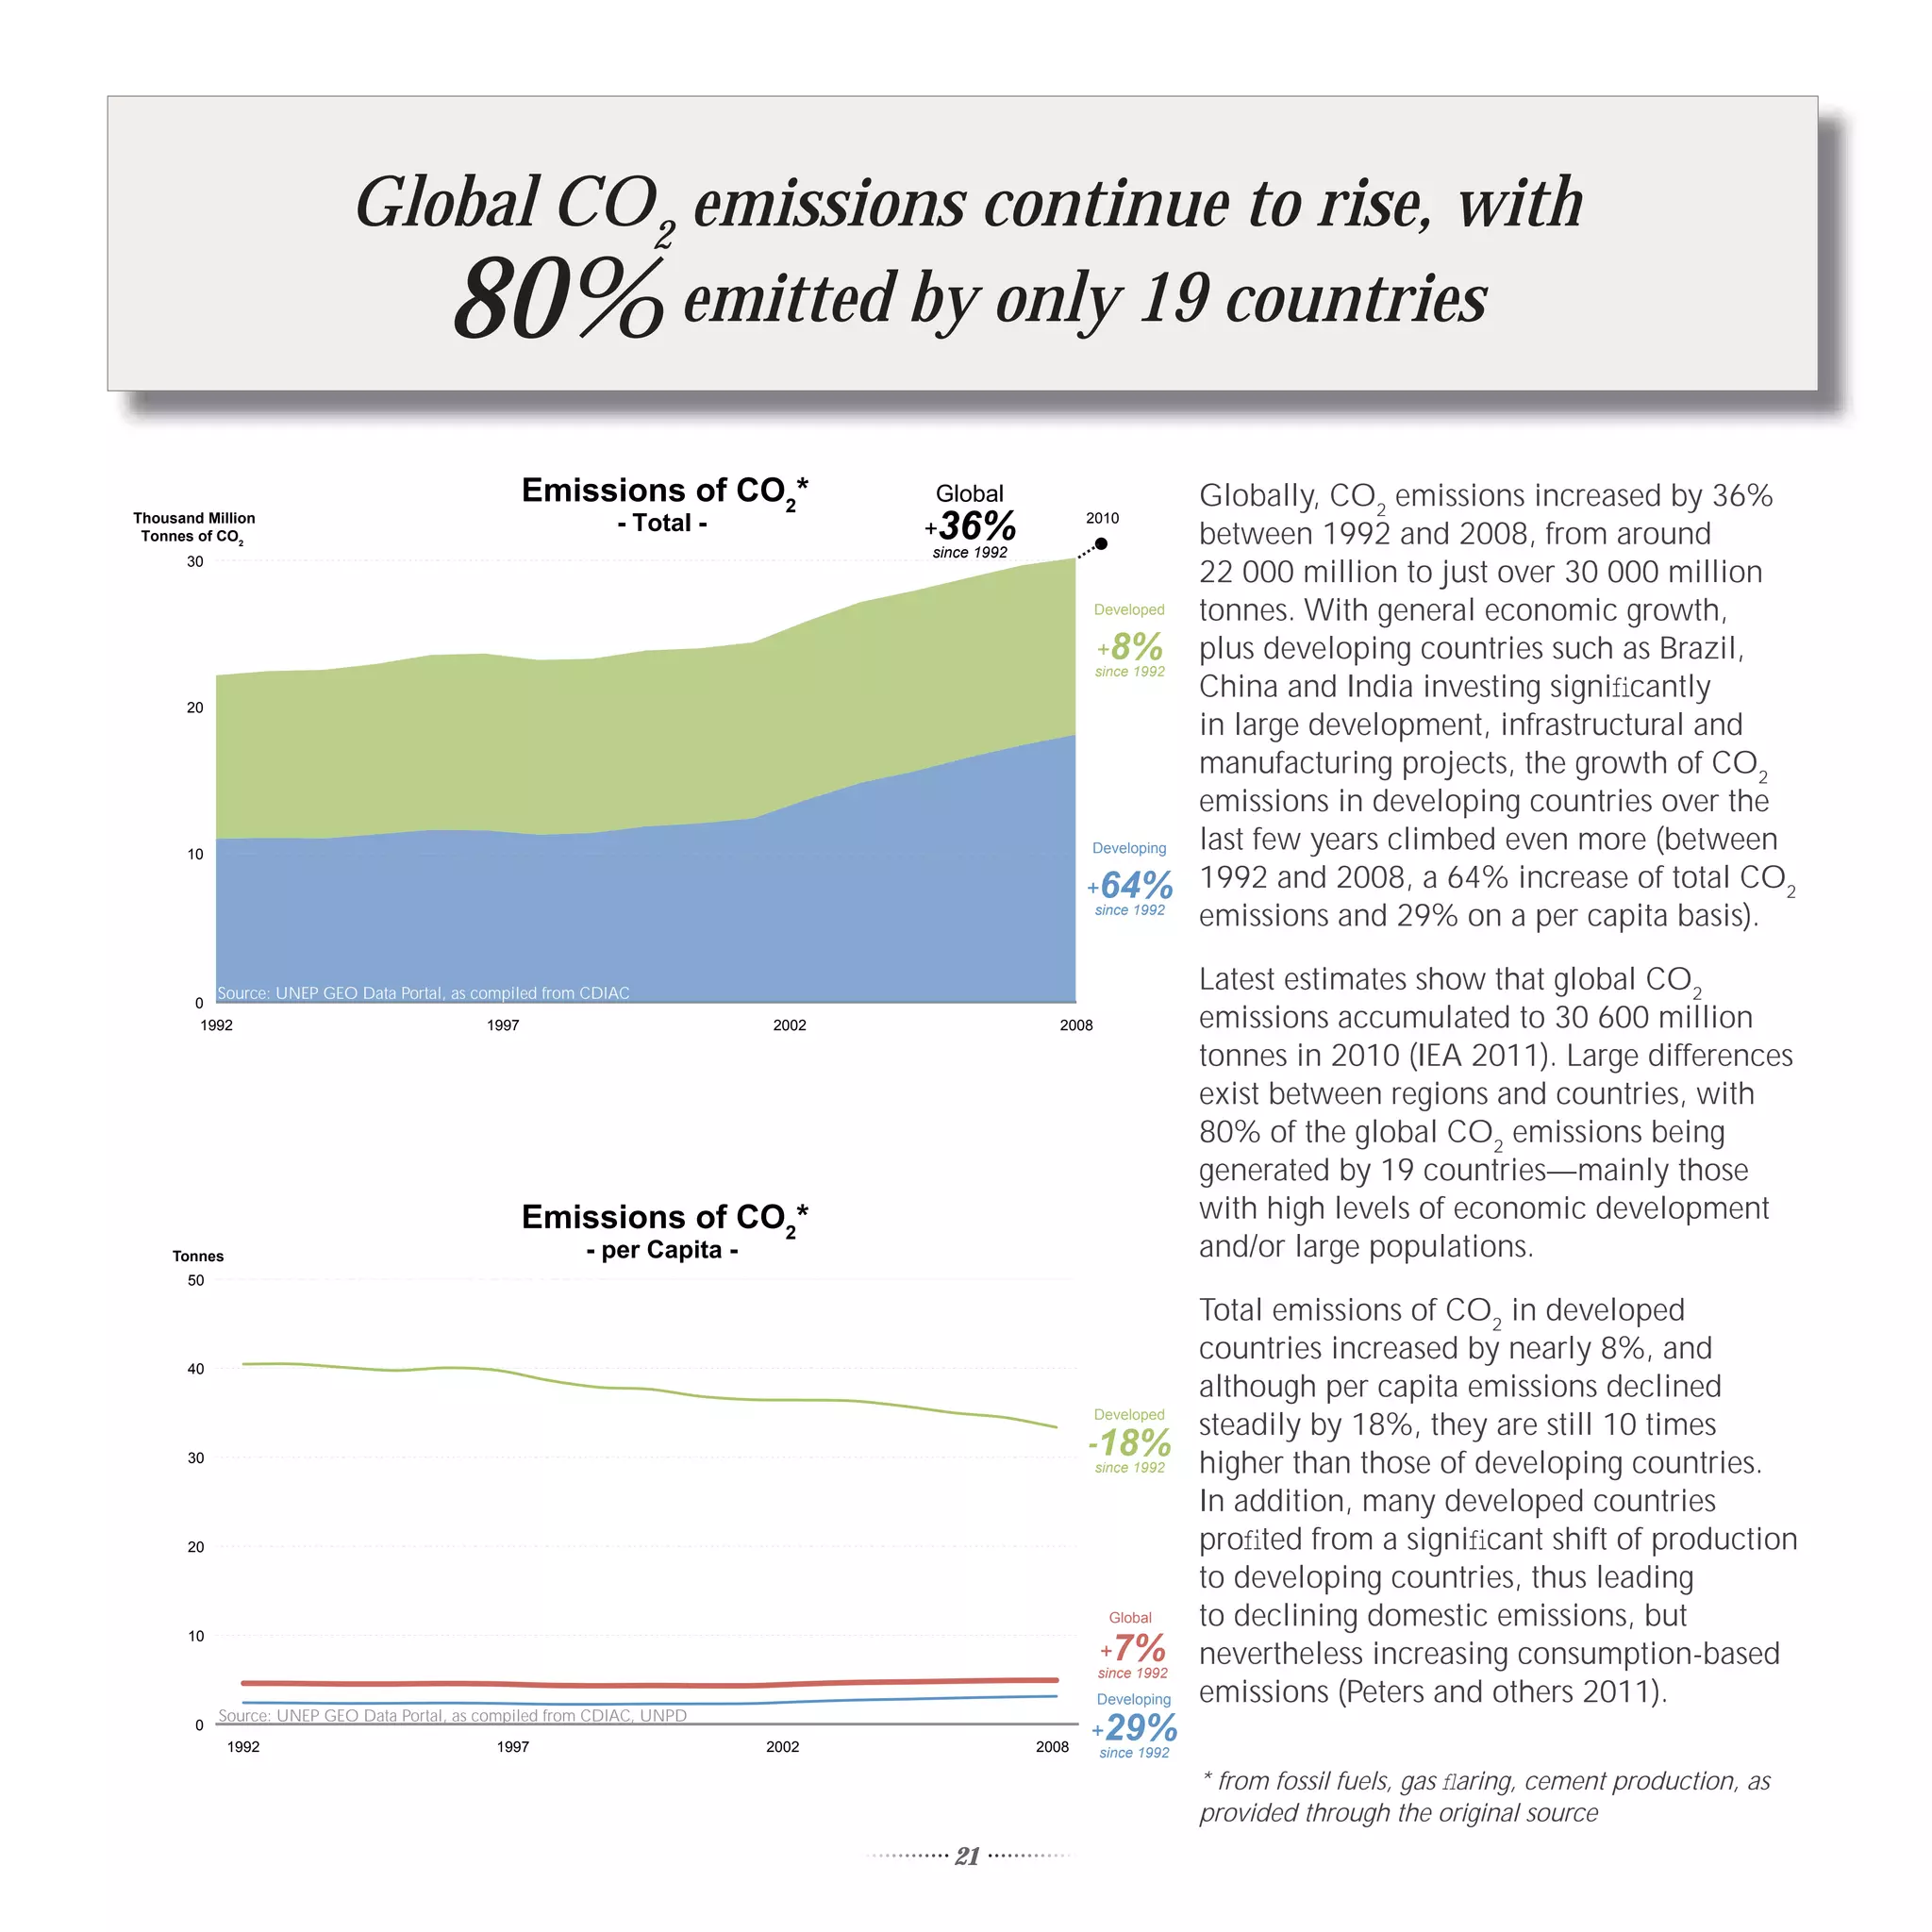
Thousand Million Urban Population - Total In 1992, 2 400 million of us lived in urban
People
4 agglomerations. By 2009, the number had climbed
Global
to 3 500 million, a 45% increase. The additional
3 1 000 million “urban people”—nearly 200 000 new
Developing
city dwellers per day—are the equivalent of 32 times
2 the population of Tokyo, or 110 times that of Paris
(Brinkhoff 2011).
1 Developed
This unprecedented urban growth, projected to
continue (although at a decreasing rate) in the coming
0 UNEP GEO Data Portal, as compiled from UNPD
1992 1997 2002 2007 2009 decades, will require special attention in order to
make life in cities more socially, economically and
Per Cent
Urban Population - Per Cent of Total Population environmentally sustainable.
80
Developed
While over half of the world population now lives
70 in urban areas, they also account for 75% of global
energy consumption (UN-Habitat 2009) and 80%
60
of global carbon emissions (The World Bank Group
Global 2010), at least when viewed from a consumption
50
Developing perspective (Satterthwaite 2011). On the other hand,
40 the top 25 cities in the world create more than half of
the world’s wealth (UN-Habitat 2008).
UNEP GEO Data Portal, as compiled from UNPD
30
1992 1997 2002 2007 2009
This ongoing rapid urbanisation indicates that
long-term investments addressing the associated
Urban Population - Growth Rate
Per Cent vulnerabilities are critically needed. “[The] urgency is
3
acute considering that 30-50% of the entire population
of cities in developing countries live in settlements
Developing
that have been developed in environmentally fragile
2 Global
areas, vulnerable to flooding or other adverse climate
conditions, and where the quality of housing is poor
1 Developed
and basic services are lacking” (UN 2009b).
UNEP GEO Data Portal, as compiled from UNPD
0
1992 1997 2002 2007 2009
4](https://image.slidesharecdn.com/keepingtrack-111104035934-phpapp01/75/Keeping-track-UNEP-From-Rio-to-Rio-20-1992-2012-14-2048.jpg)
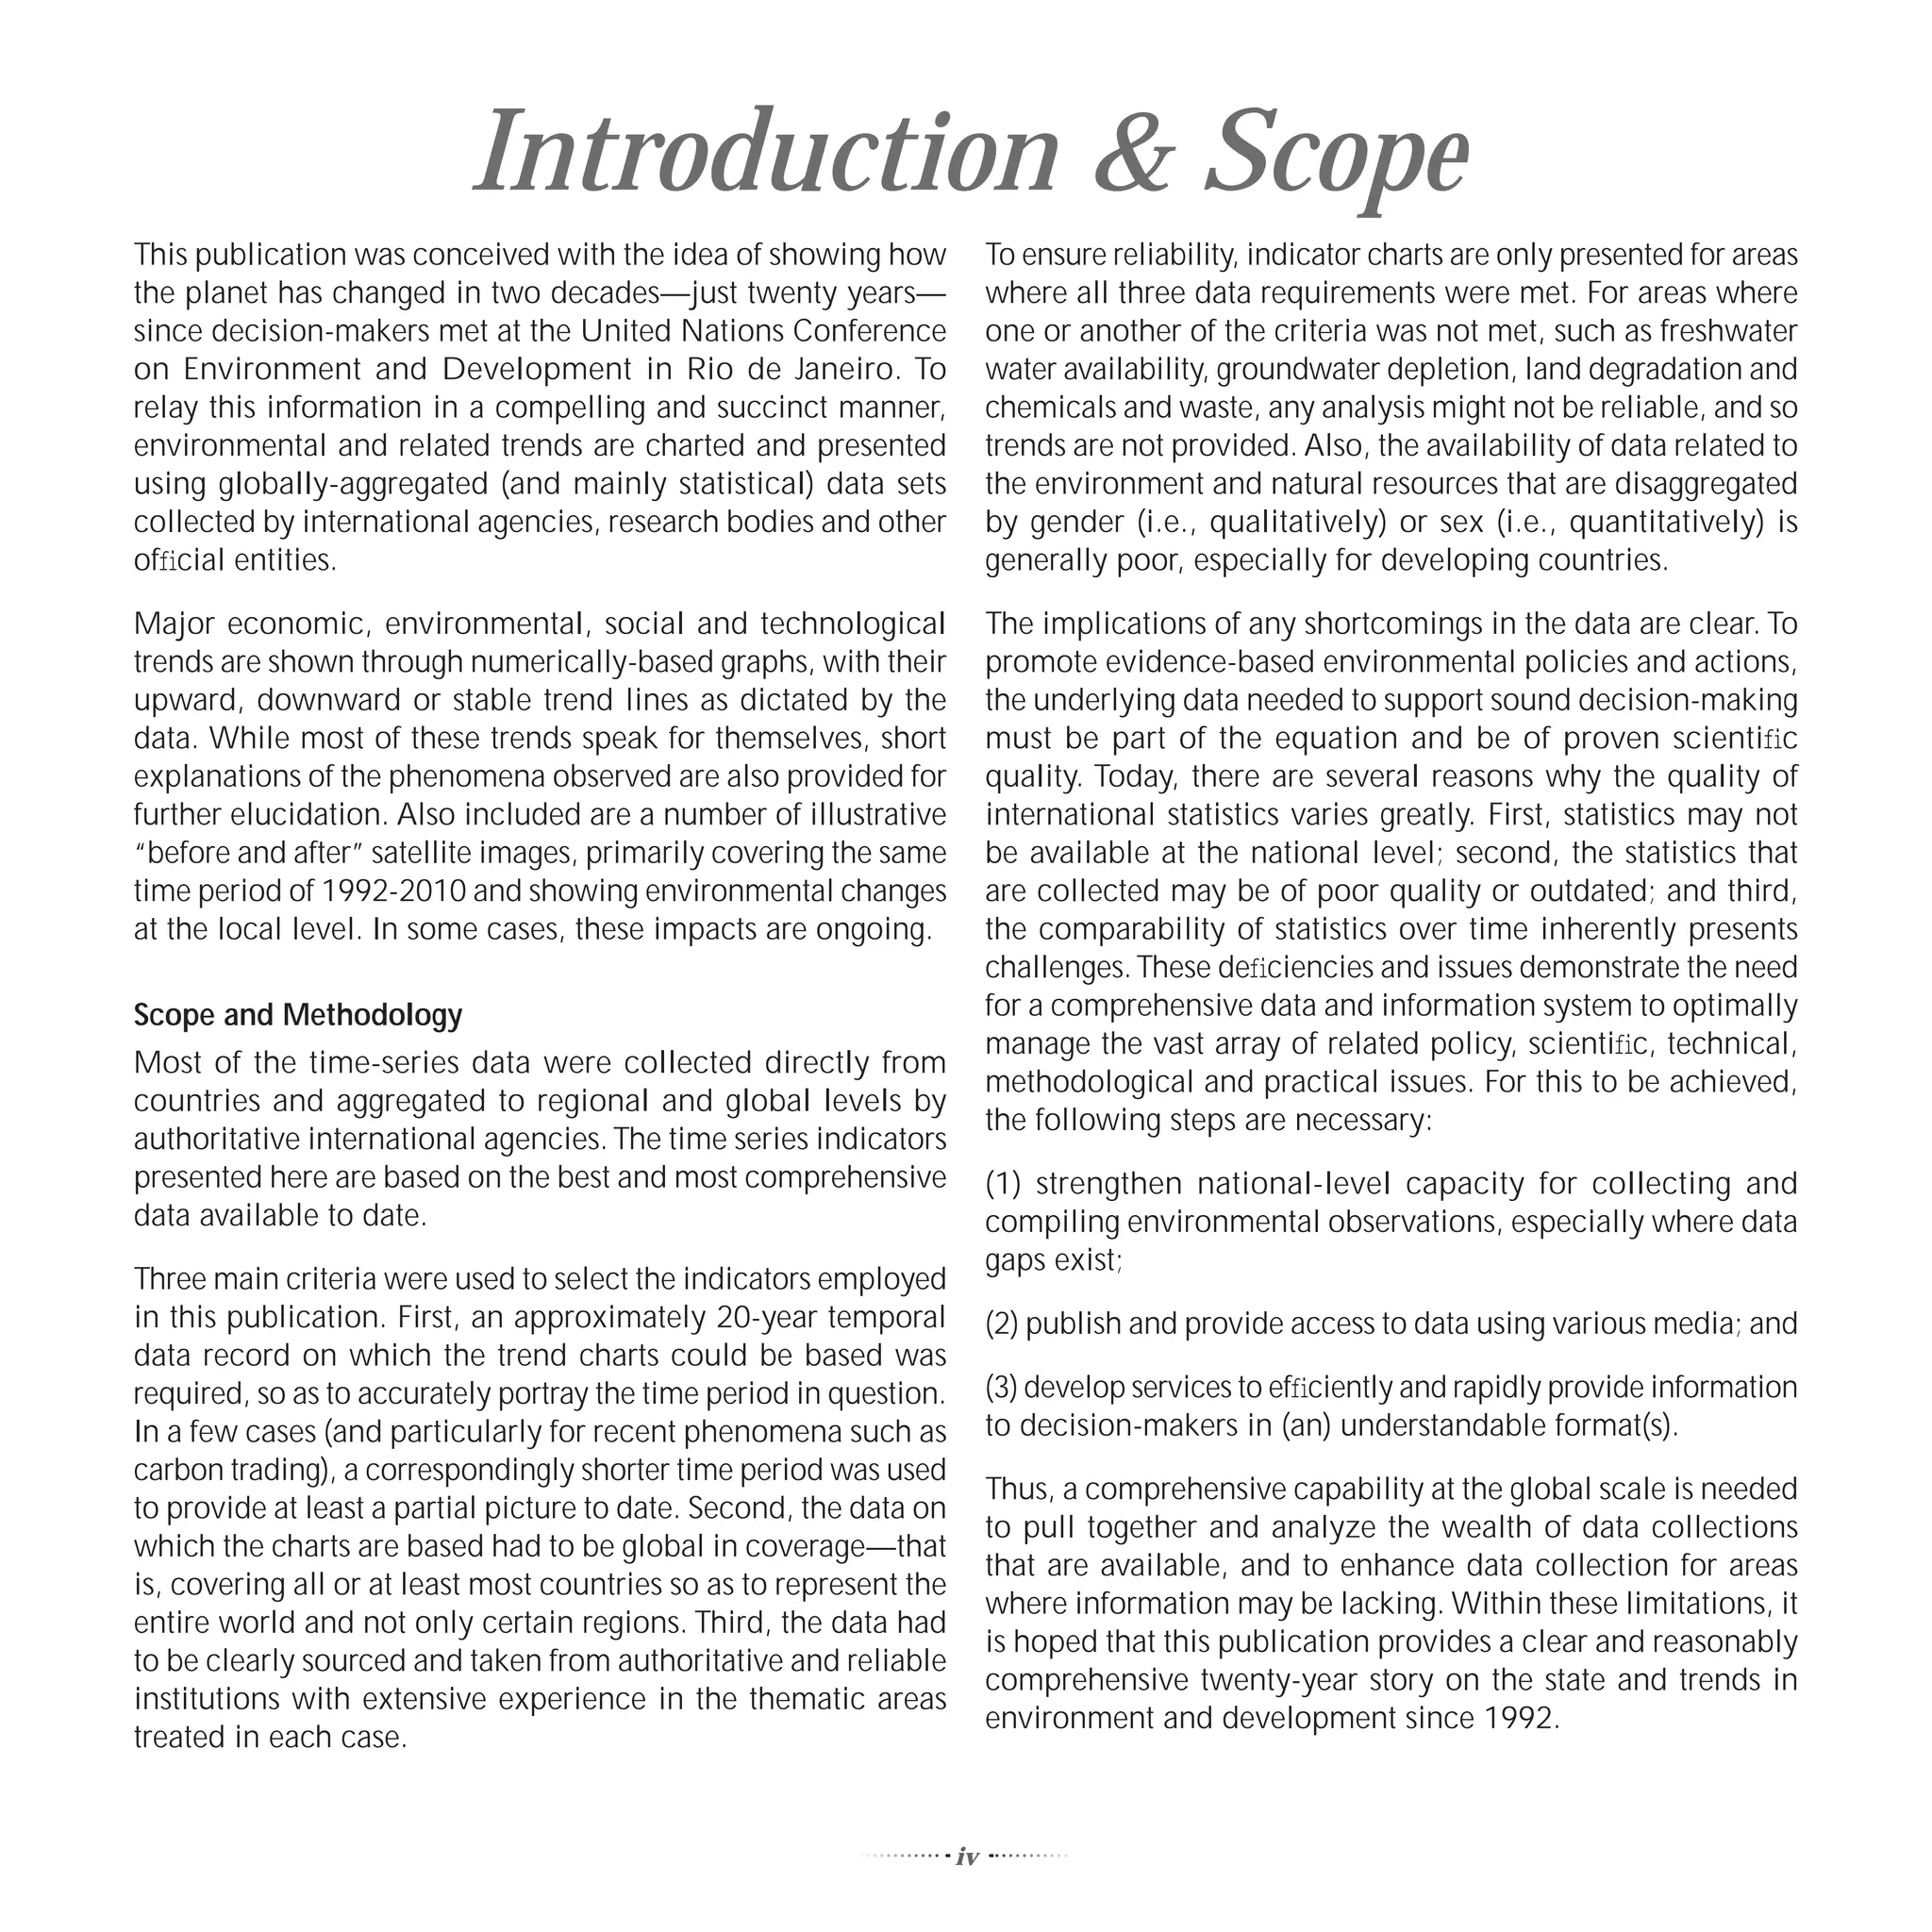
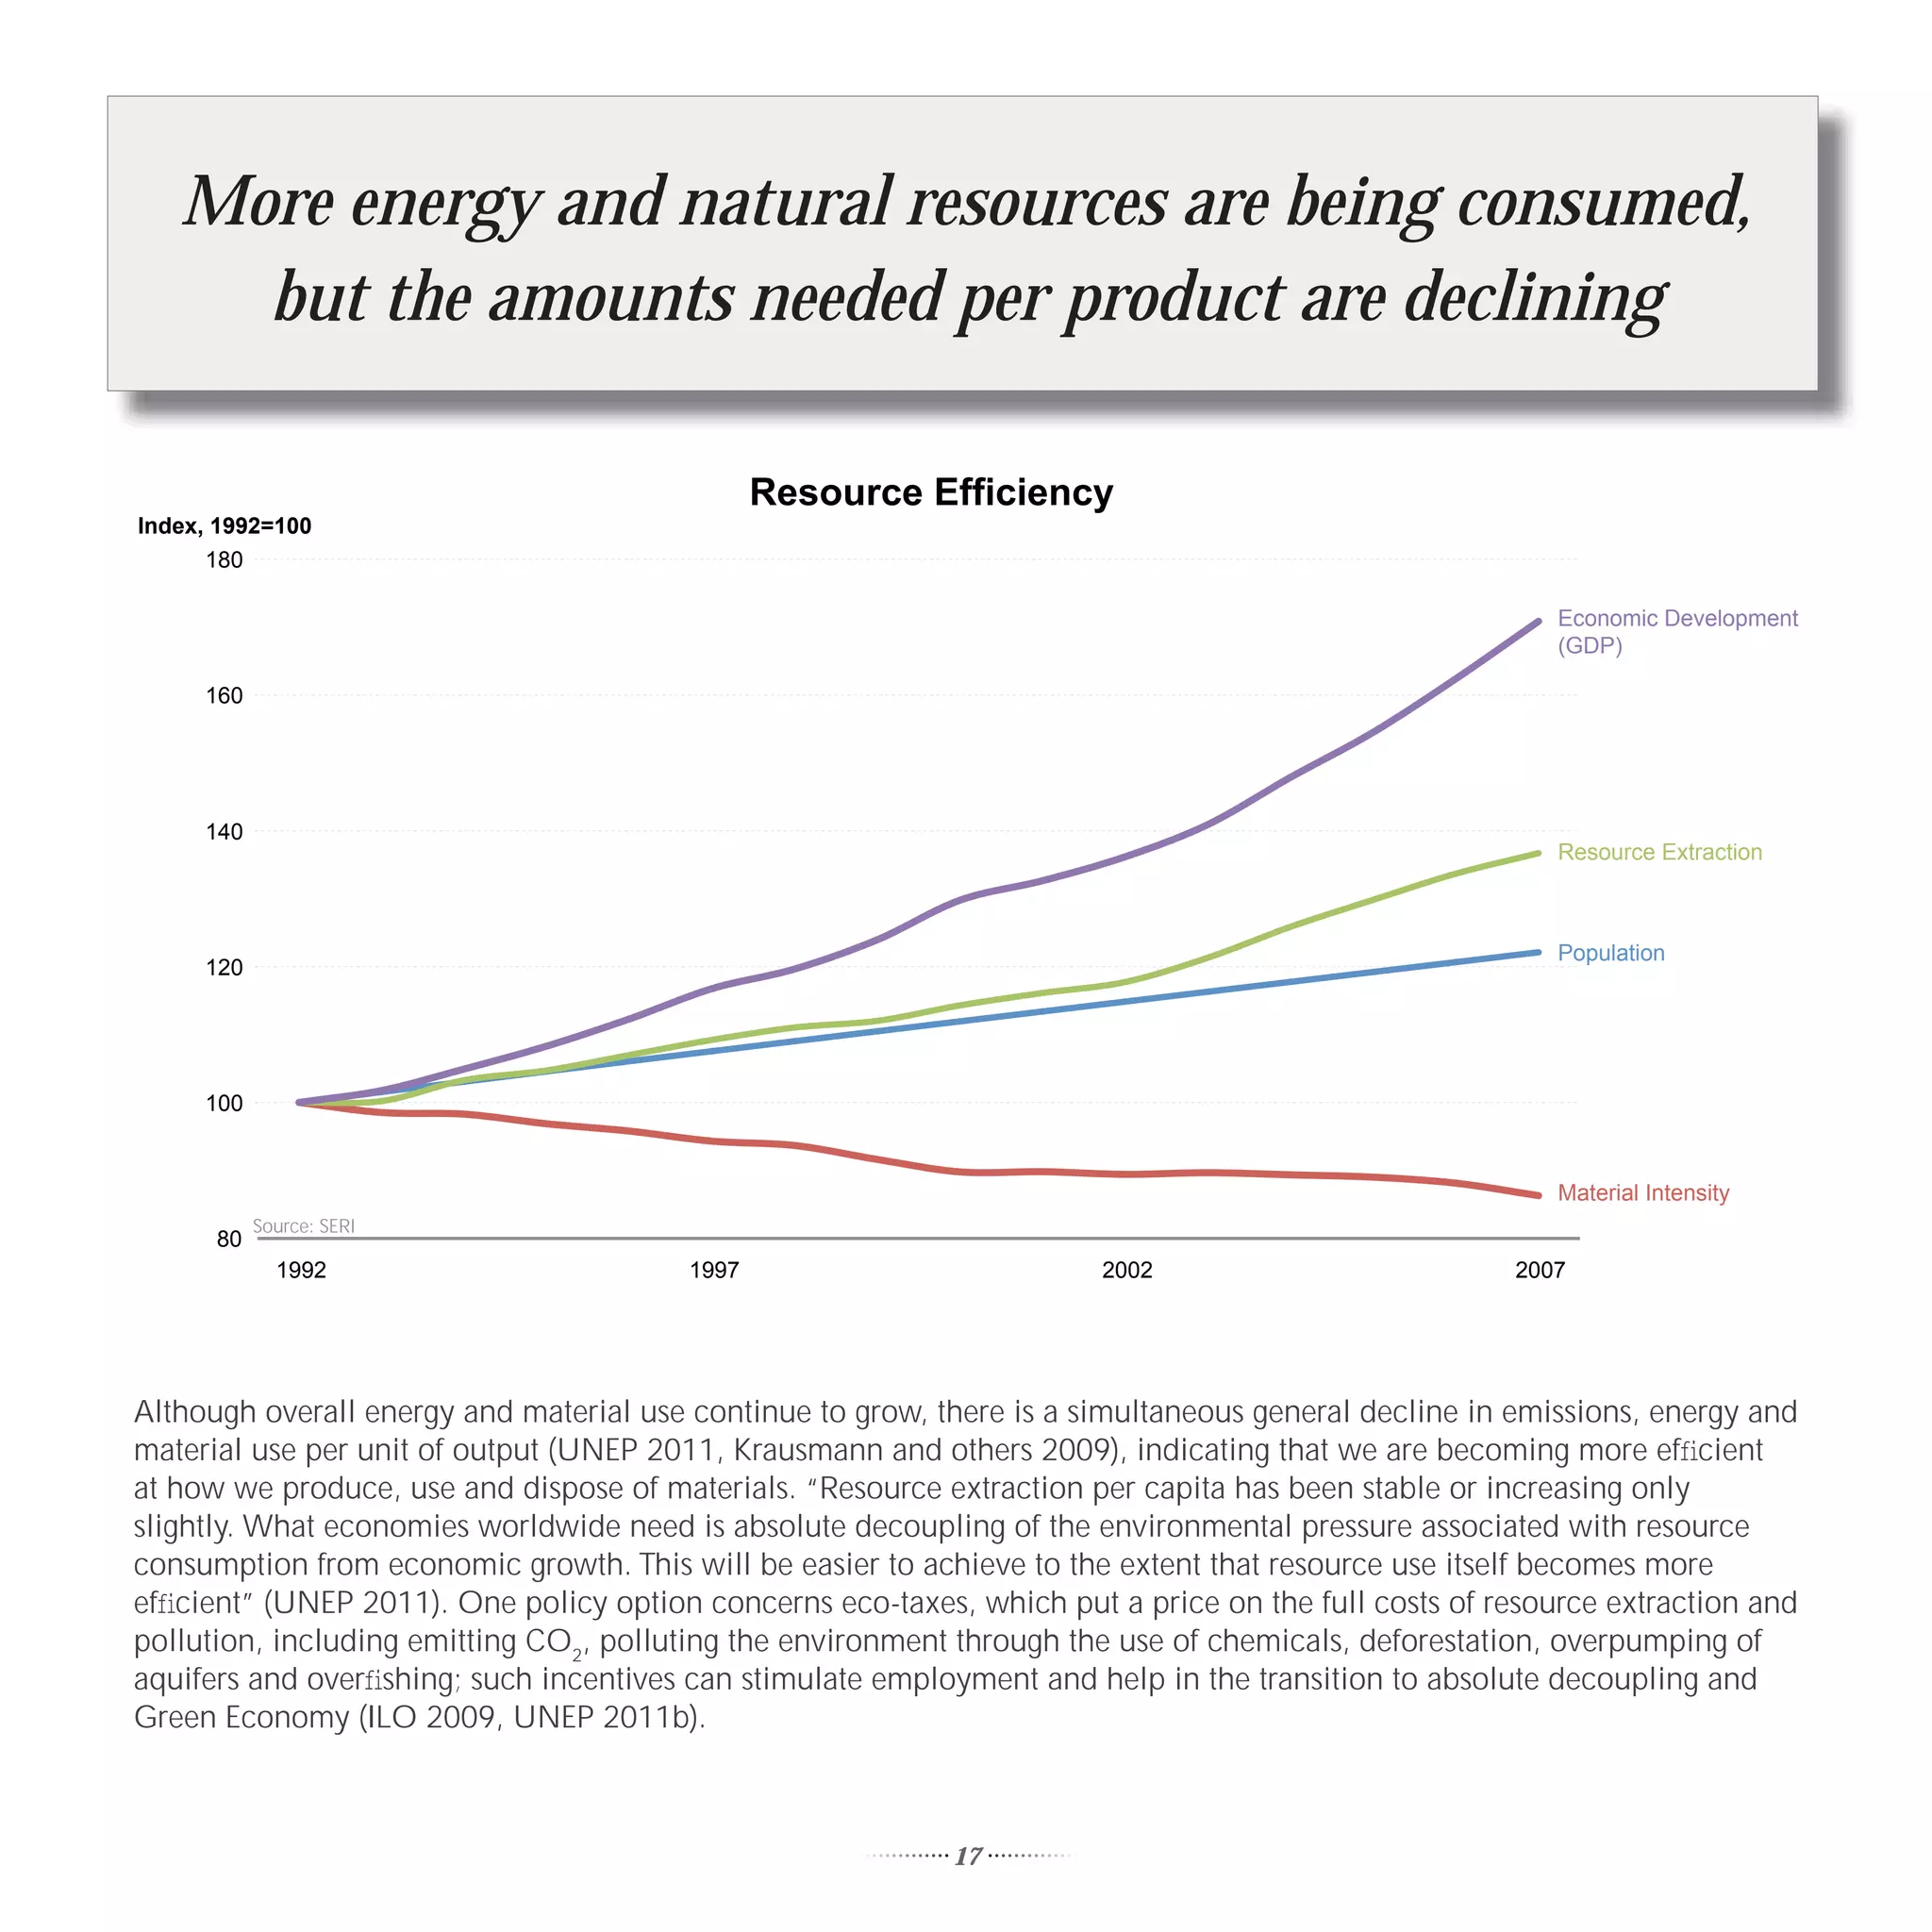
![A smaller proportion of urban dwellers live in slums, but
their total number has risen to 827 000 000
Population in Slums
People Living in Slums Proportion of Urban
[Million People] Population in Slums [%]
1 000 50
46% P
ercen
ta ge
827 Million
800 40
u m b er
Total N
illion
656 M 33%
600 30
Source: UN-Habitat
400 20
1990 1995 2000 2005 2010
Since 1990, the share of the urban population living in slums in the developing world has declined significantly, dropping
from 46% in 1990 to 33% in 2010. This decrease shows that many efforts to give inhabitants of slums access to improved
water or sanitation, and/or more durable housing have been successful. On the other hand, the absolute number of people
living in slums has increased by 26% over the same period, equaling 171 million additional people and raising their
number from 656 million in 1990 to 827 million in 2010. “Redoubled efforts will be needed to improve the lives of the
growing numbers of urban poor in cities and metropolises across the developing world” (UN 2011b).
Note:
A slum household is defined as a group of individuals living under the same roof lacking one or more of these conditions: access to improved water;
access to improved sanitation; sufficient-living area; durability of housing; security of tenure. However, since information on secure tenure is not
available for most of the countries, only the first four indicators are used to define slum household, and then to estimate the proportion of urban
population living in slums (UNSD n.d.).
7](https://image.slidesharecdn.com/keepingtrack-111104035934-phpapp01/75/Keeping-track-UNEP-From-Rio-to-Rio-20-1992-2012-17-2048.jpg)


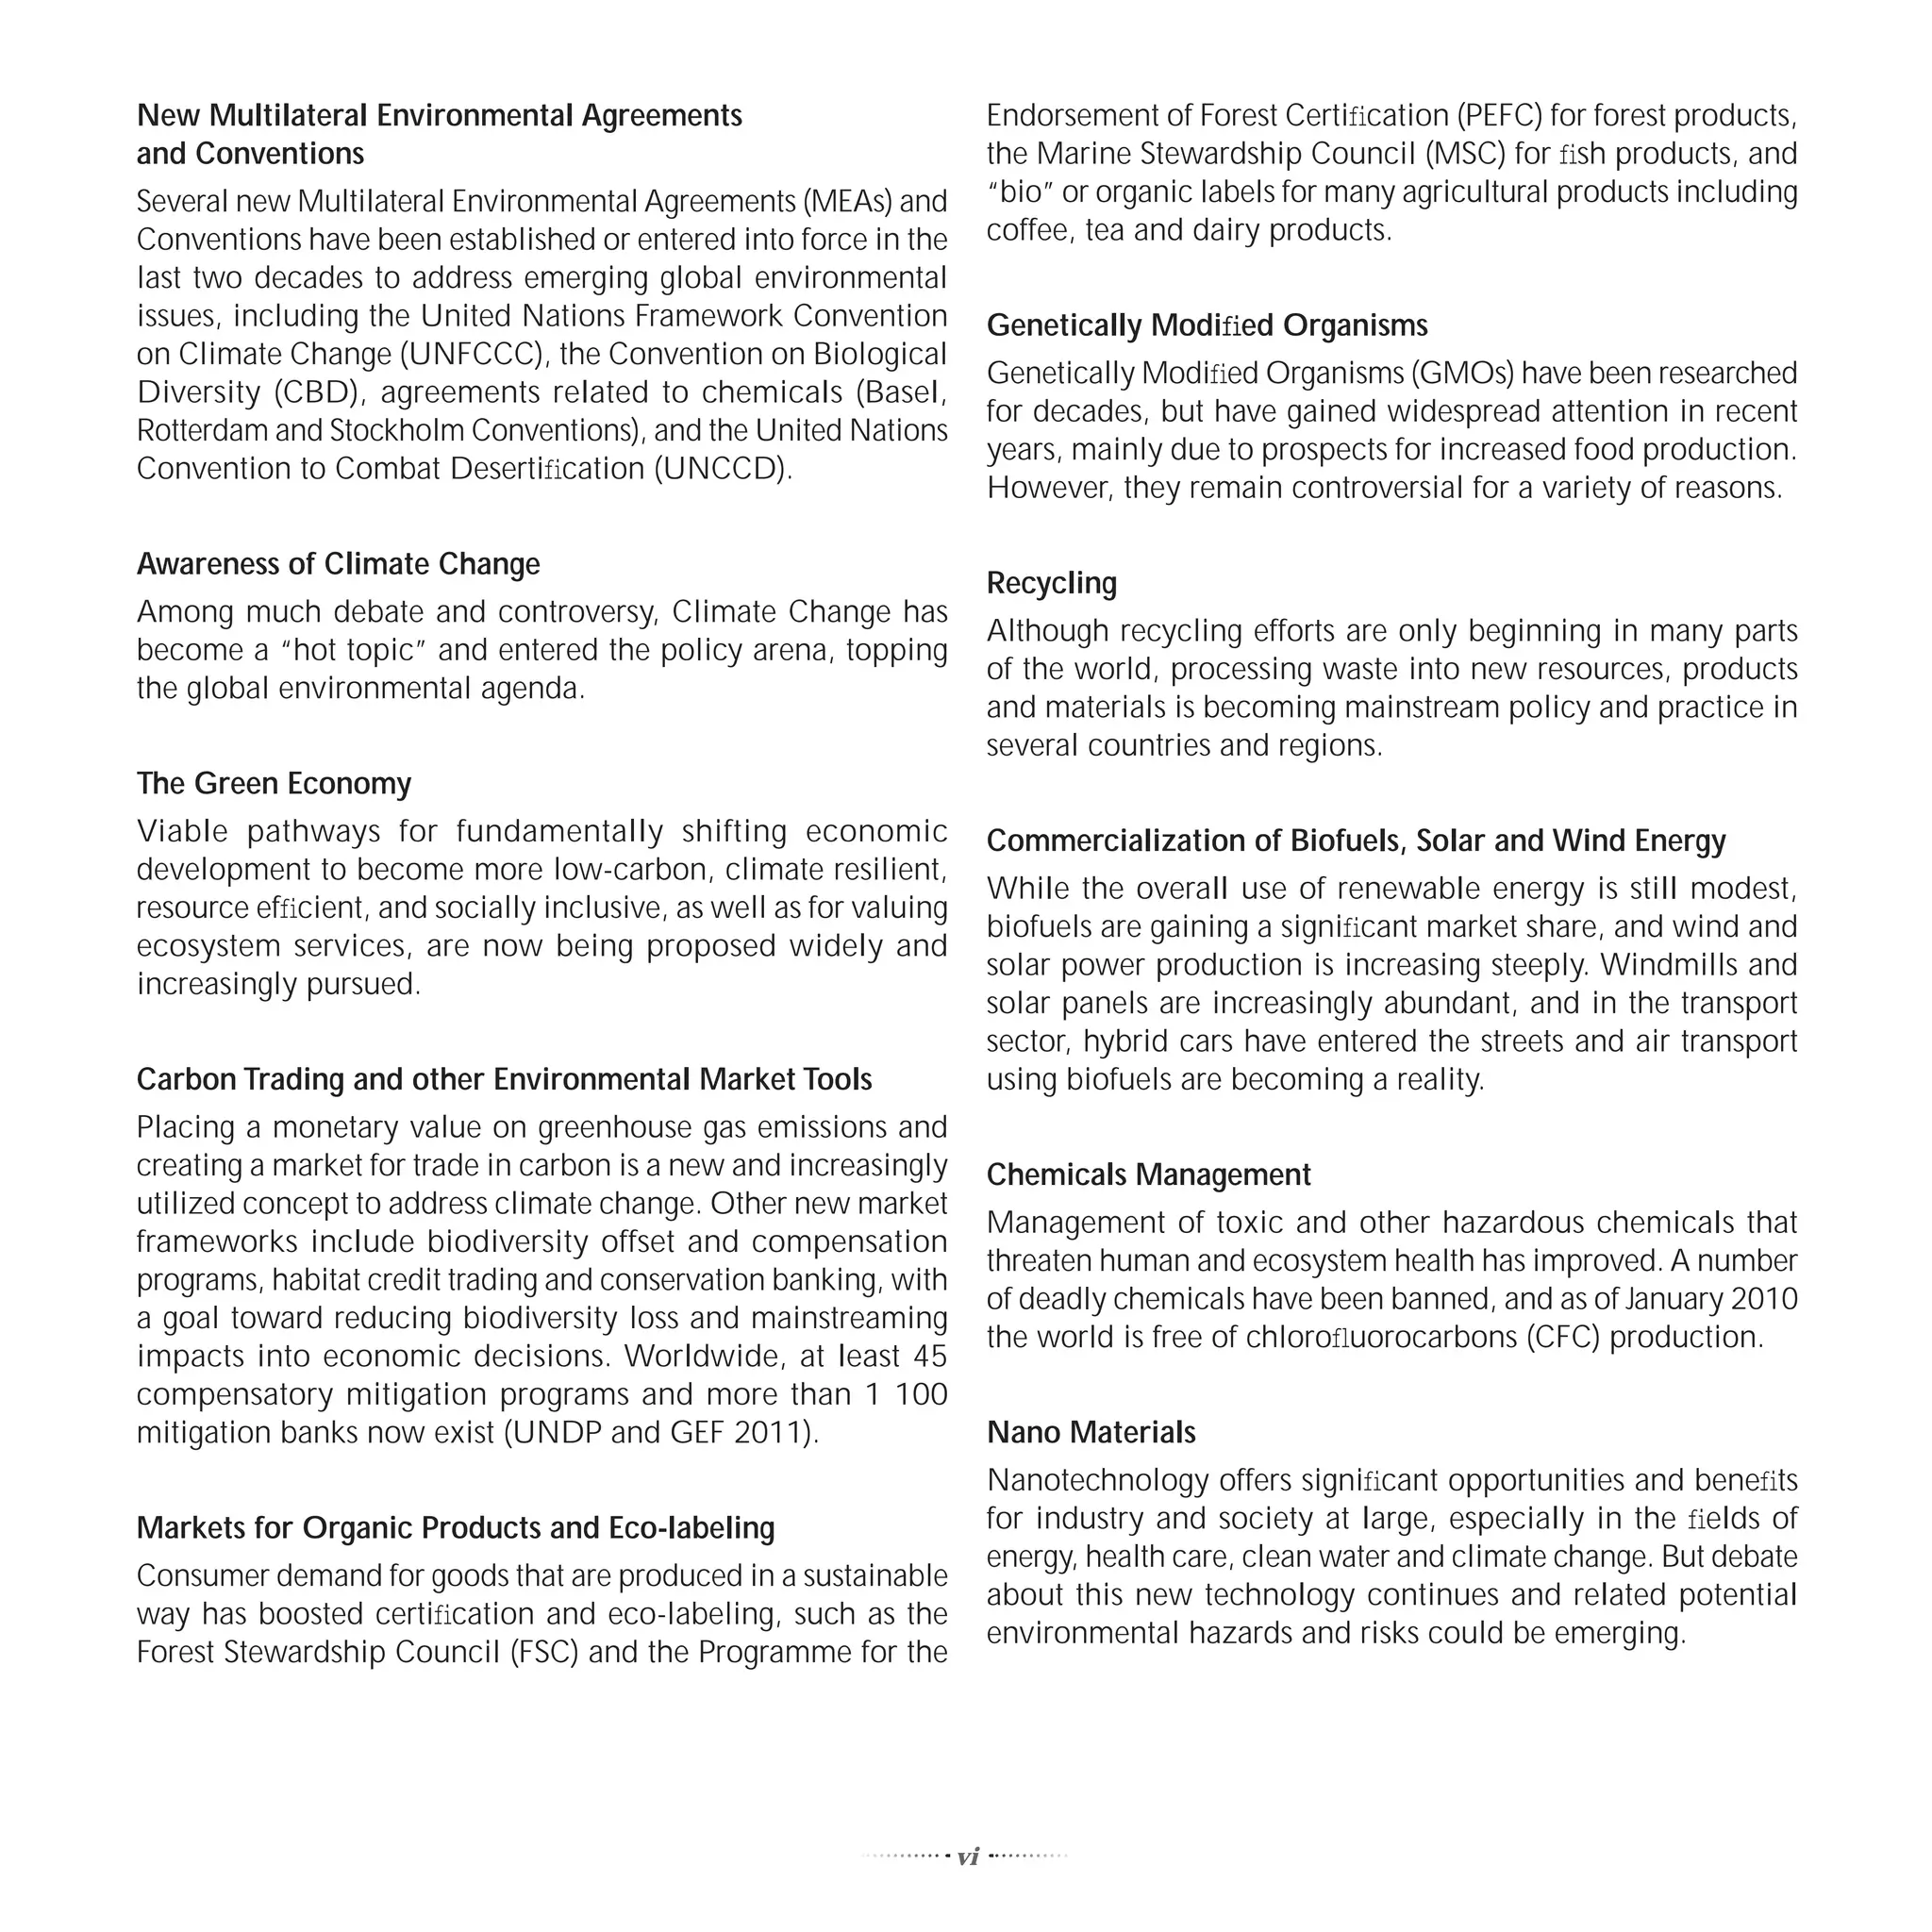
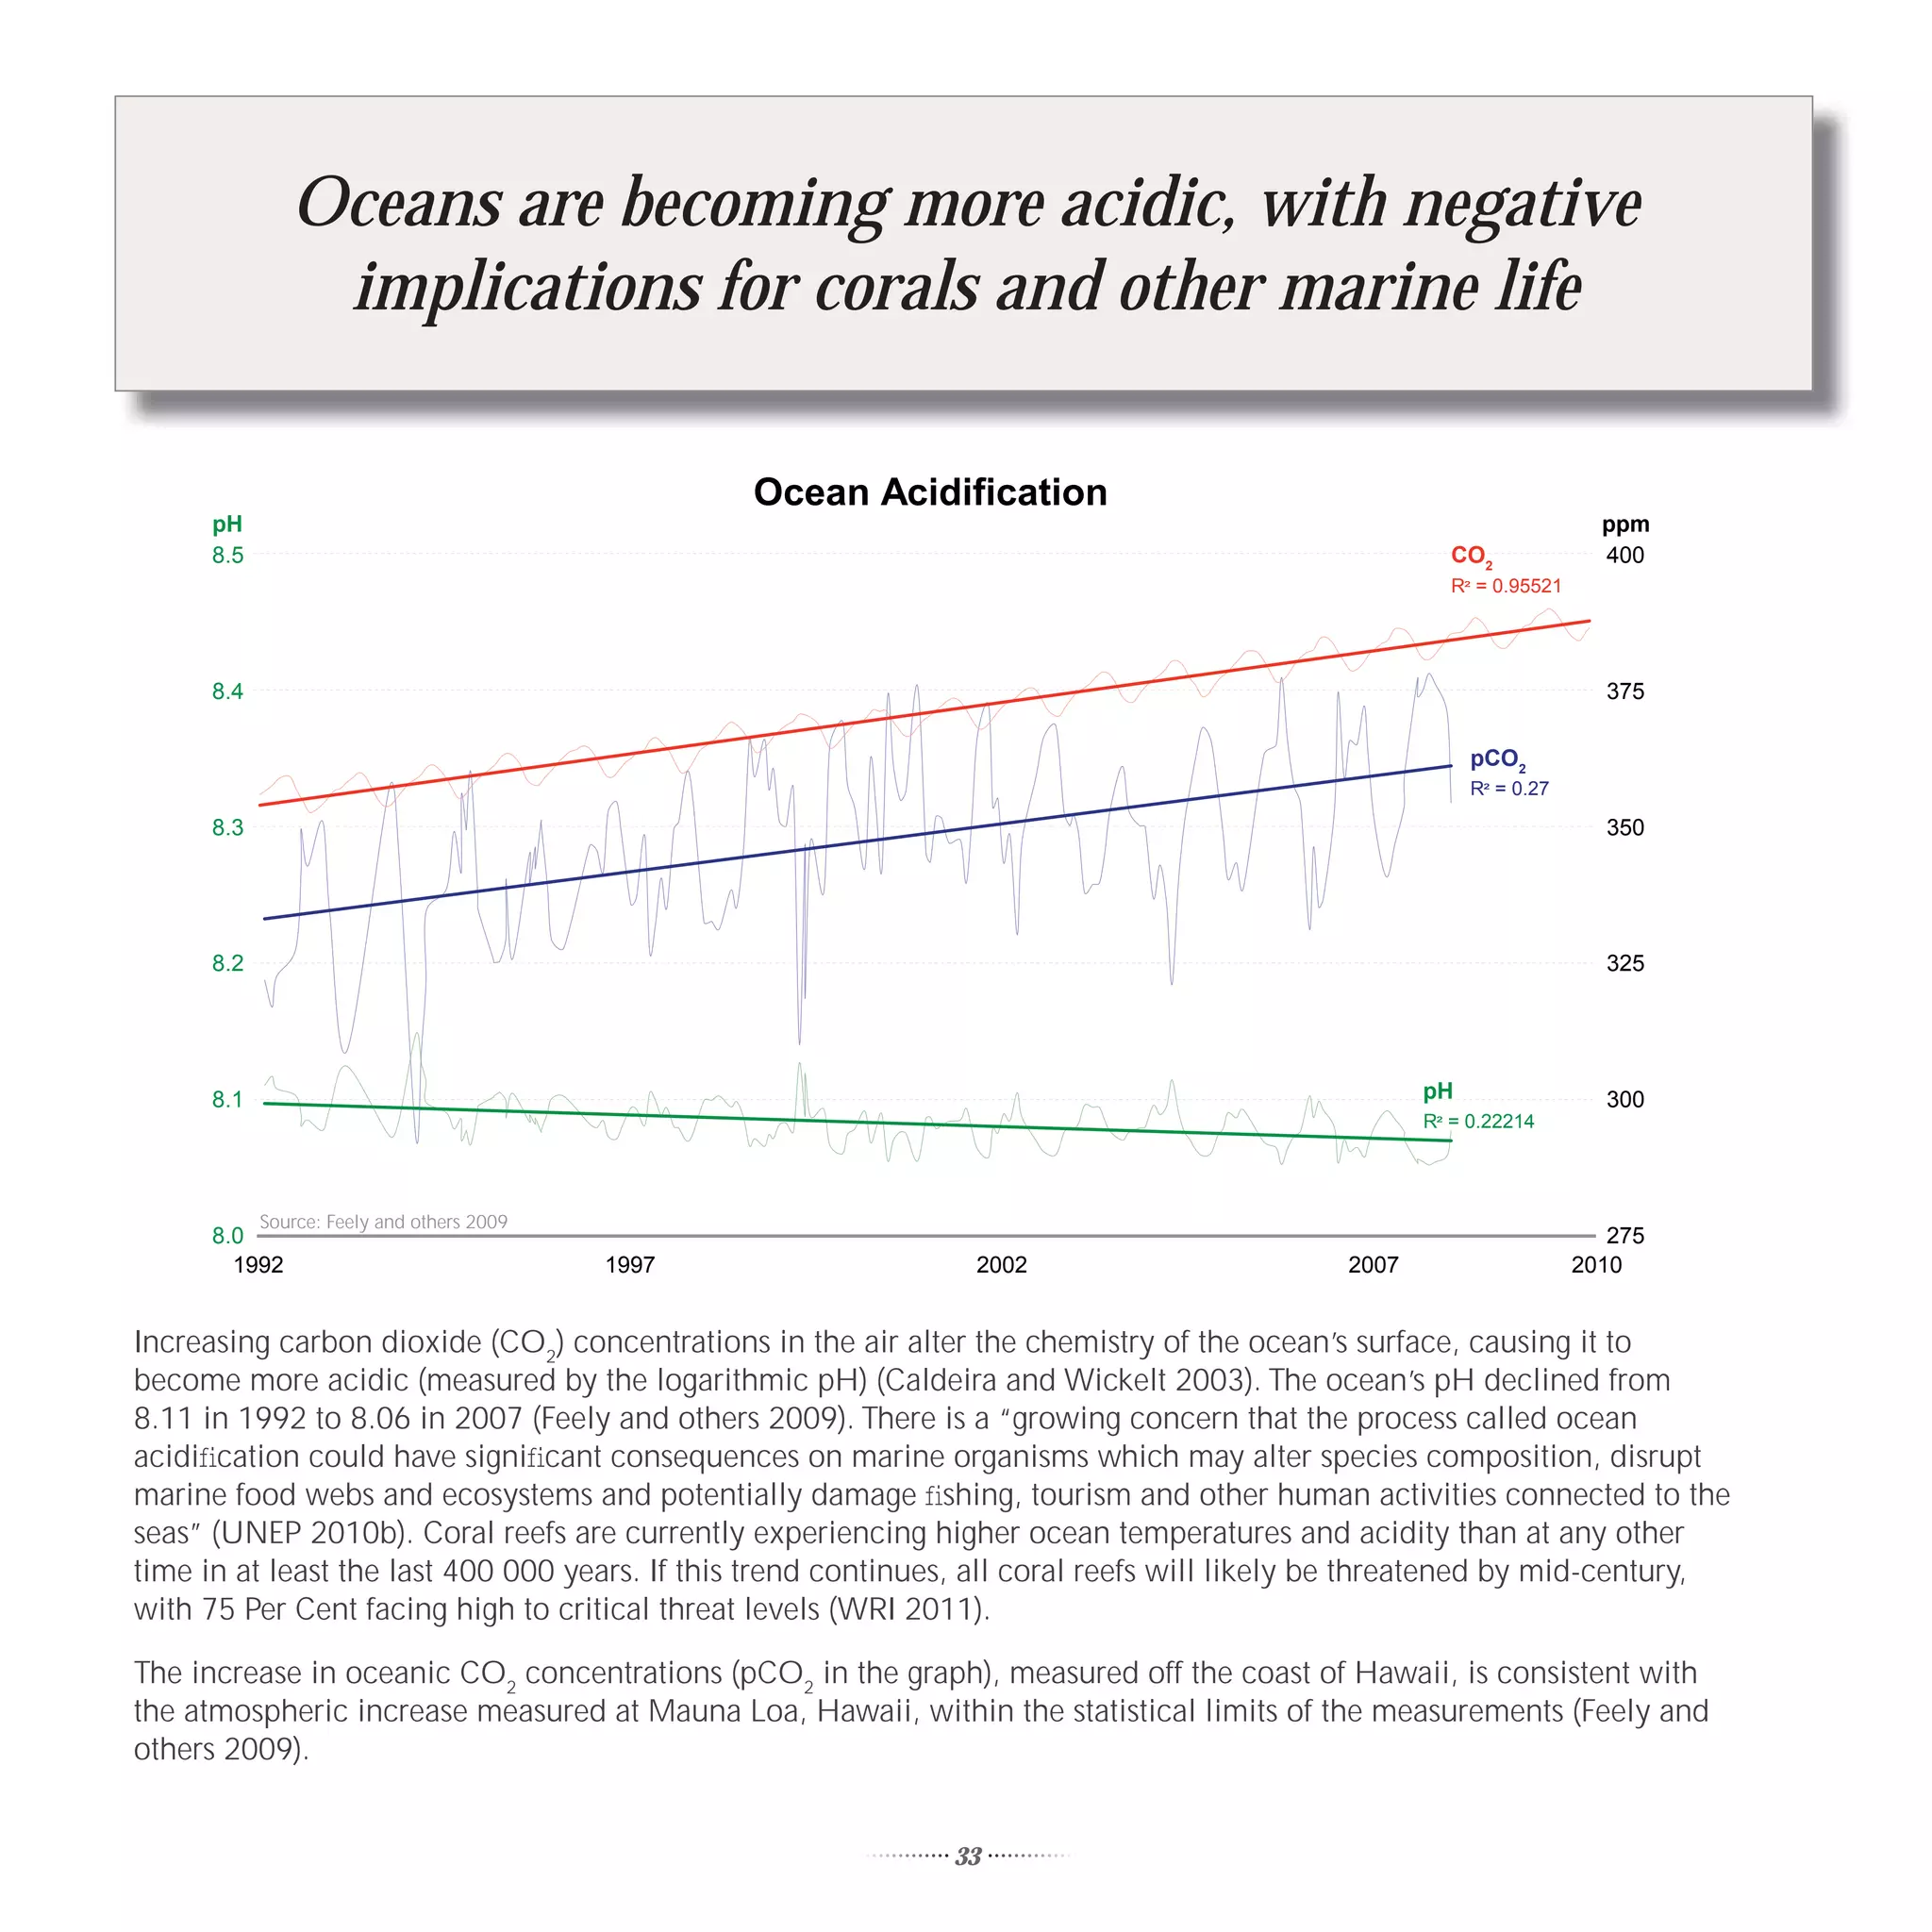
![Further expansion of the “ozone hole” has halted,
but full recovery is still far away
September 1992 September 1994 September 1996 September 1998 September 2000
September 2002 September 2004 September 2006 September 2008 September 2011
110 220 330 440 550
Source: NASA
total ozone (Dobson Units)
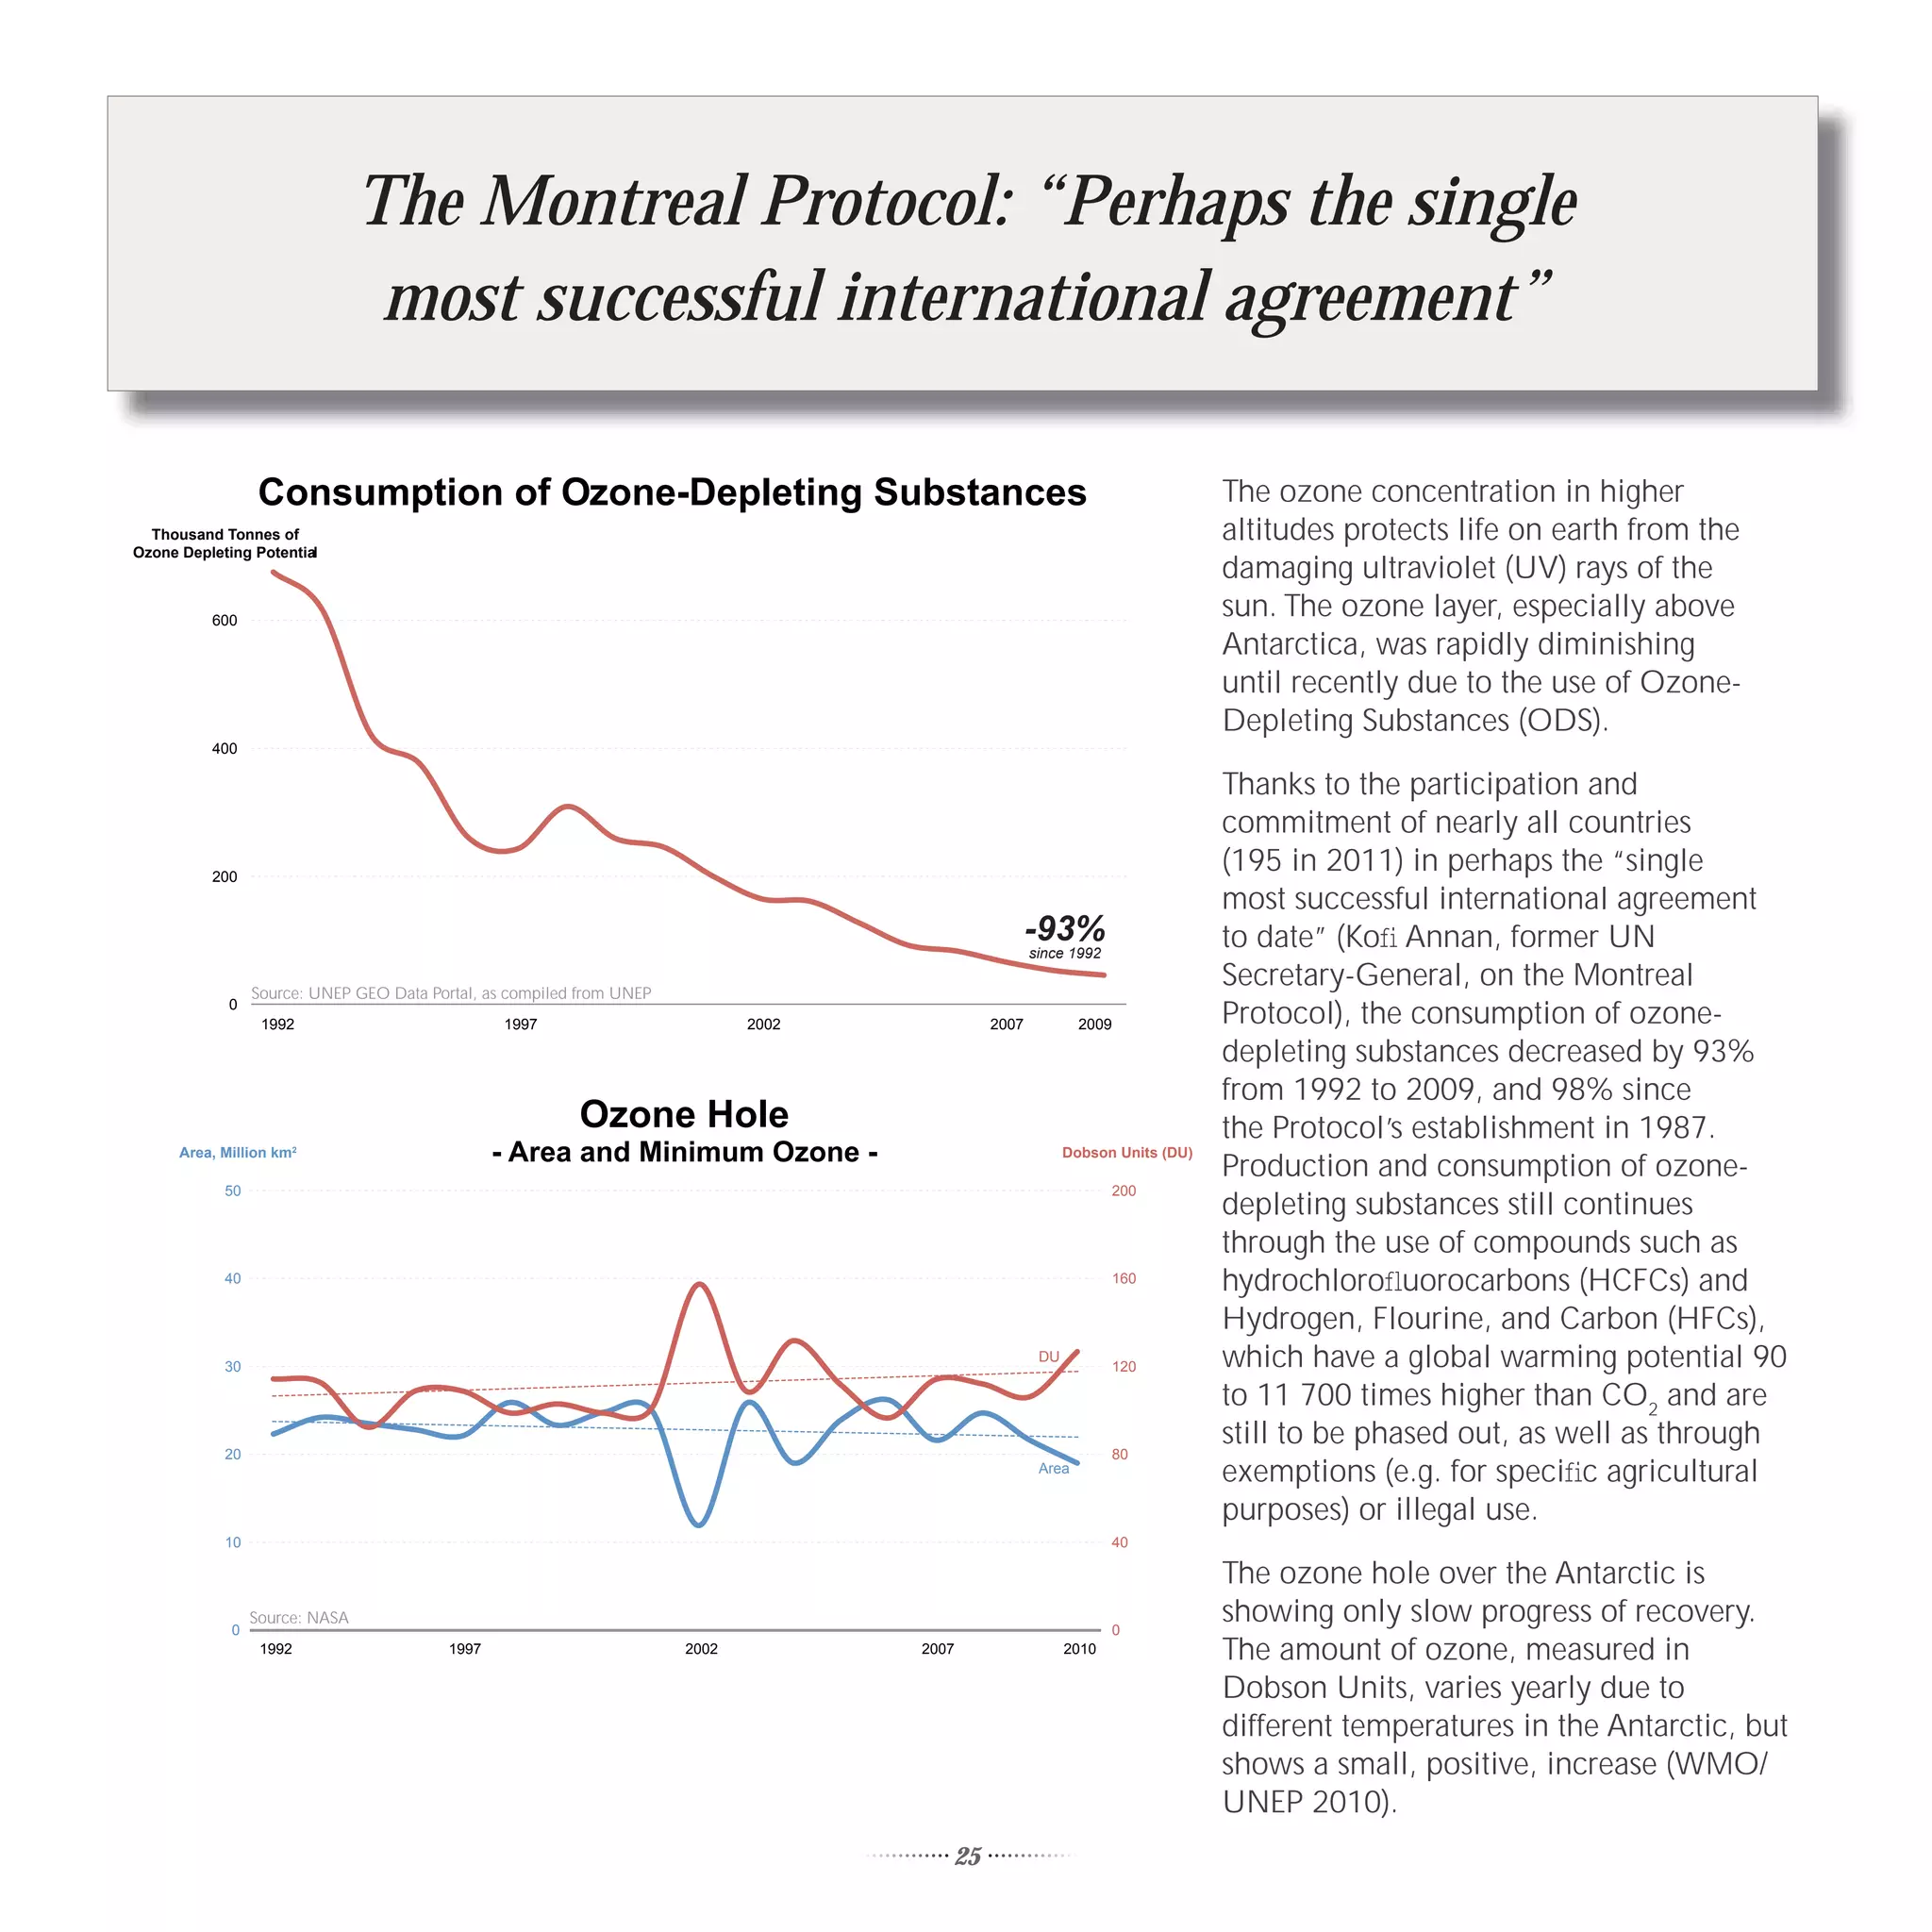
The use of ODS has been controlled from 1987 onwards (and subsequently banned) under the Montreal Protocol. As of
1 January 2010, no new production of chlorofluorocarbons (CFCs) is permitted. Given that many of these substances are
also potent greenhouse gases, the Protocol provided at the same time “substantial co-benefits by reducing climate change”
(WMO/UNEP 2010): “From 1990 to 2010, the Montreal Protocol’s controls on production and consumption of ODSs
[will] have reduced GHG emissions by the equivalent of a net 135 thousand million tonnes CO2, which is equivalent to 11
thousand million tonnes CO2 per year” (Molina and others 2009).
Over the past decade concentration and extent of ozone neither notably decreased nor increased (WMO/UNEP 2010). The
ozone layer outside the Polar regions is expected to recover to its pre-1980 levels before 2050. However, the springtime
ozone hole over Antarctica is expected to recover much later.
26](https://image.slidesharecdn.com/keepingtrack-111104035934-phpapp01/75/Keeping-track-UNEP-From-Rio-to-Rio-20-1992-2012-36-2048.jpg)
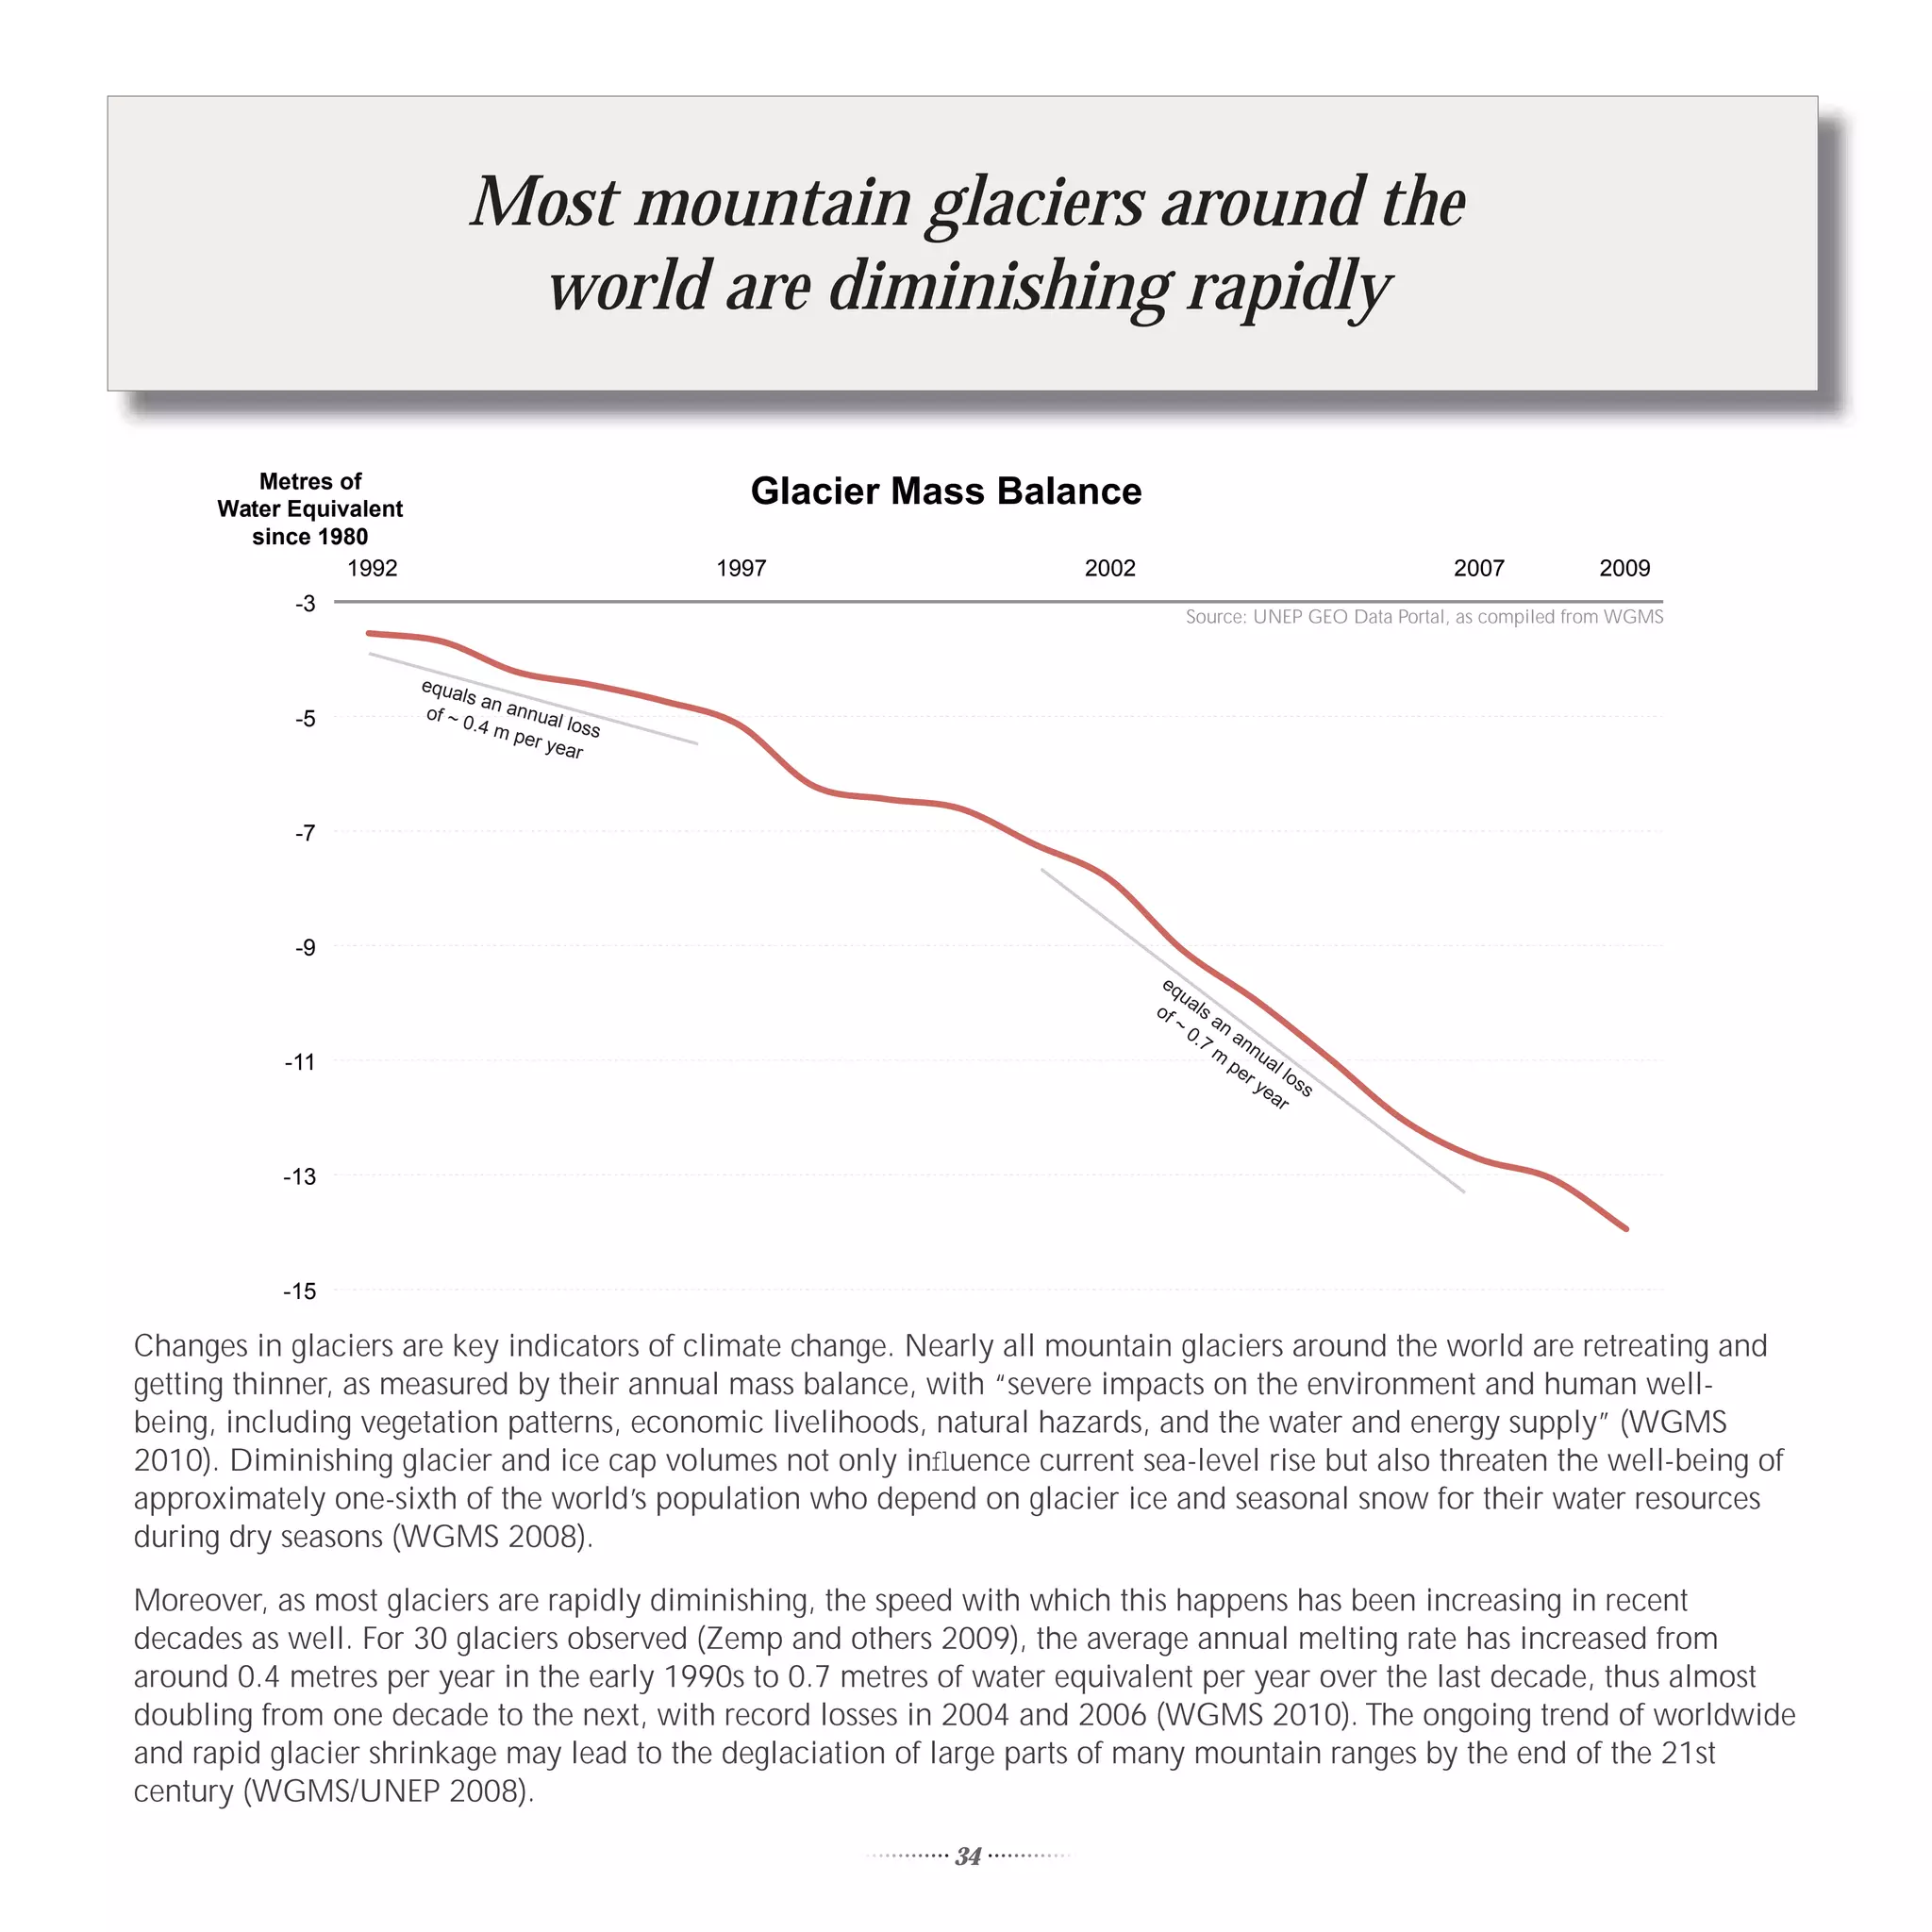
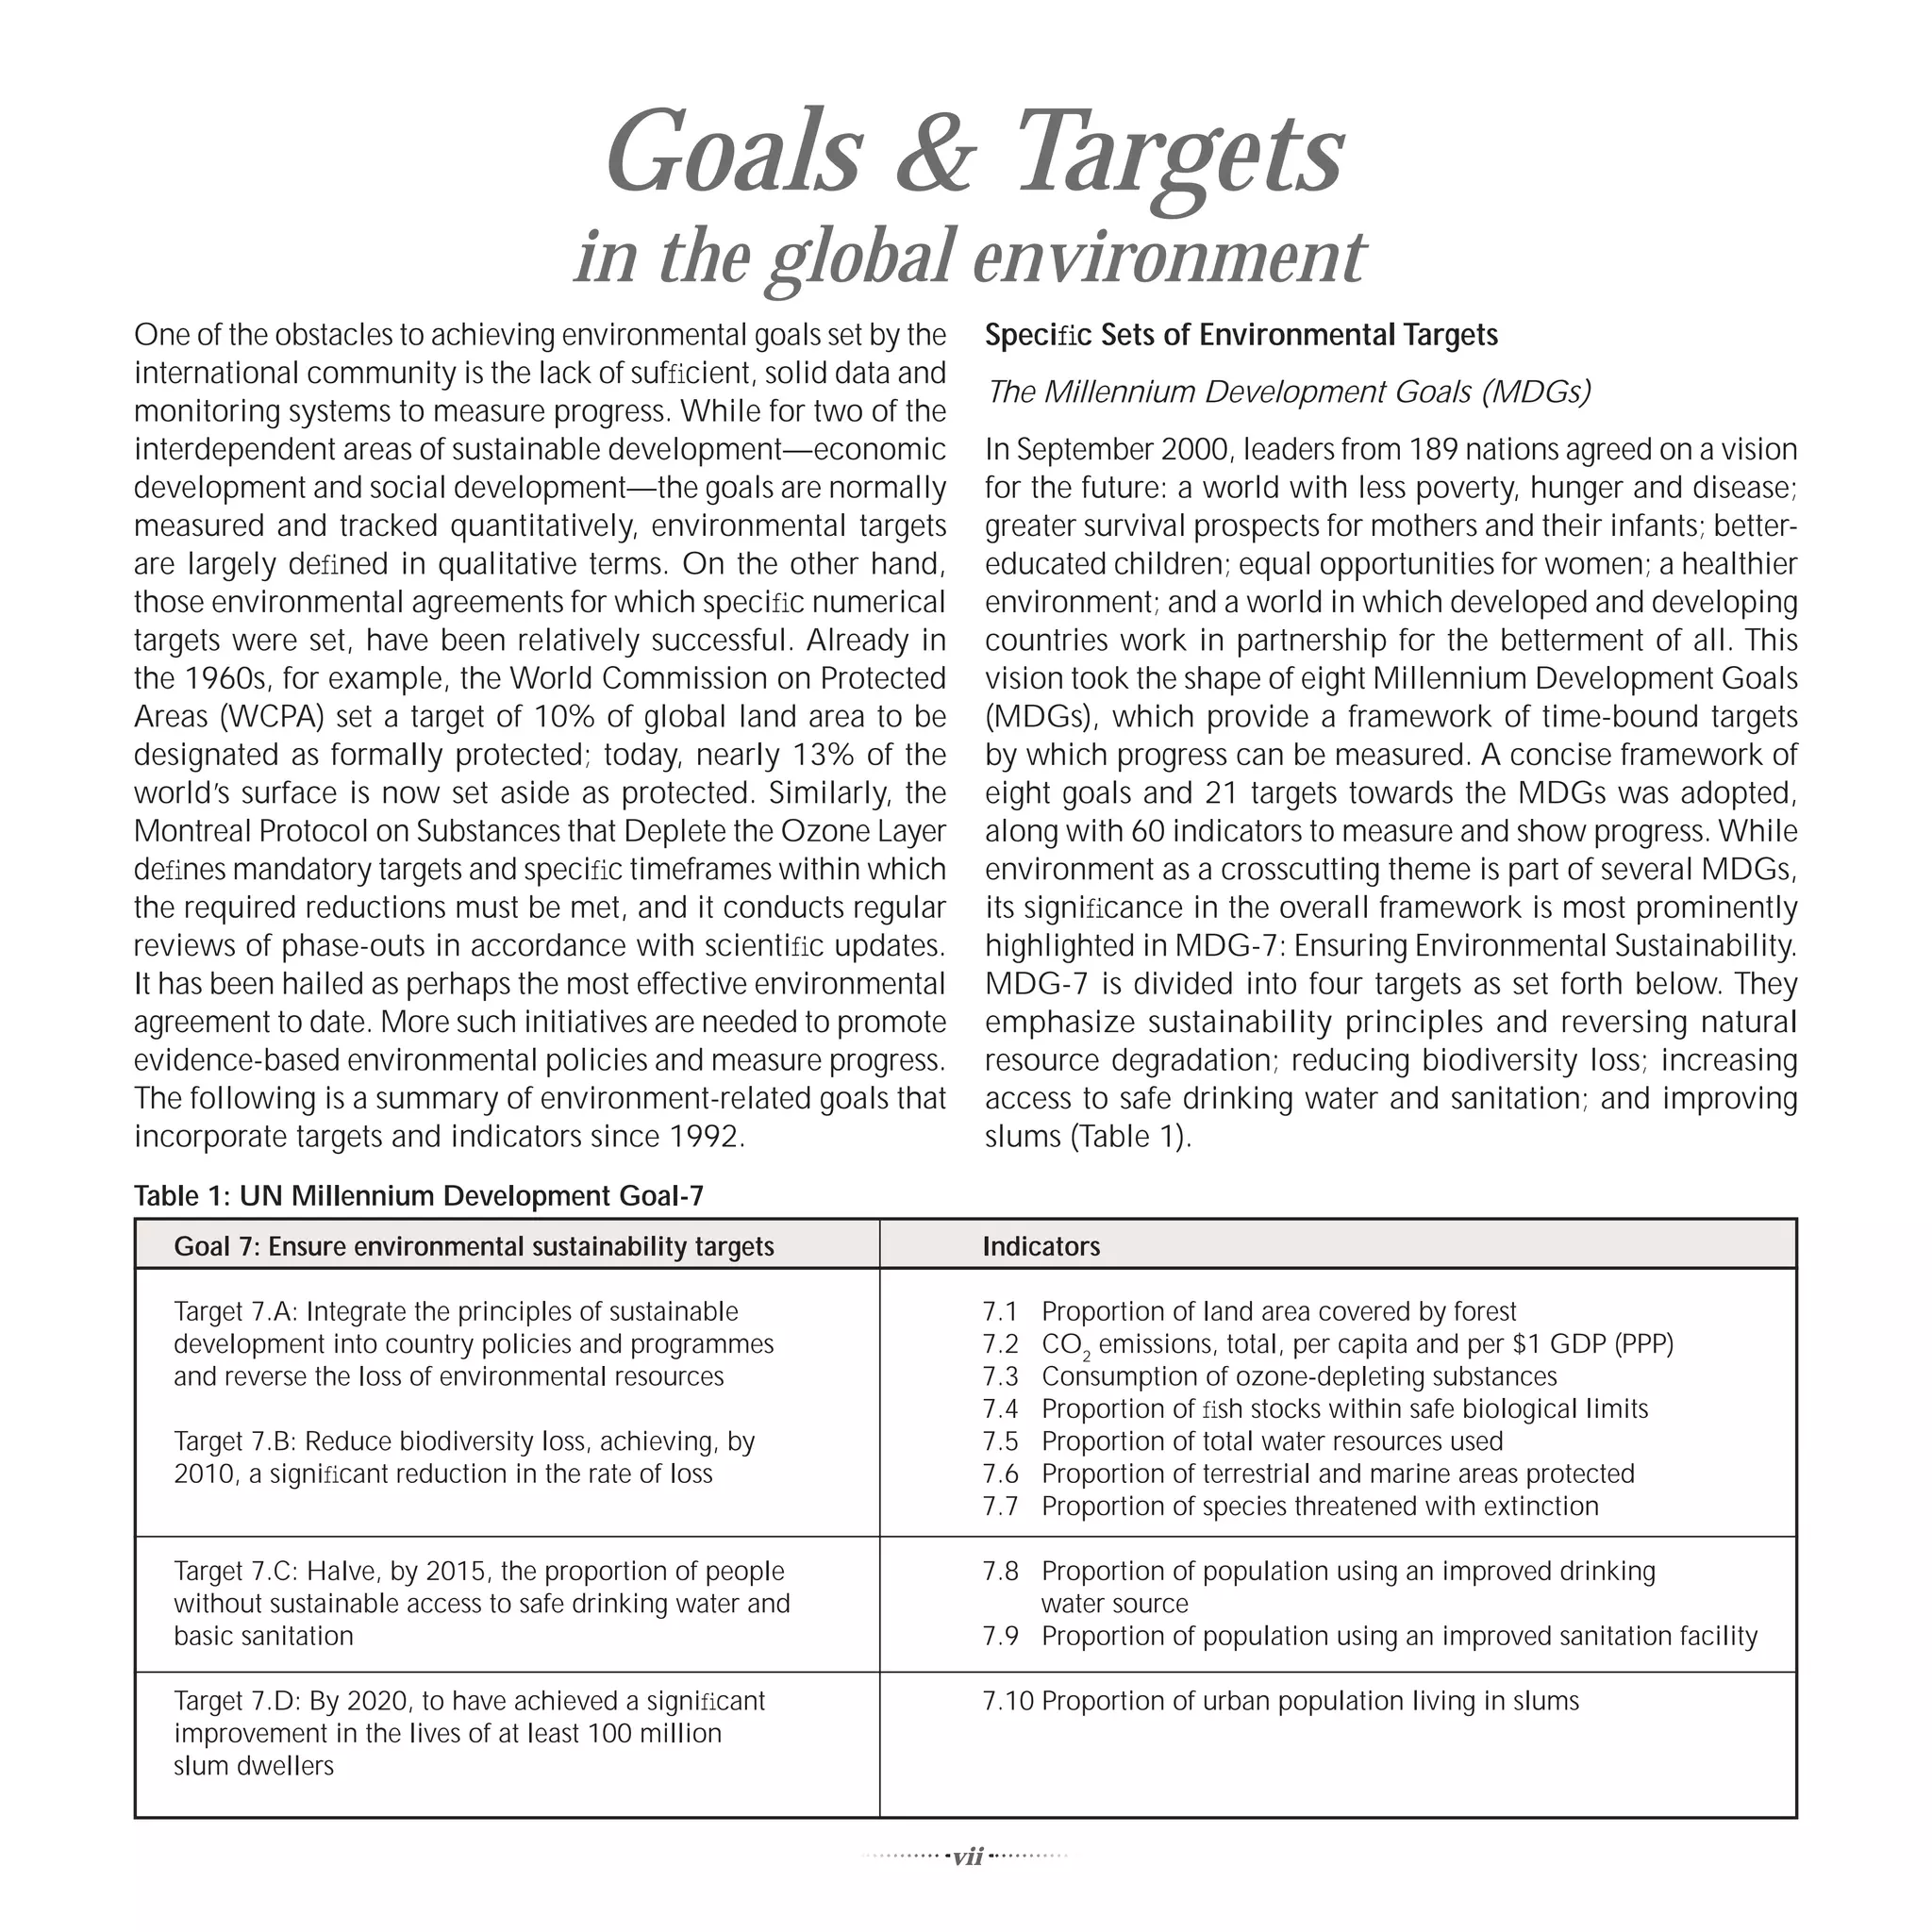
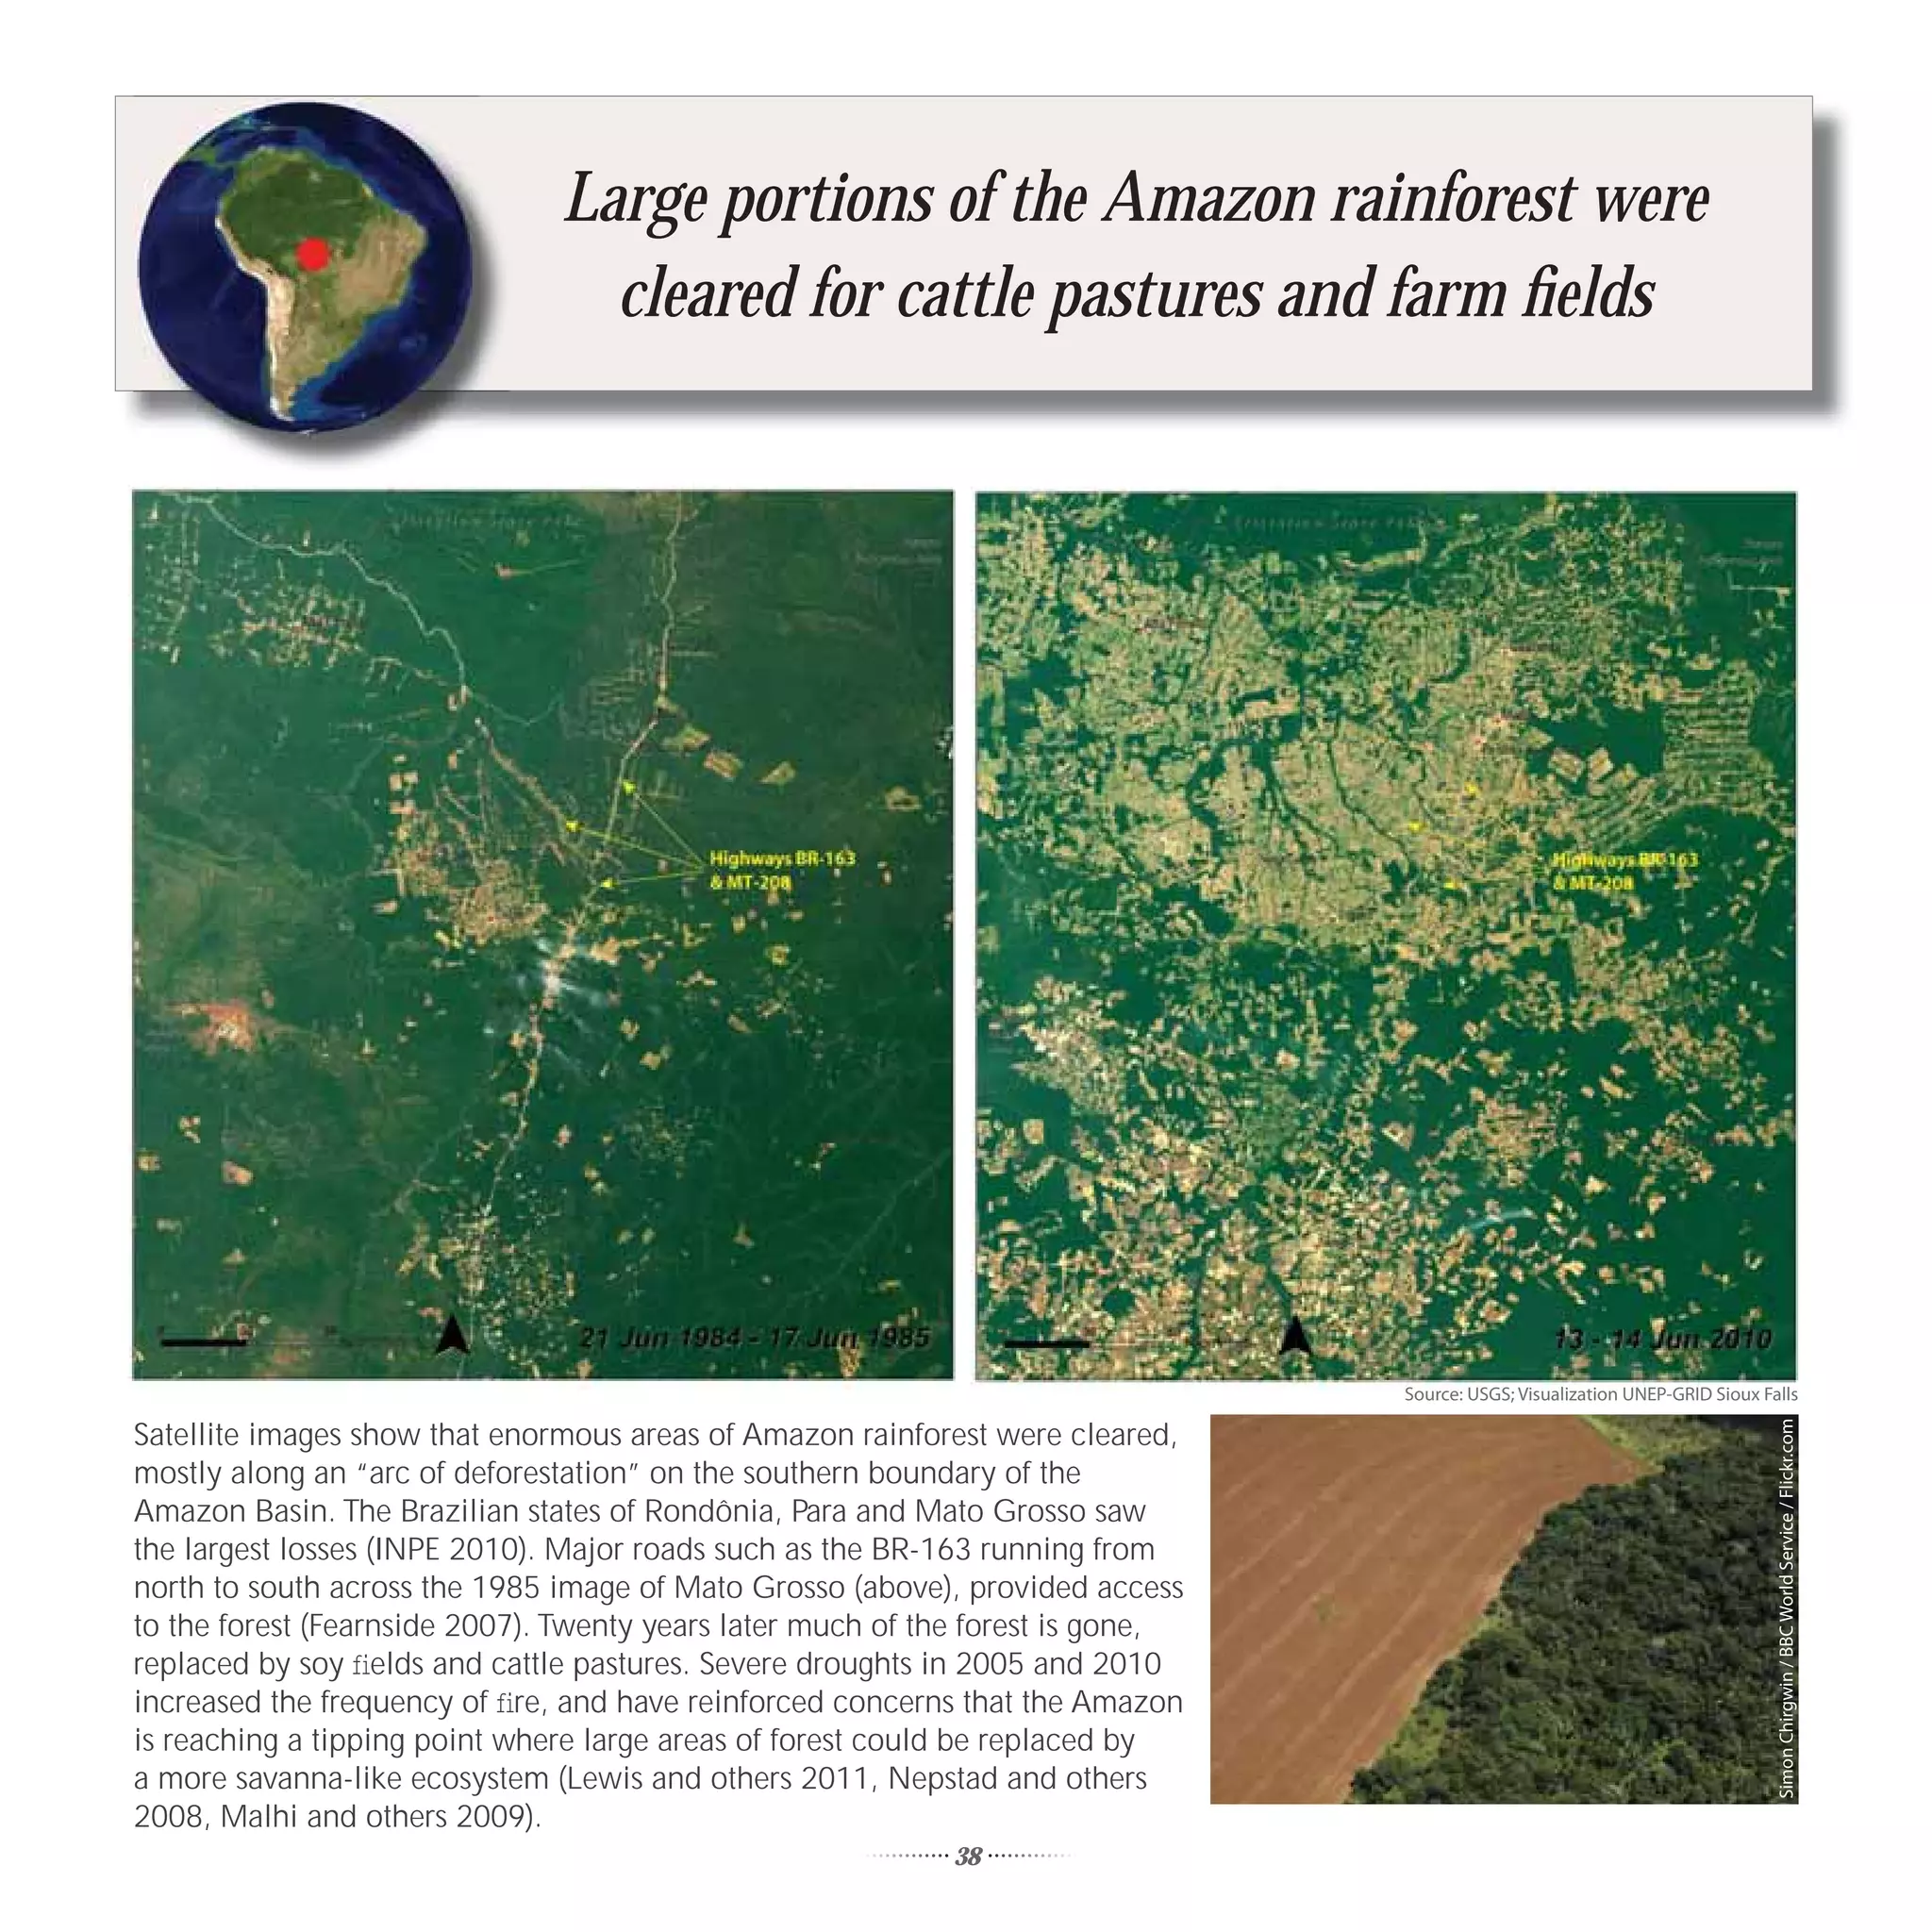
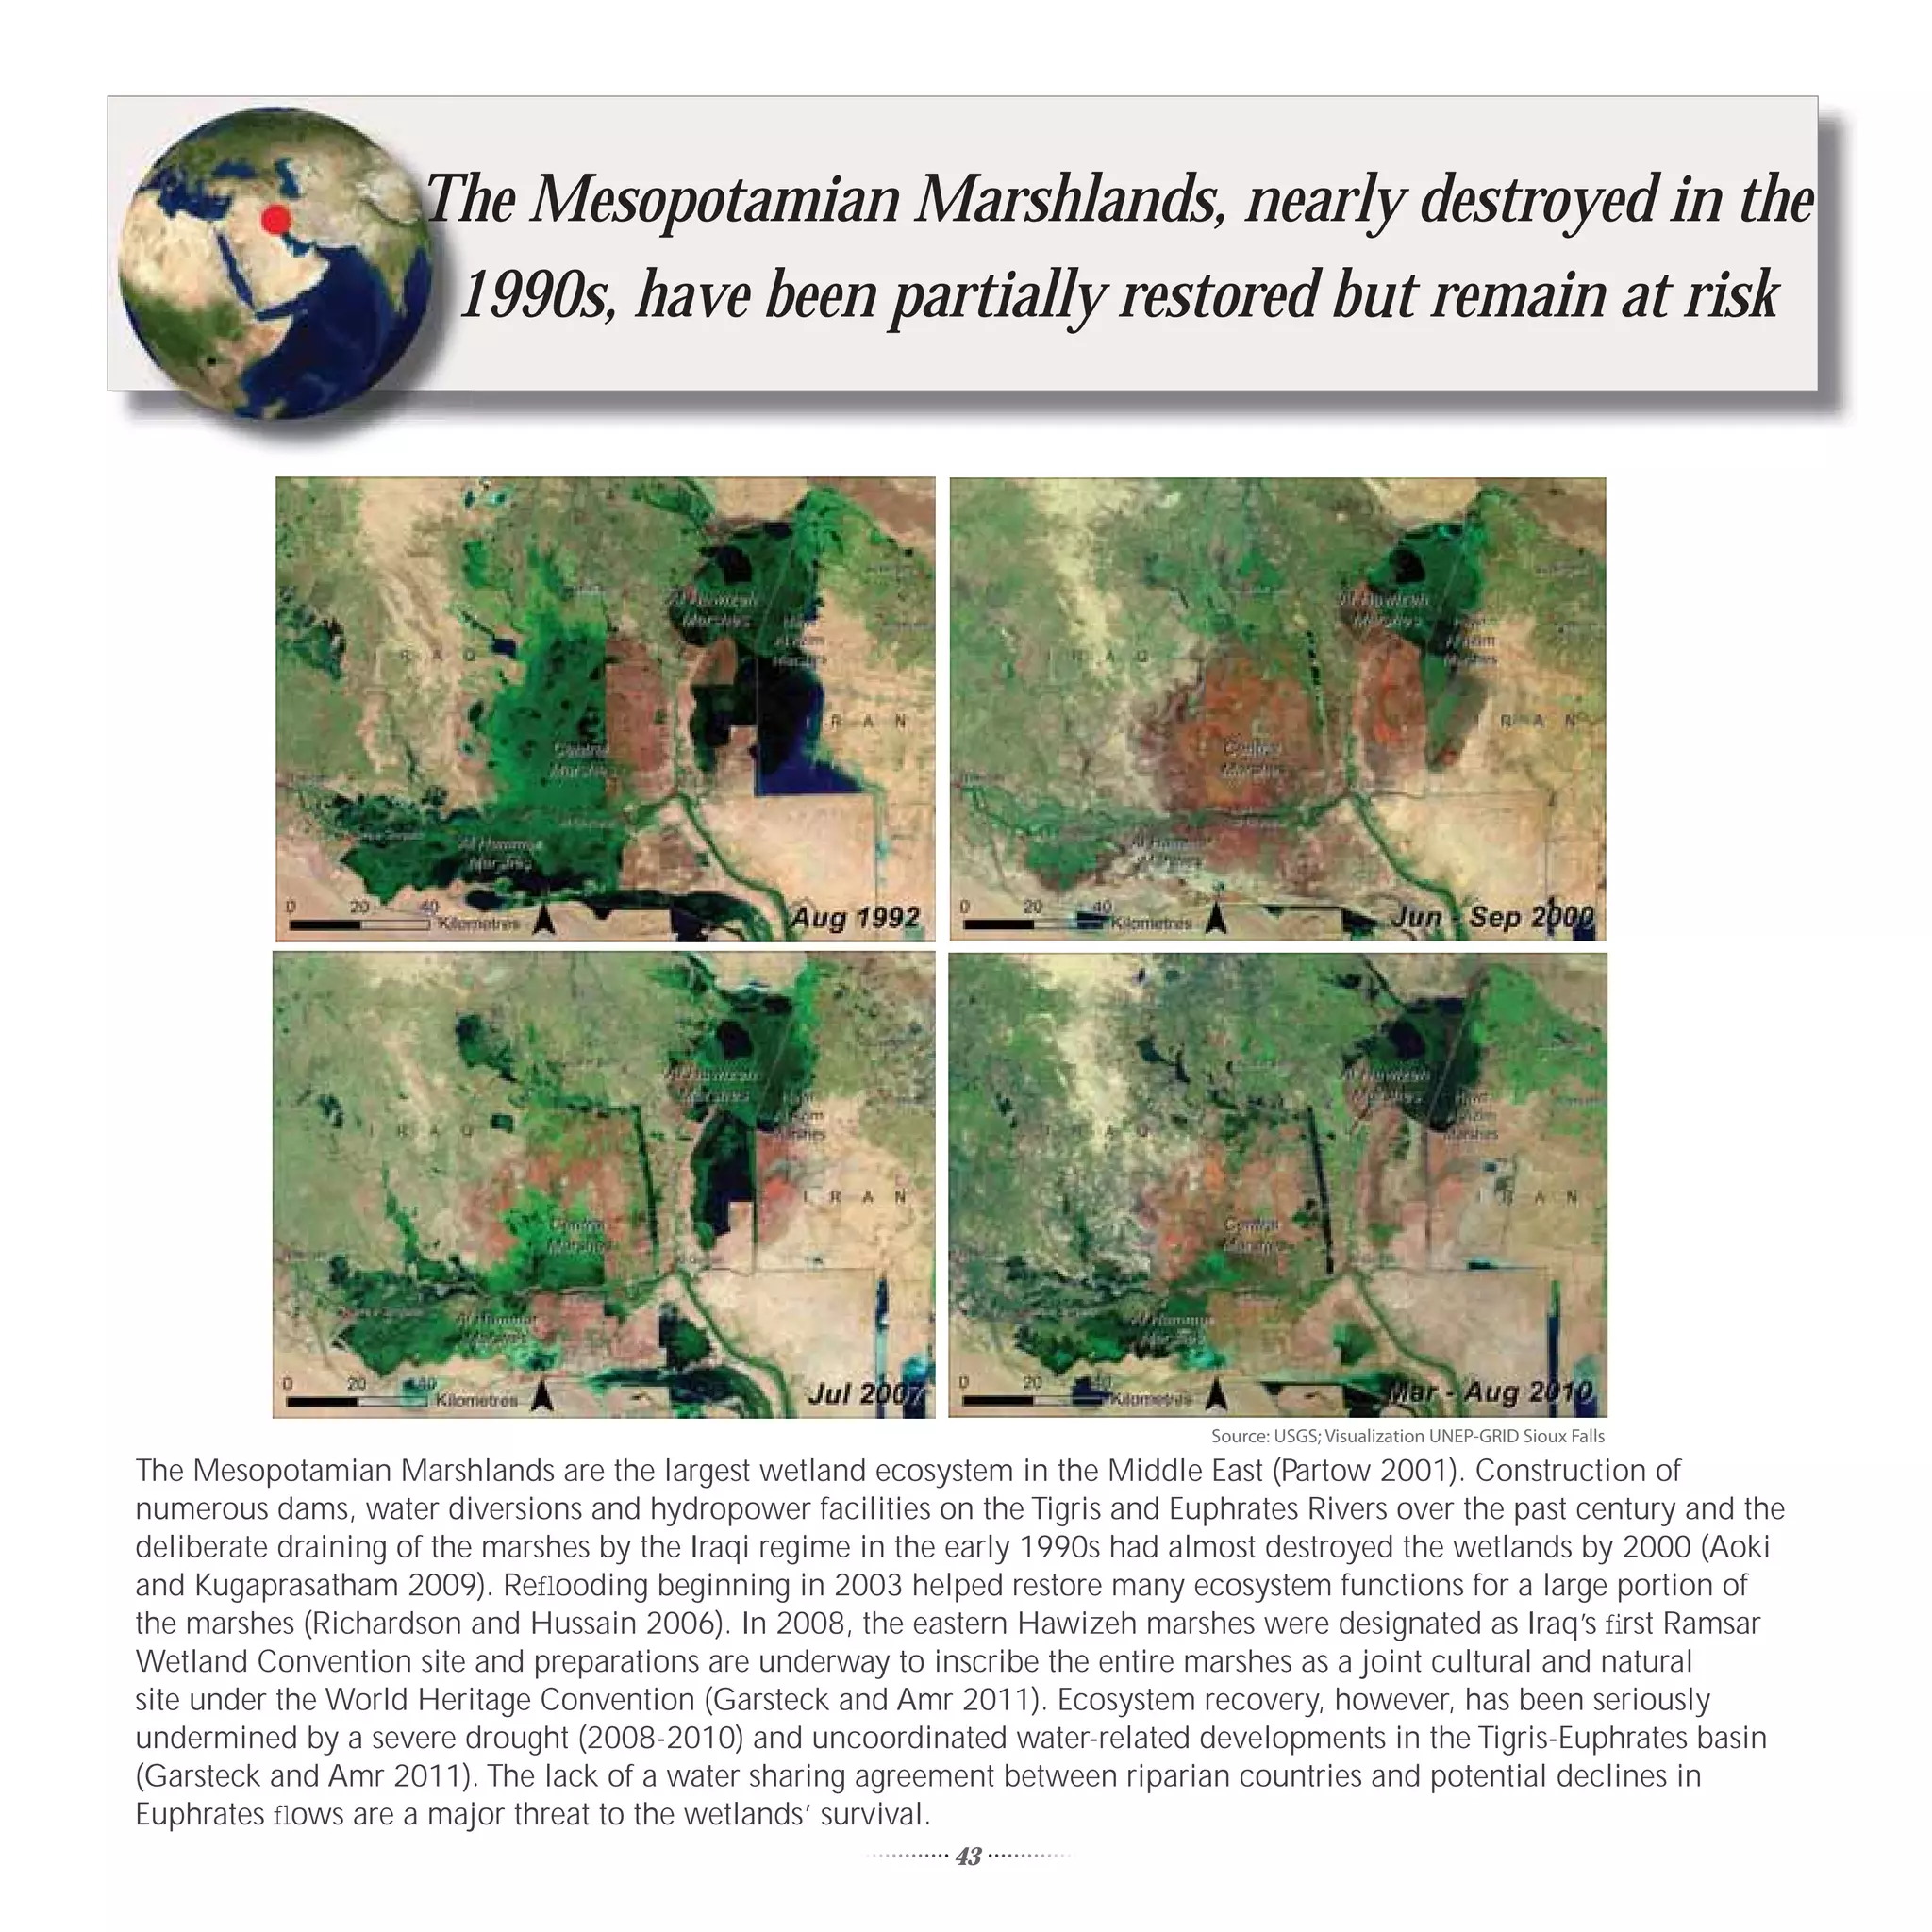
![Forest area has decreased by 300 million ha
since 1990, or an area larger than Argentina
Forests currently cover around 30% of the Earth’s Forest Net Change
land mass. Although the rate of deforestation is
slowing down, large areas of primary forest and other North America
1990-00
2000-05
naturally regenerated forests are declining, especially 2005-10
in South America and Africa, while forested areas in
Europe and Asia are stable or increasing due to large- Latin America + Caribbean
scale afforestation programmes. Around 13 million
hectares of forest were converted to other uses or Europe
lost through natural causes each year between 2000
and 2010, compared to 16 million hectares per year
during the preceding decade (FAO 2010). This results Asia + Pacific
not only in biodiversity loss, but also contributes
12-15% to global warming by releasing CO2 into the Africa
atmosphere and hampering further CO2 storage (van
Source: UNEP GEO Data Portal, as compiled from FAO
der Werf and others 2009, UCSUSA 2011). “Millions -5 -4 -3 -2 -1 0 1 2 3
of hectares of tropical forest are cleared every year Million Hectares per Year
to make way for agriculture, pastures and other
non-forest uses, or are degraded by unsustainable
or illegal logging and other poor land-use practices”
(ITTO 2011).
Thousand Hectares
Mangrove Forest Extent
Also in decline since several decades ago are 17
mangrove forests—important from social, economic
and biological points of view. For example,
“mangrove forests act as extremely effective carbon 16
sinks, able to absorb [nearly 100] tonnes of carbon
per hectare, or more than three times the absorptive -3%
capacity of non-mangrove forests” (UNDP 2011b).
since 1990
15
Between 1990 and 2010, 3% of mangrove extent
was lost, mostly as a result of coastal development 14
and conversions to agriculture and aquaculture (rice
fields, shrimp farms). Using high-resolution satellite
imagery, the extent of mangroves in 2000 was even 13
Source: FAO
found to be 13% less (blue point on the graph) than 1990 1995 2000 2005 2010
country statistics show (Giri and others 2010).
37](https://image.slidesharecdn.com/keepingtrack-111104035934-phpapp01/75/Keeping-track-UNEP-From-Rio-to-Rio-20-1992-2012-47-2048.jpg)


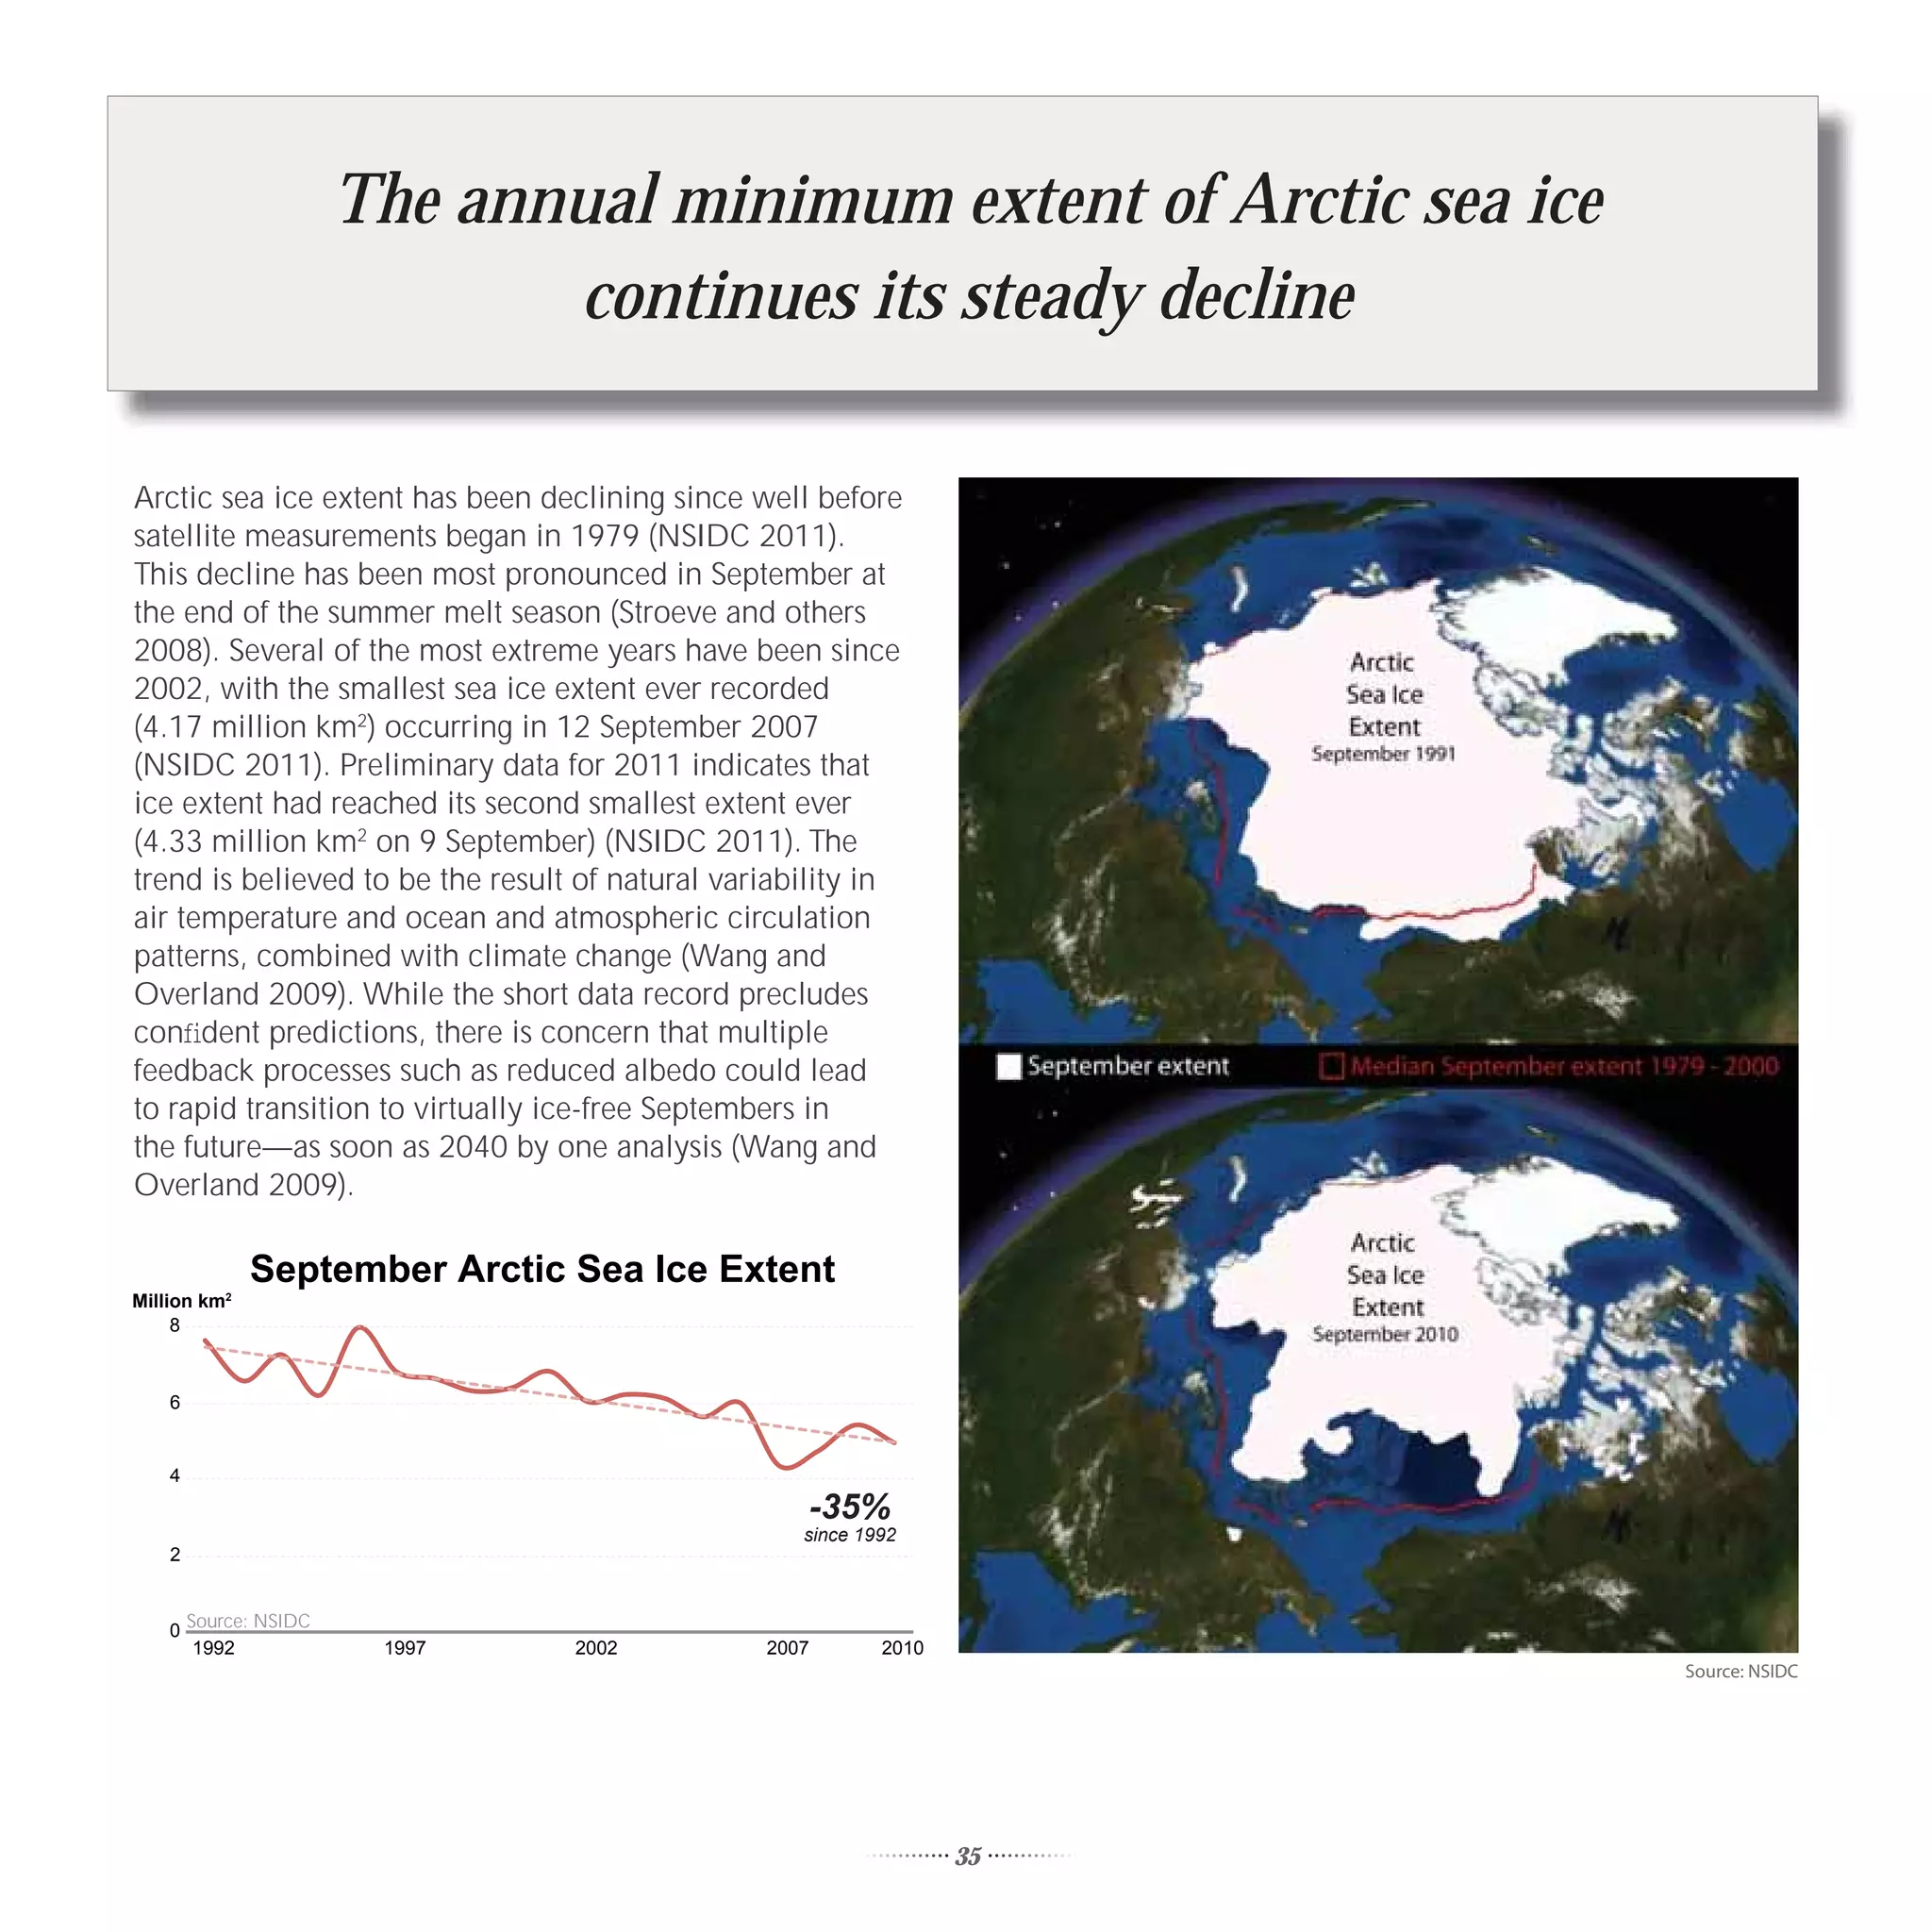
![Both the number of tanker oil spills recorded and the
quantity of oil involved have declined in 20 years
Oil Spills from Tankers Quantity
Number of Spills [Thousand Tonnes]
50 200
40
150
30
100
20
50
10
0 0
1992 1997 2002 2007 2010
Source: ITOPF
The number as well as the total quantity of oil from accidental oil spills from tankers (including combined carriers and
barges) have decreased significantly since 1992. Although the vast majority of spills are relatively small (i.e., less than seven
tonnes) (ITOPF 2011), the accumulated amount is nearly one million tonnes since 1992. “Most spills from tankers result
from routine operations such as loading, discharging and bunkering which normally occur in ports or at oil terminals”
(ITOPF 2011).
49](https://image.slidesharecdn.com/keepingtrack-111104035934-phpapp01/75/Keeping-track-UNEP-From-Rio-to-Rio-20-1992-2012-59-2048.jpg)
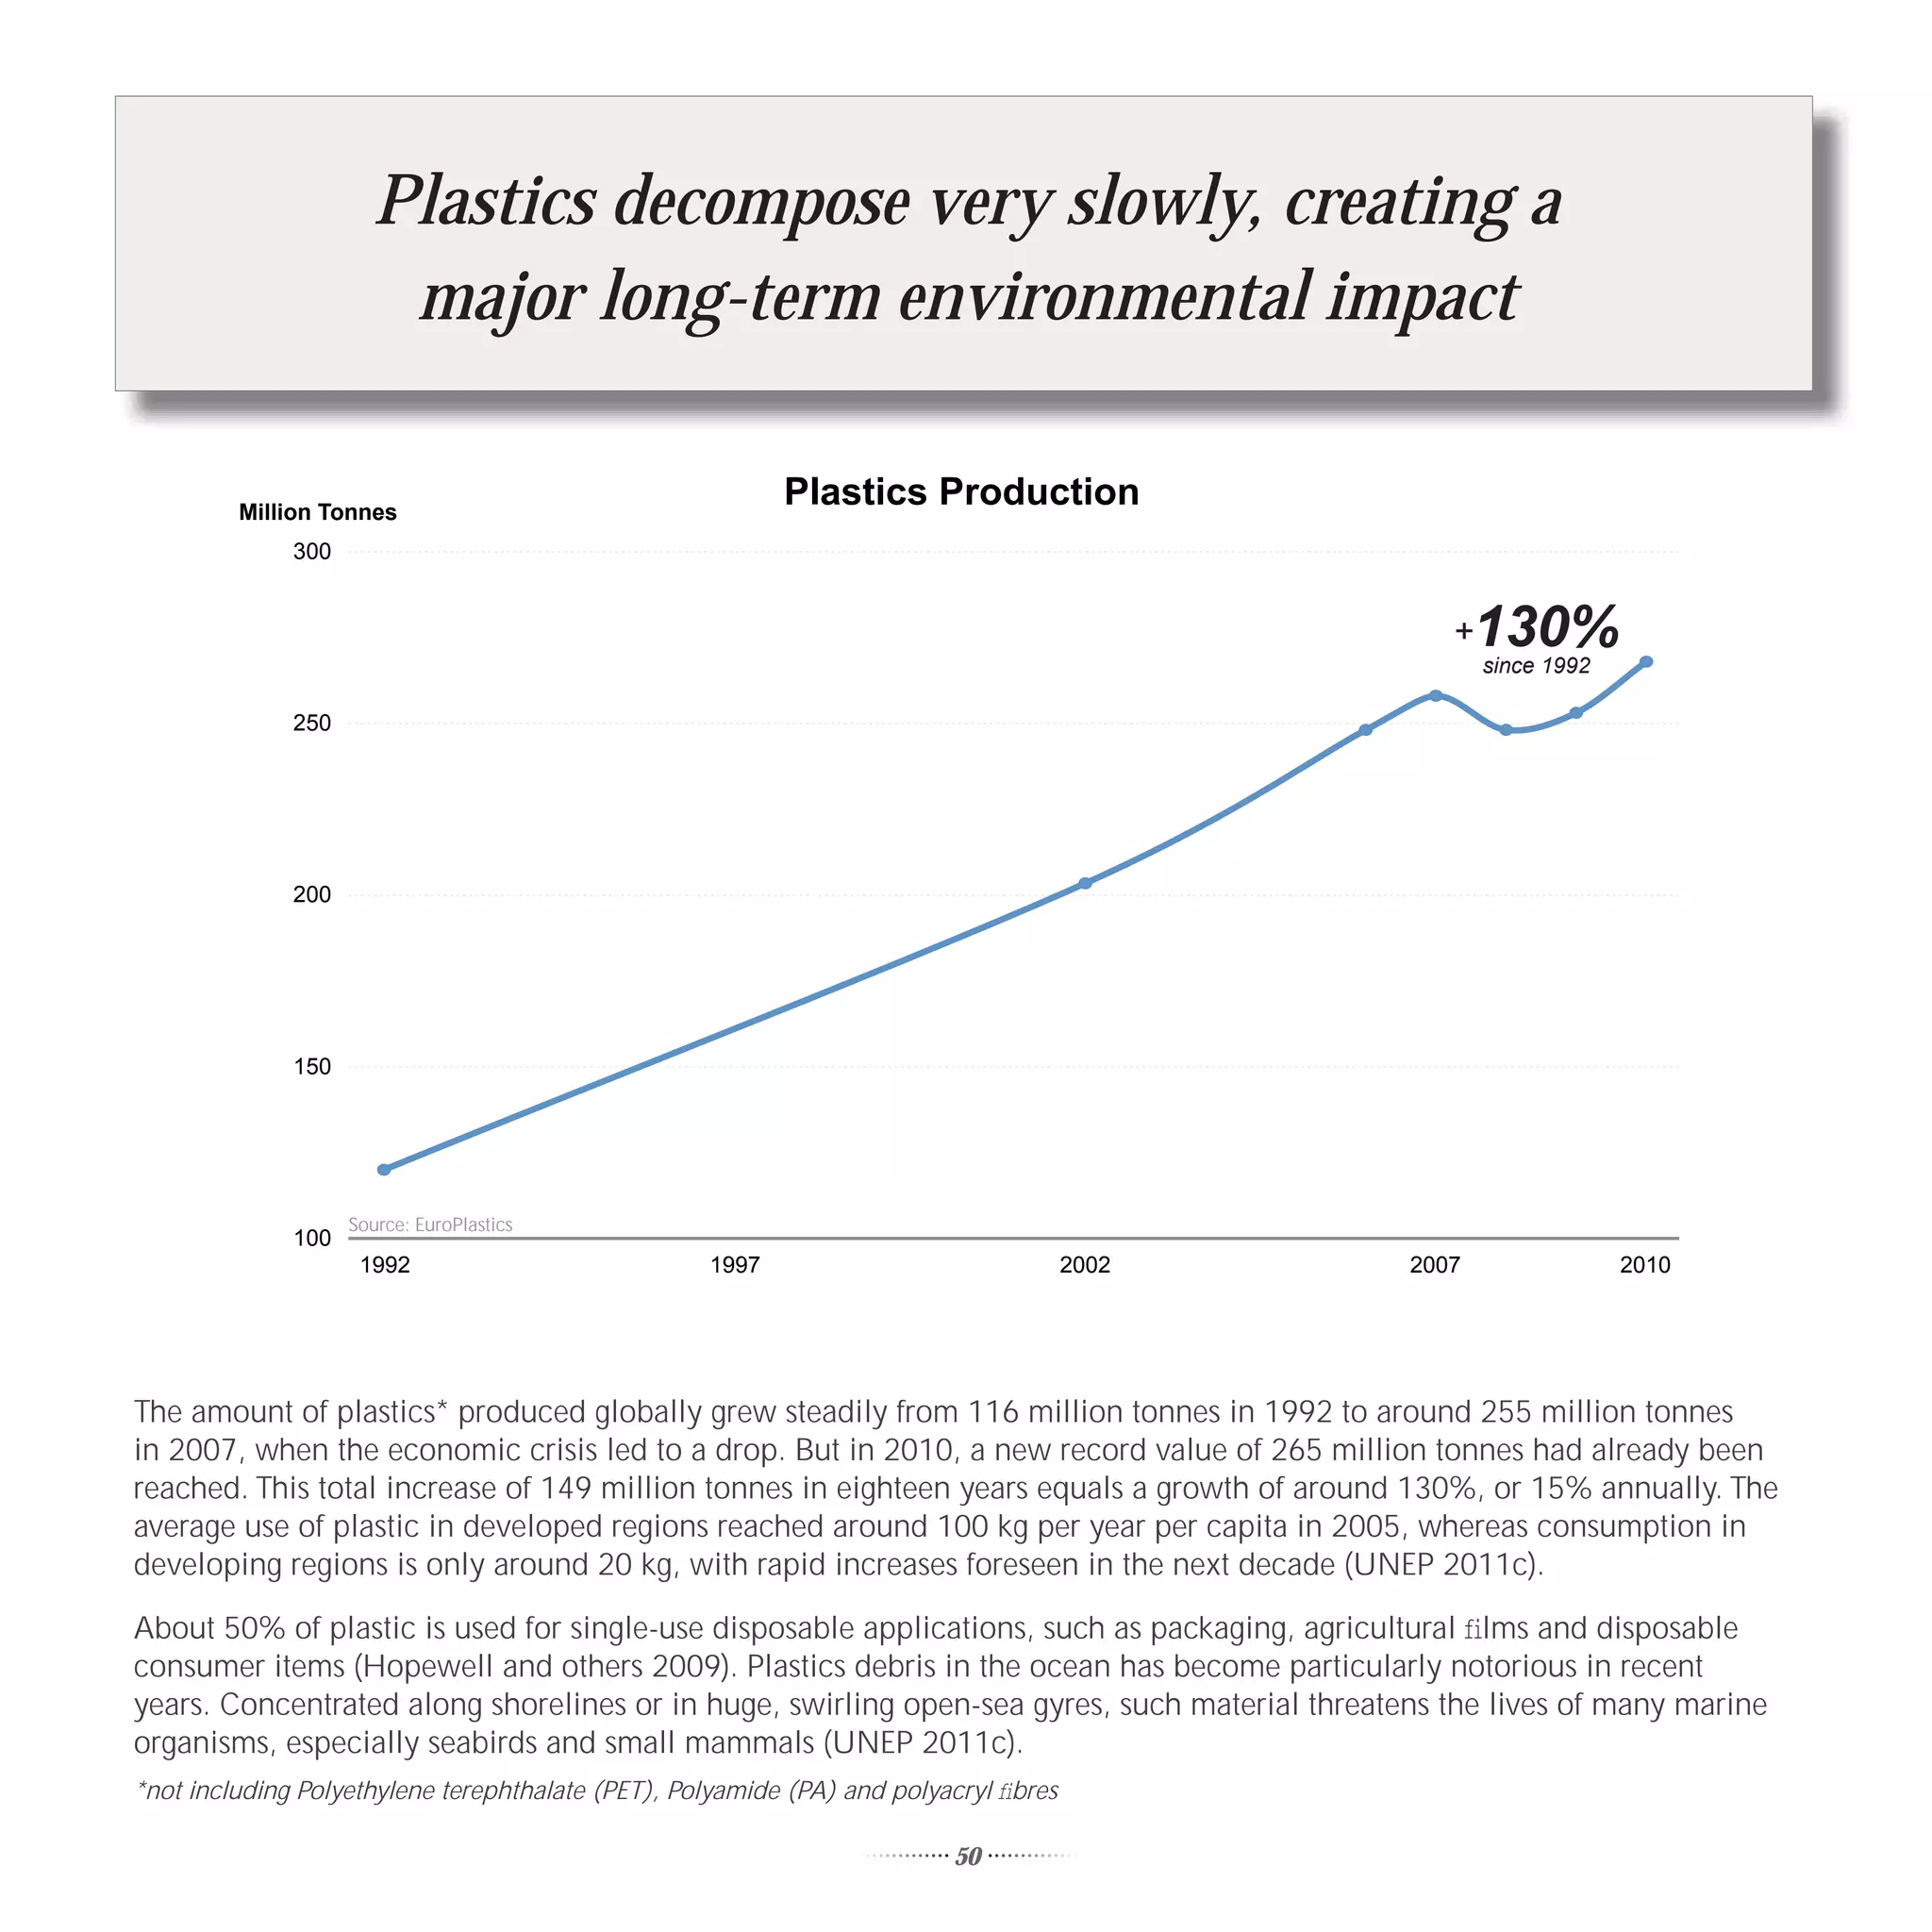
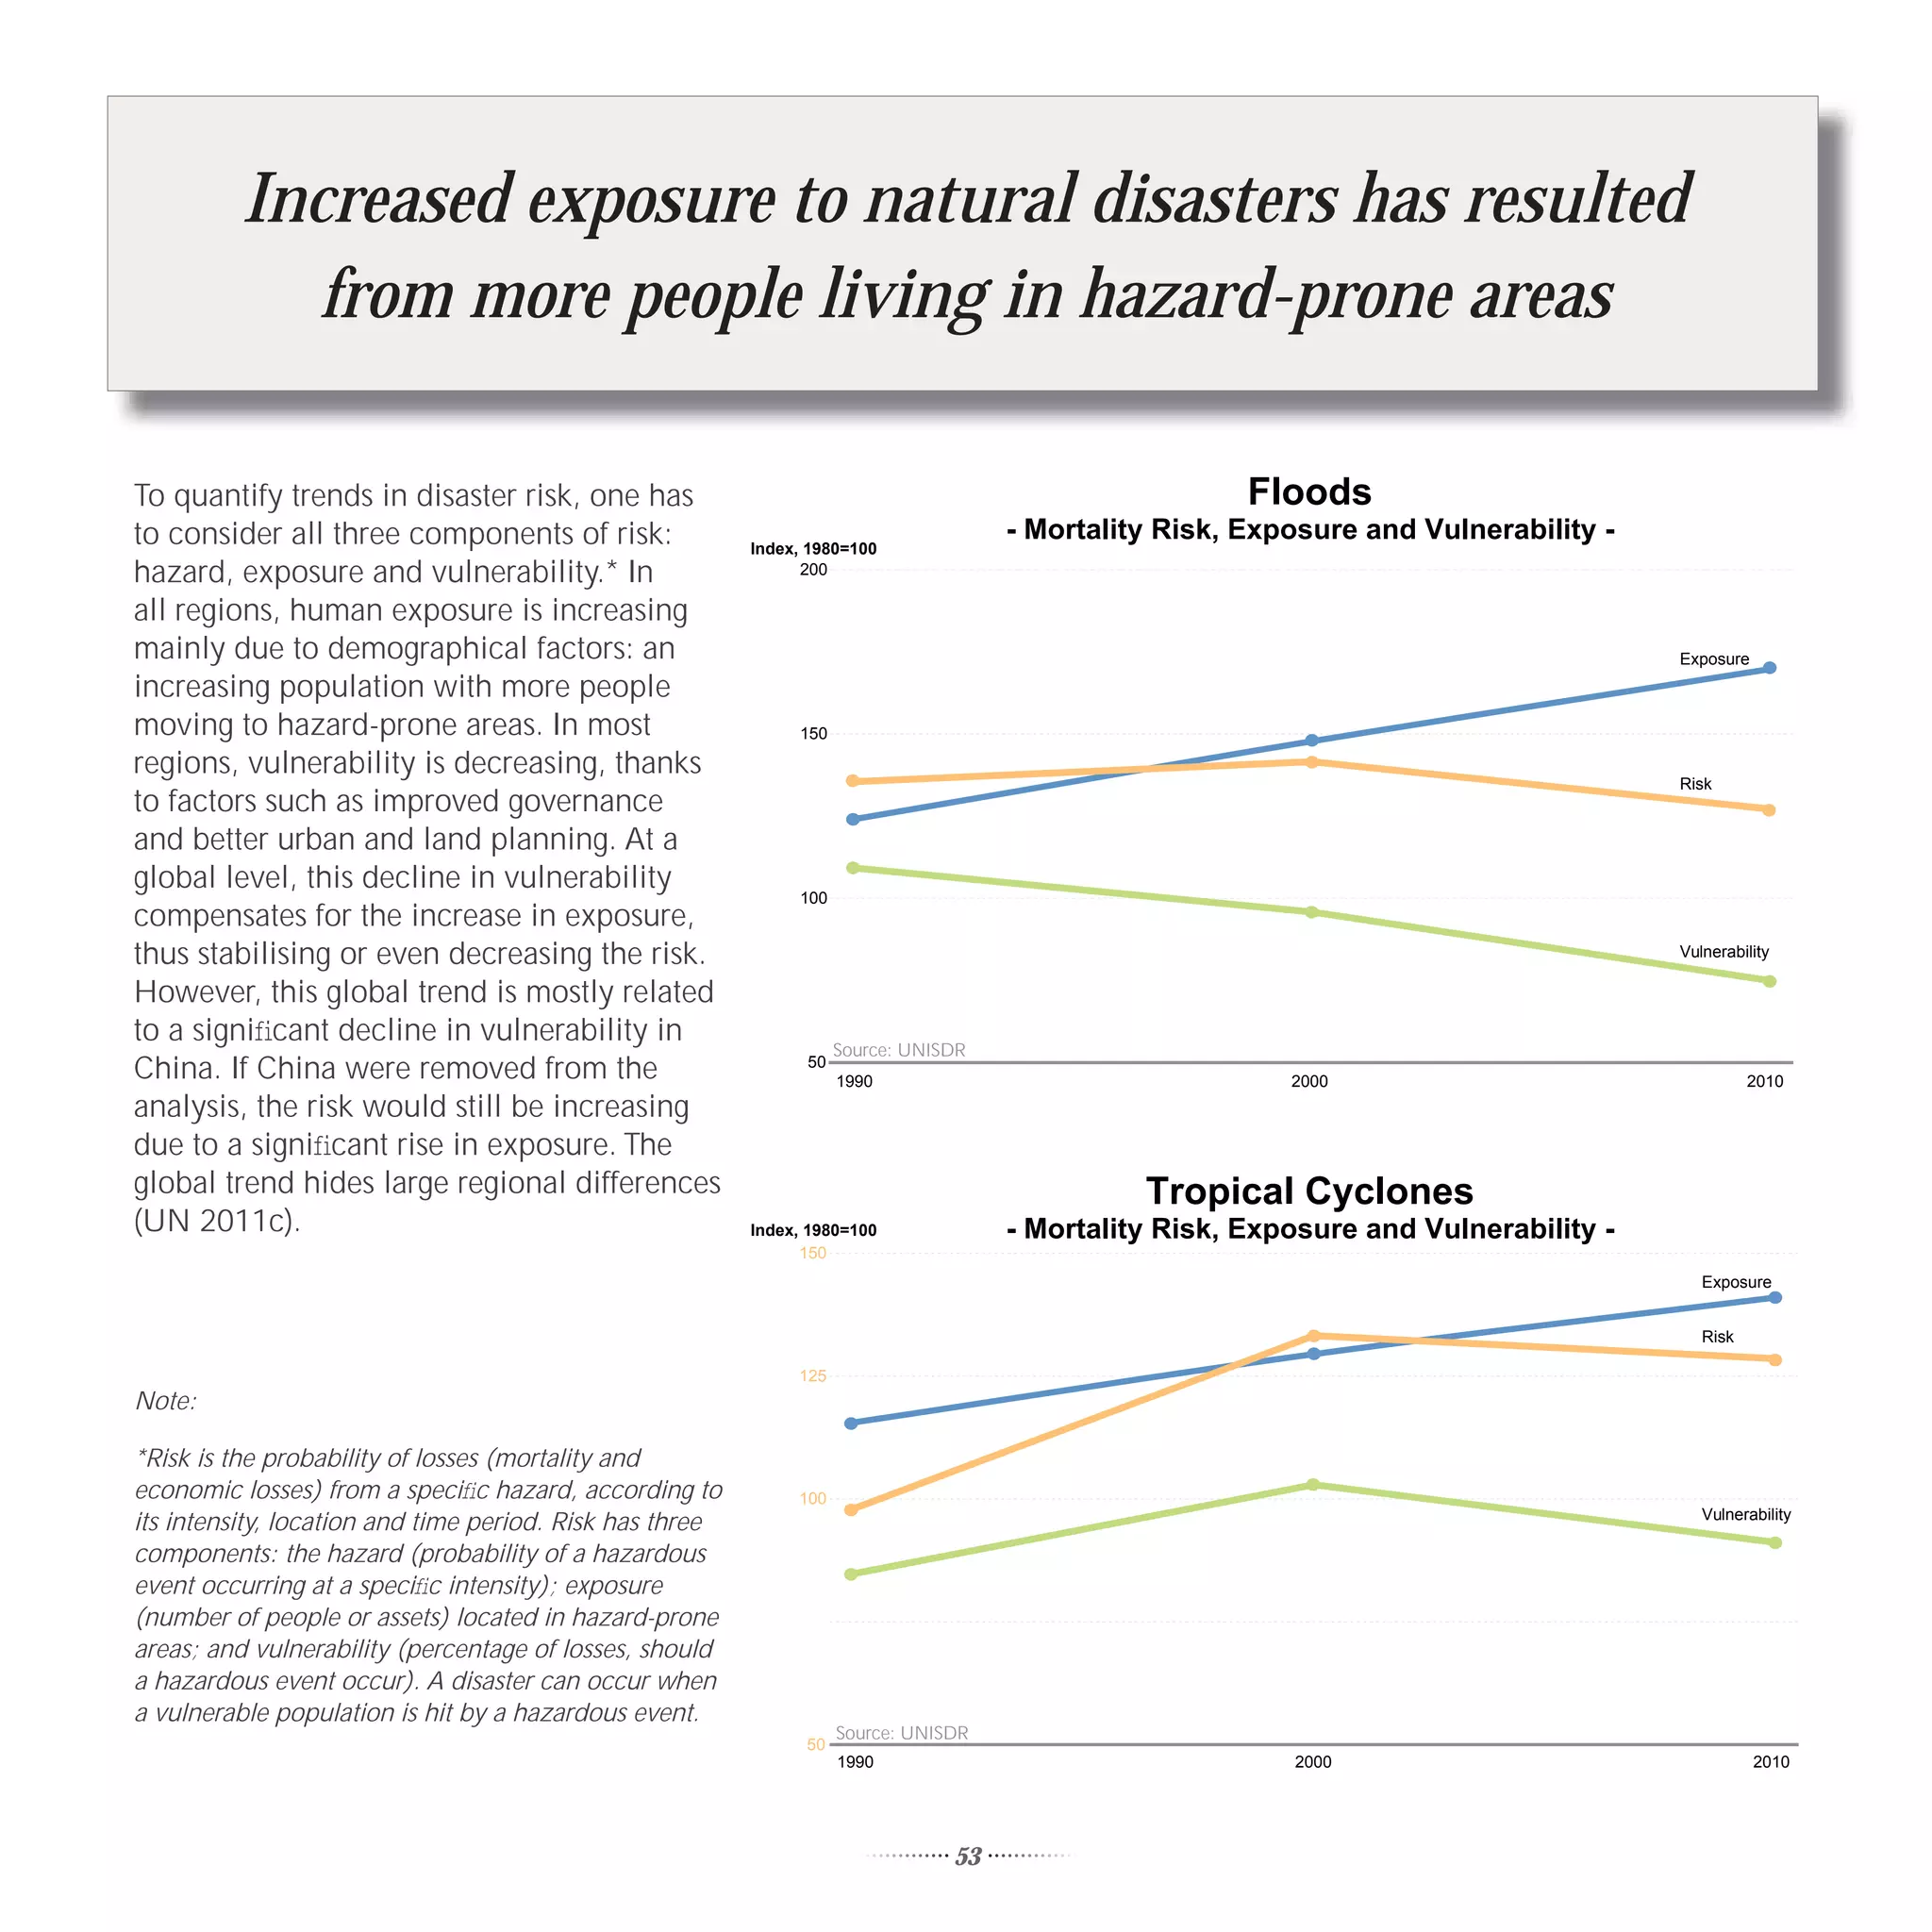

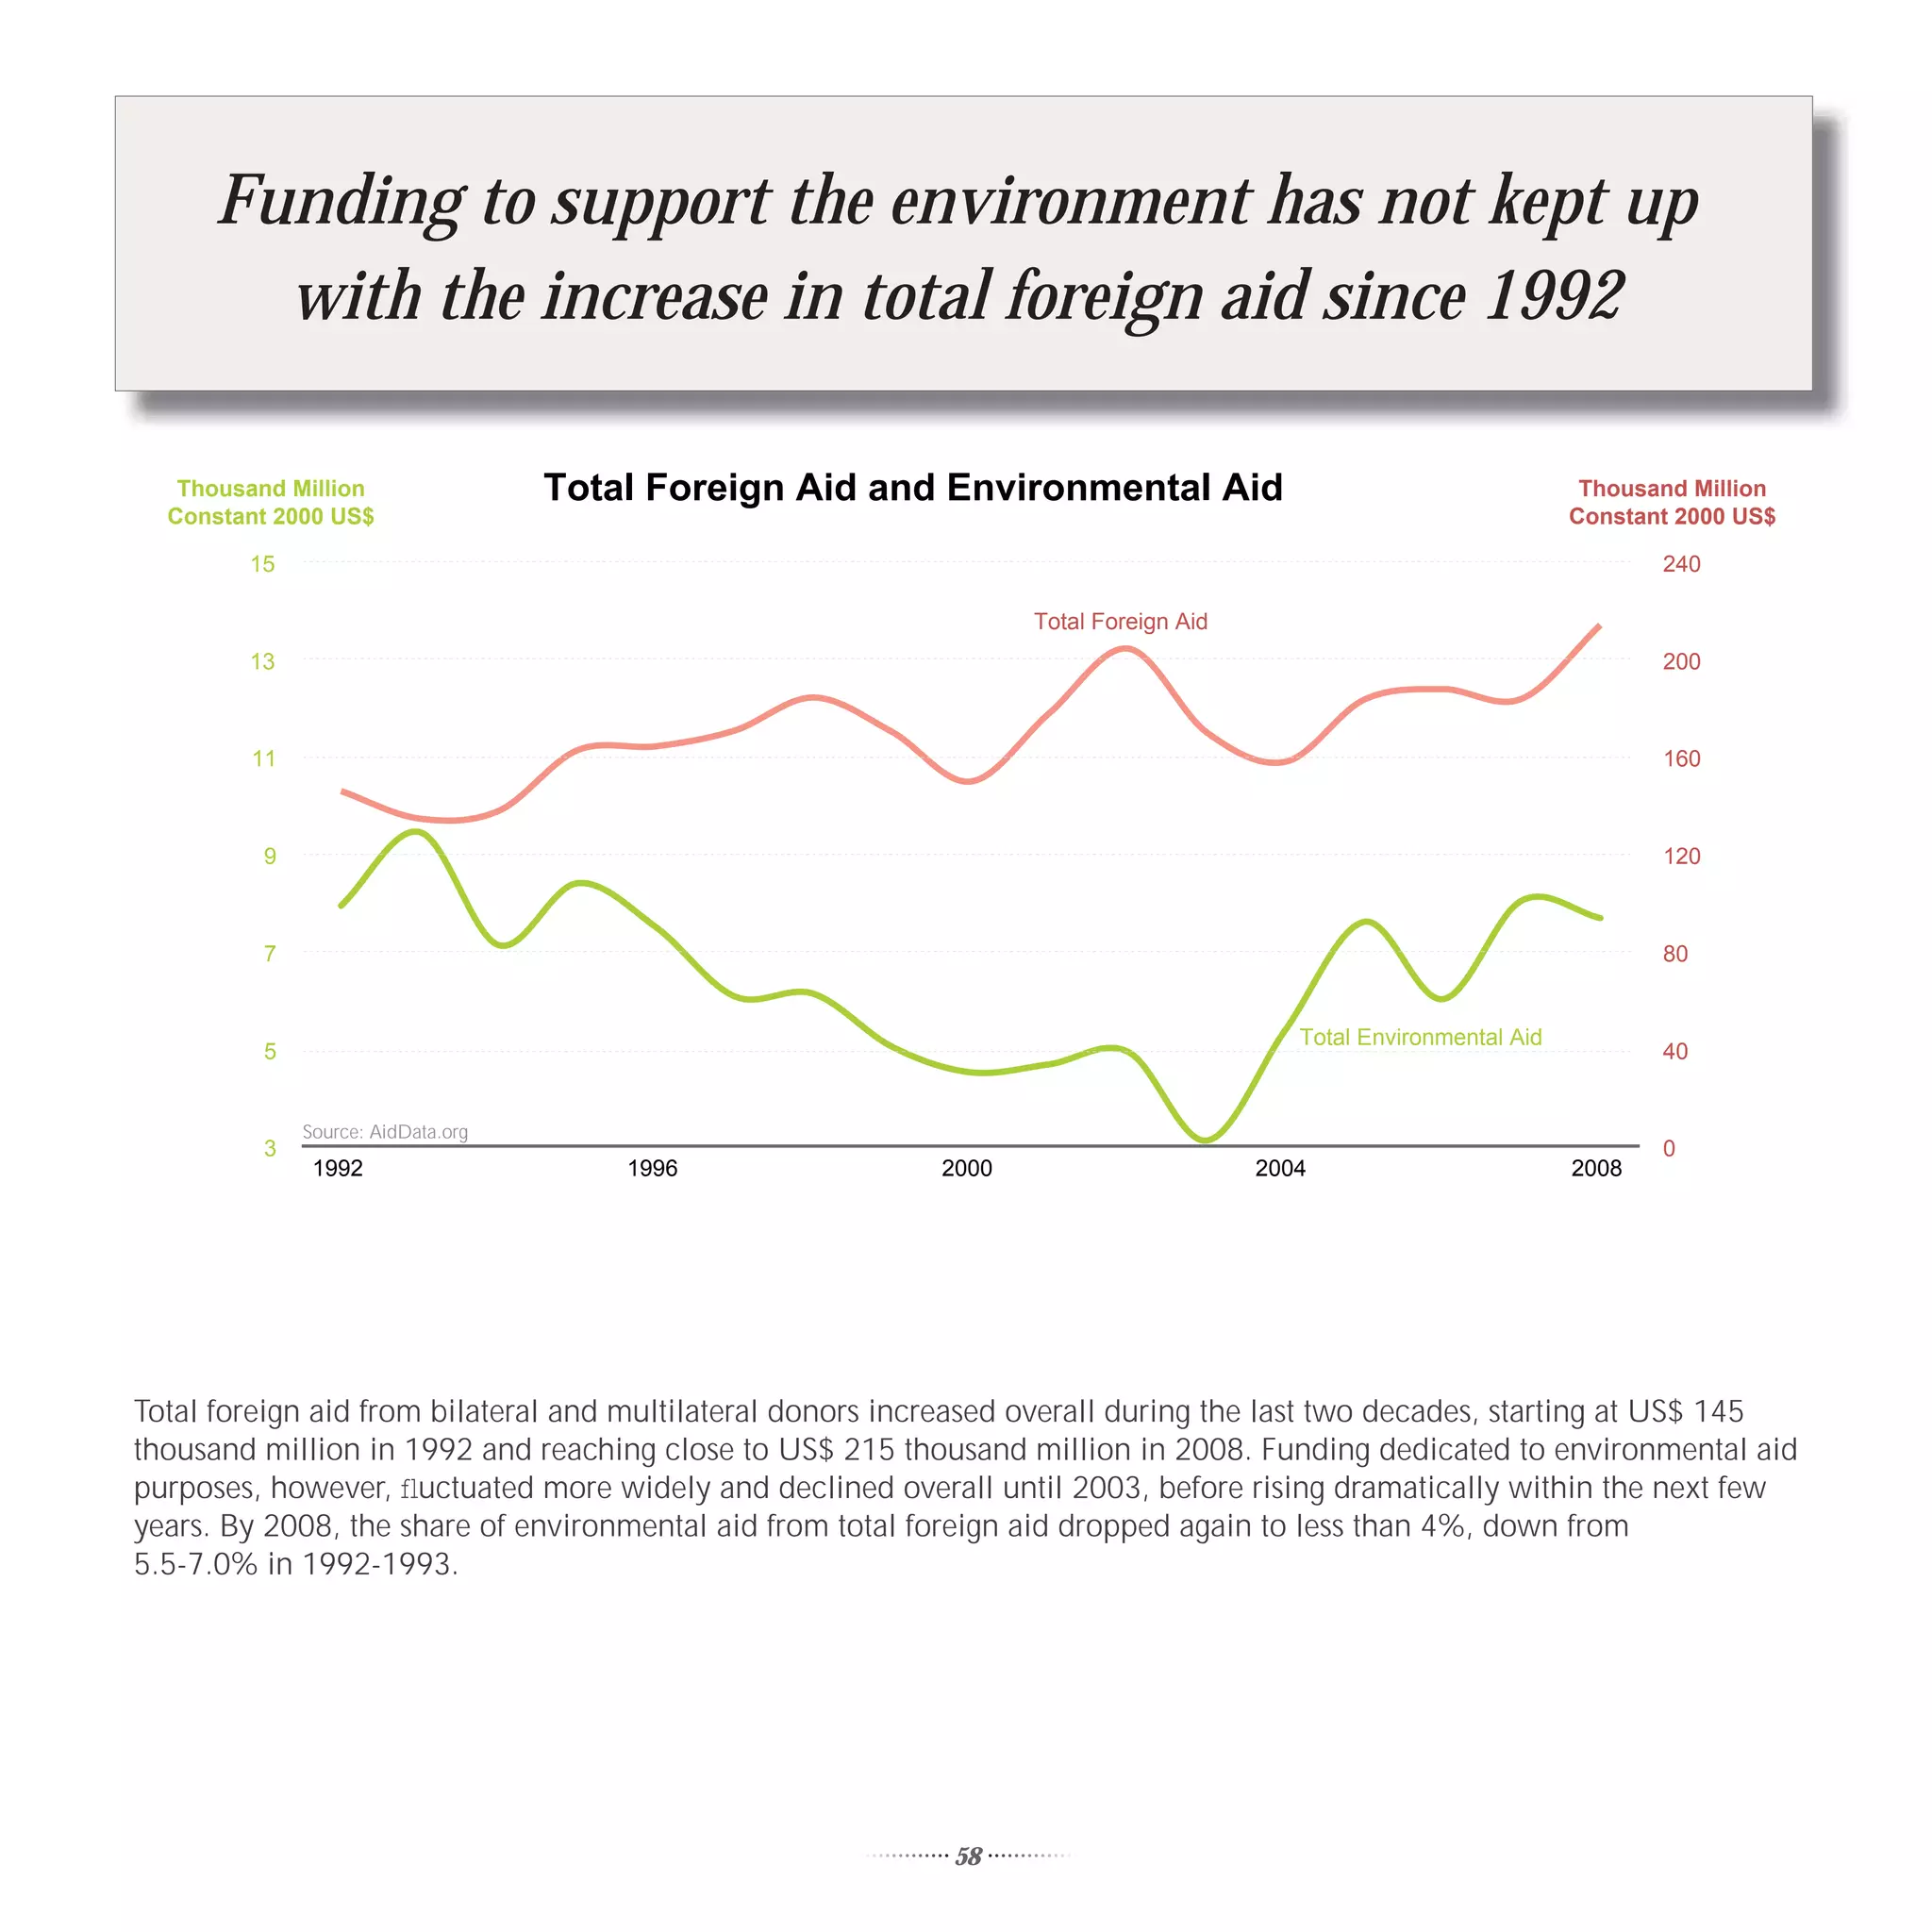

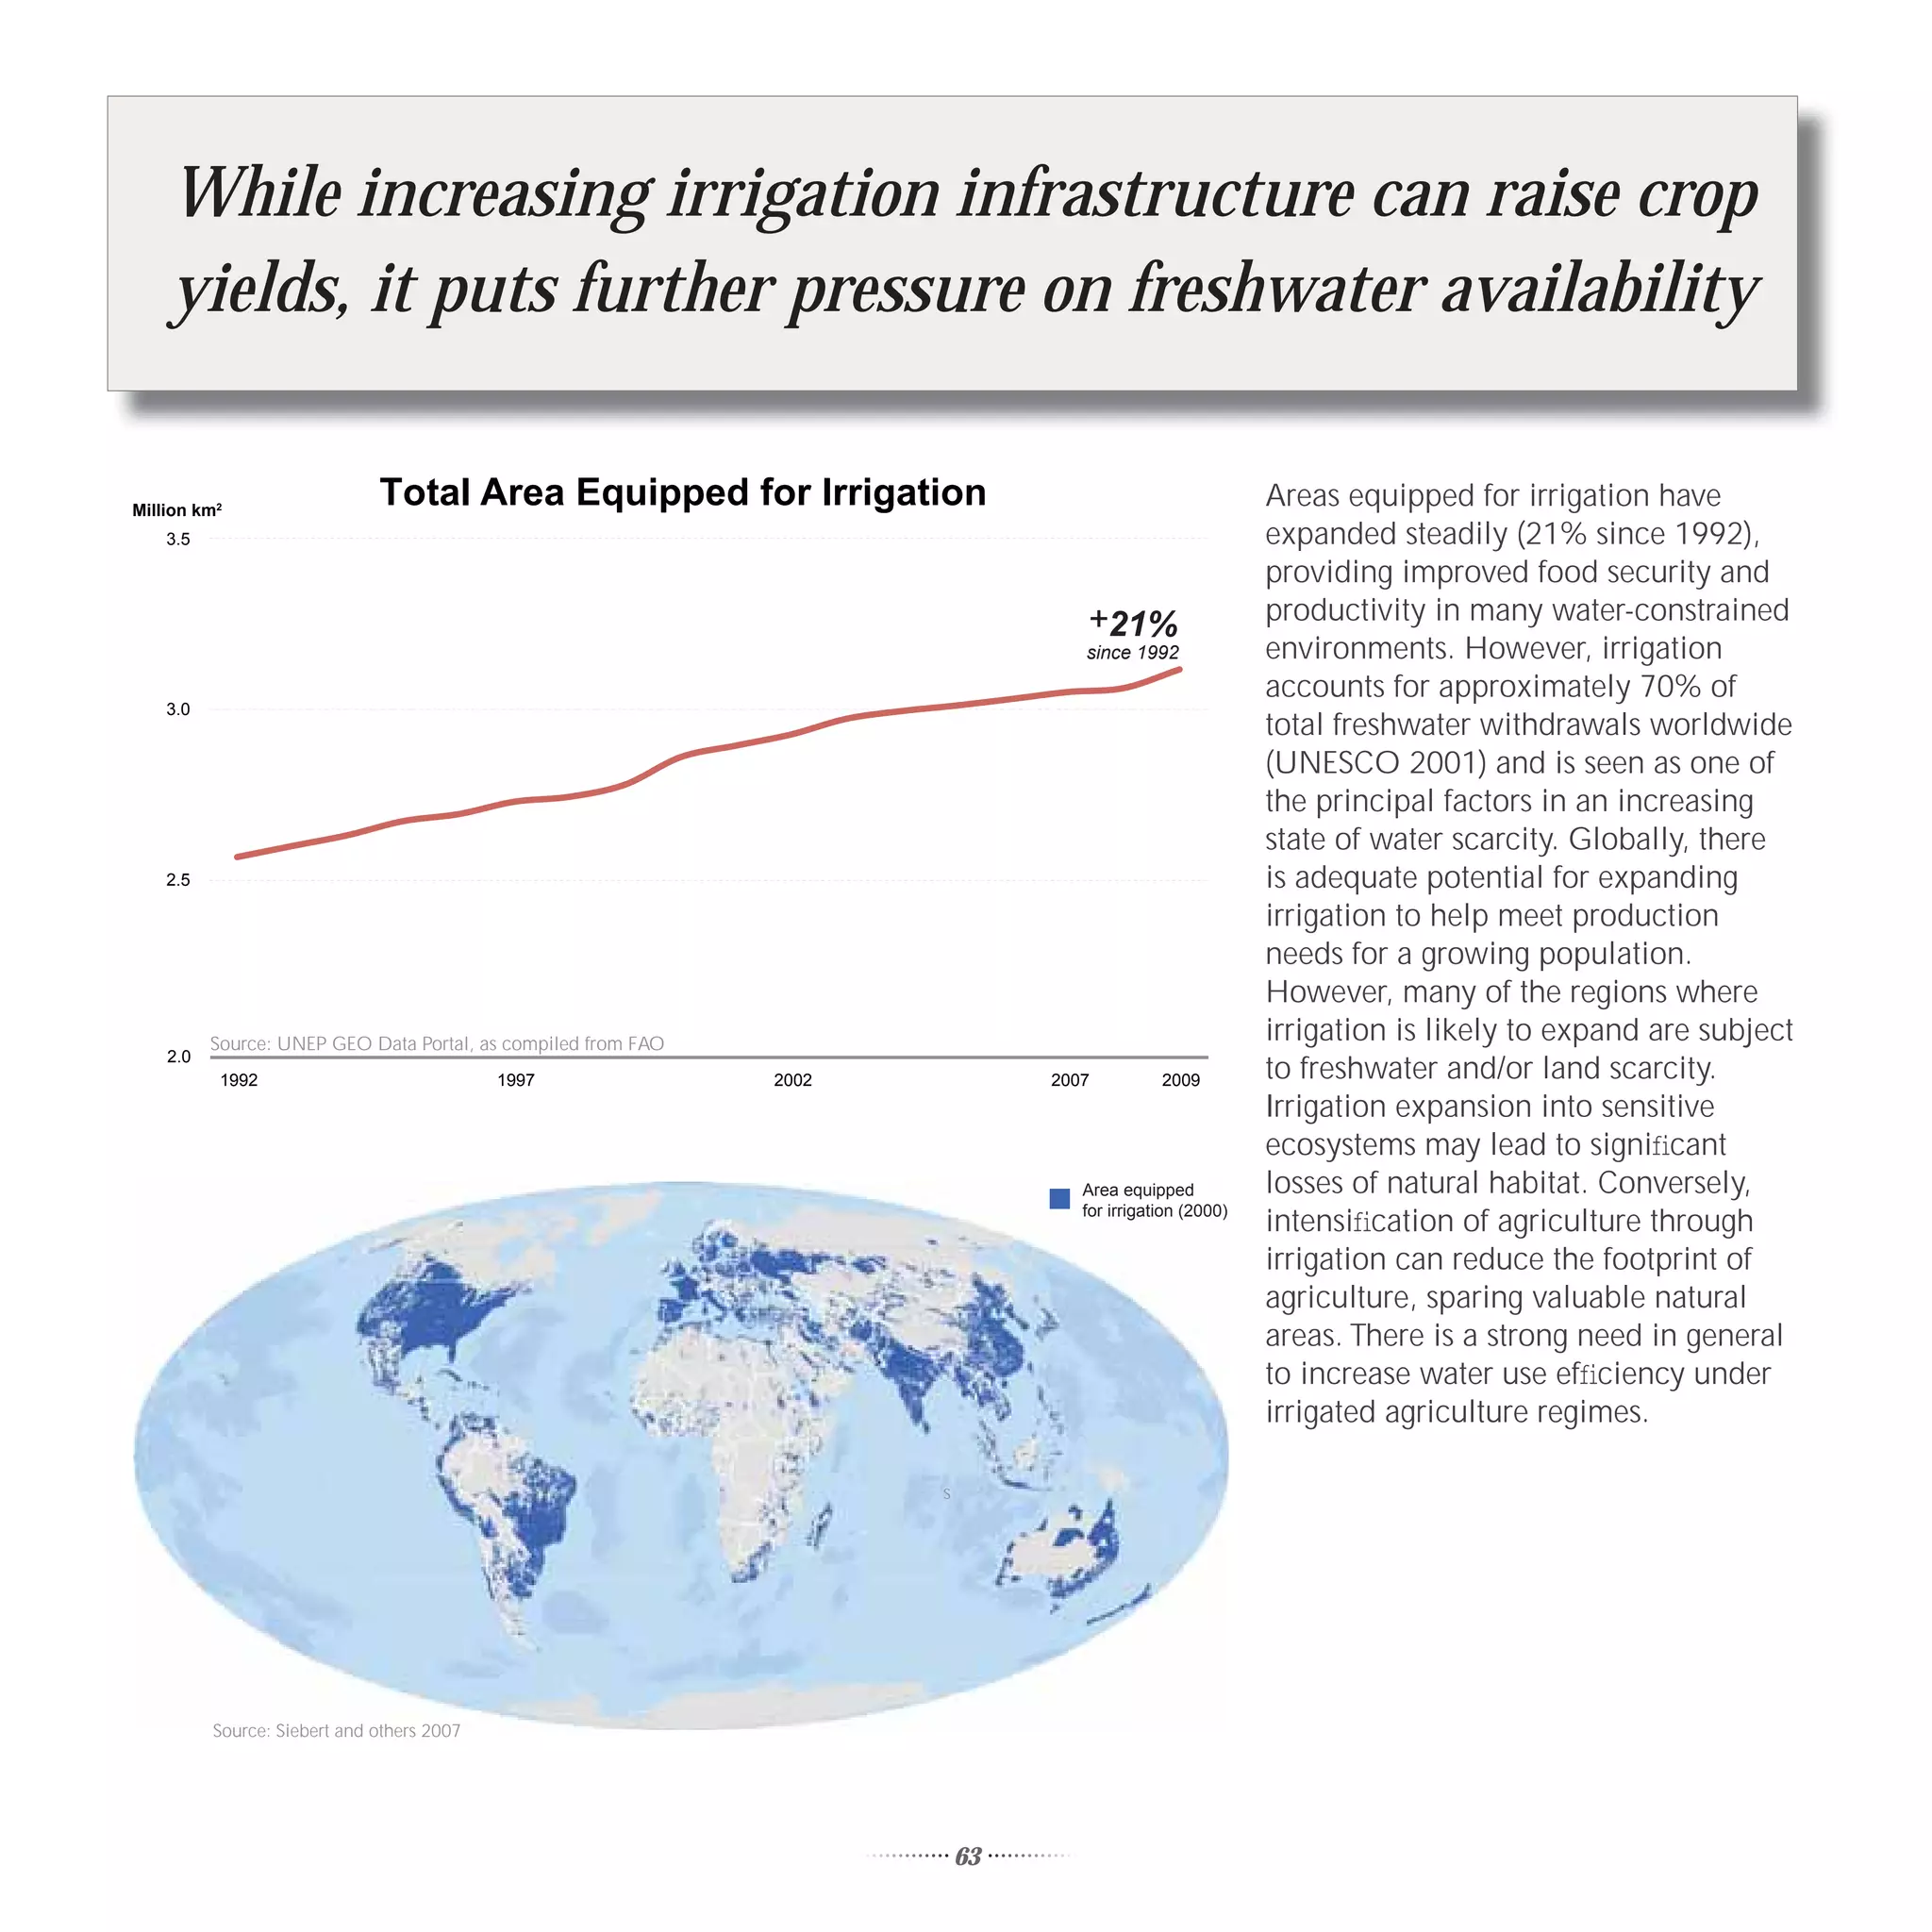
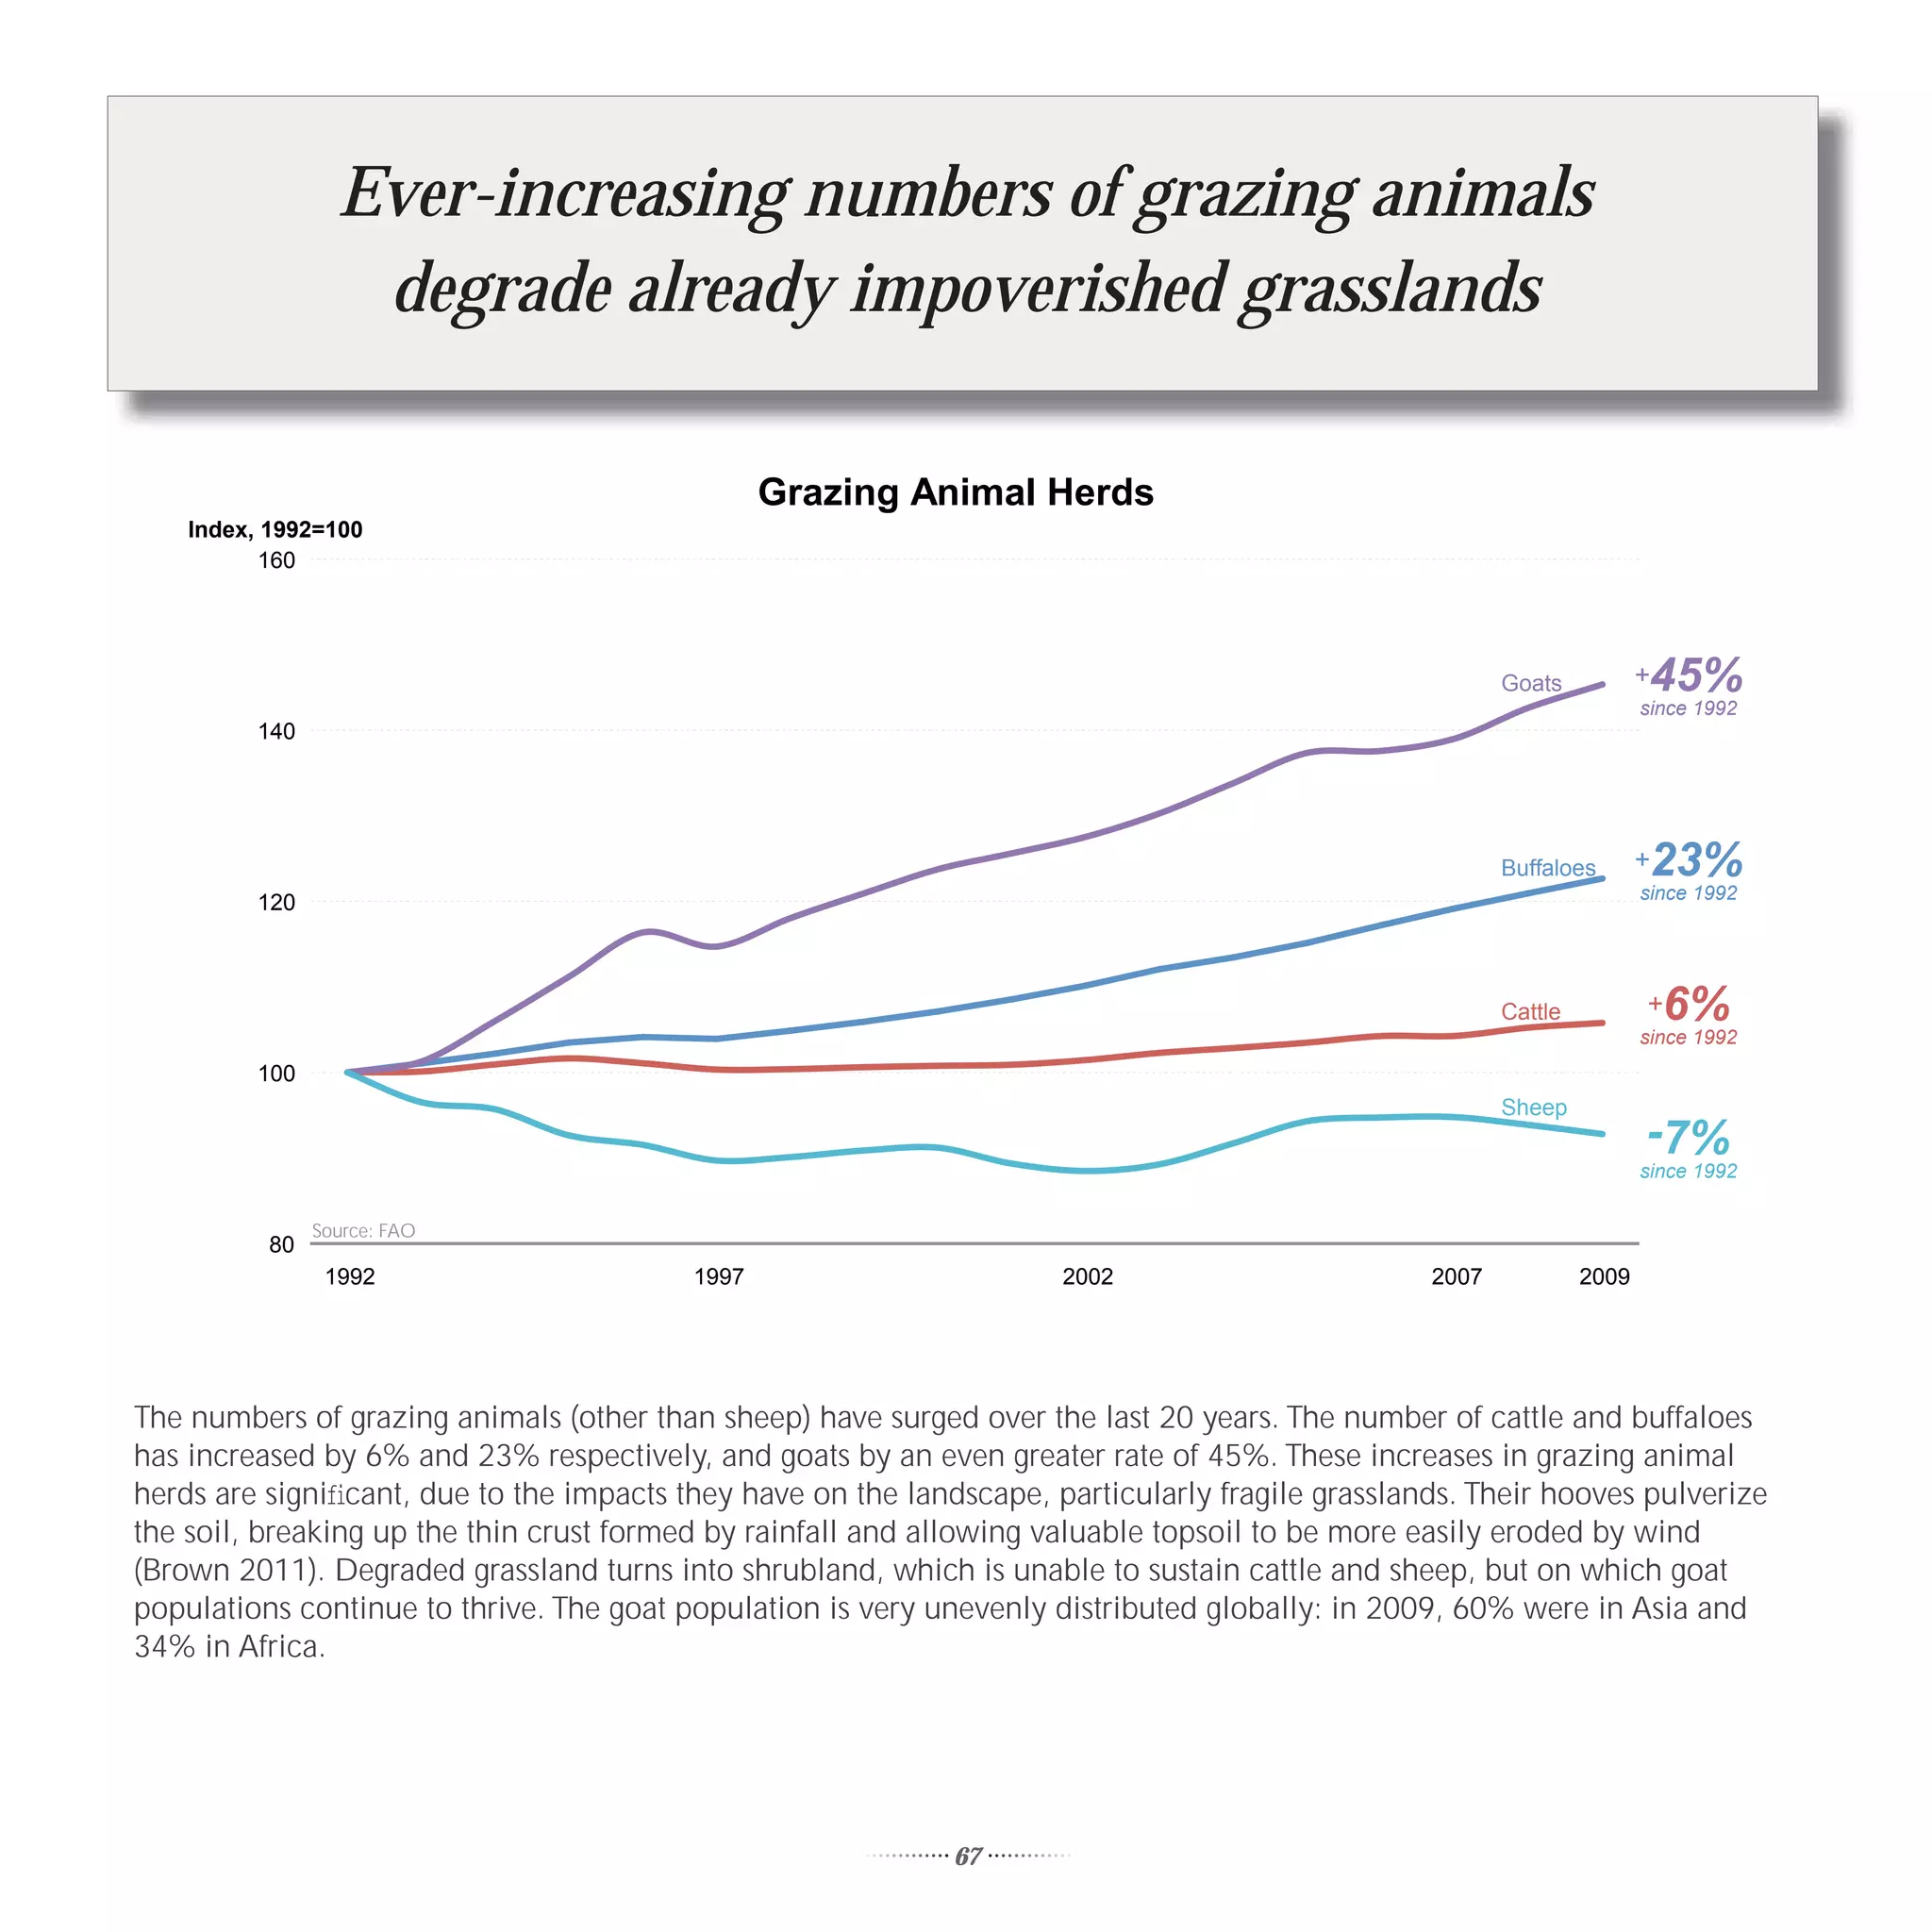

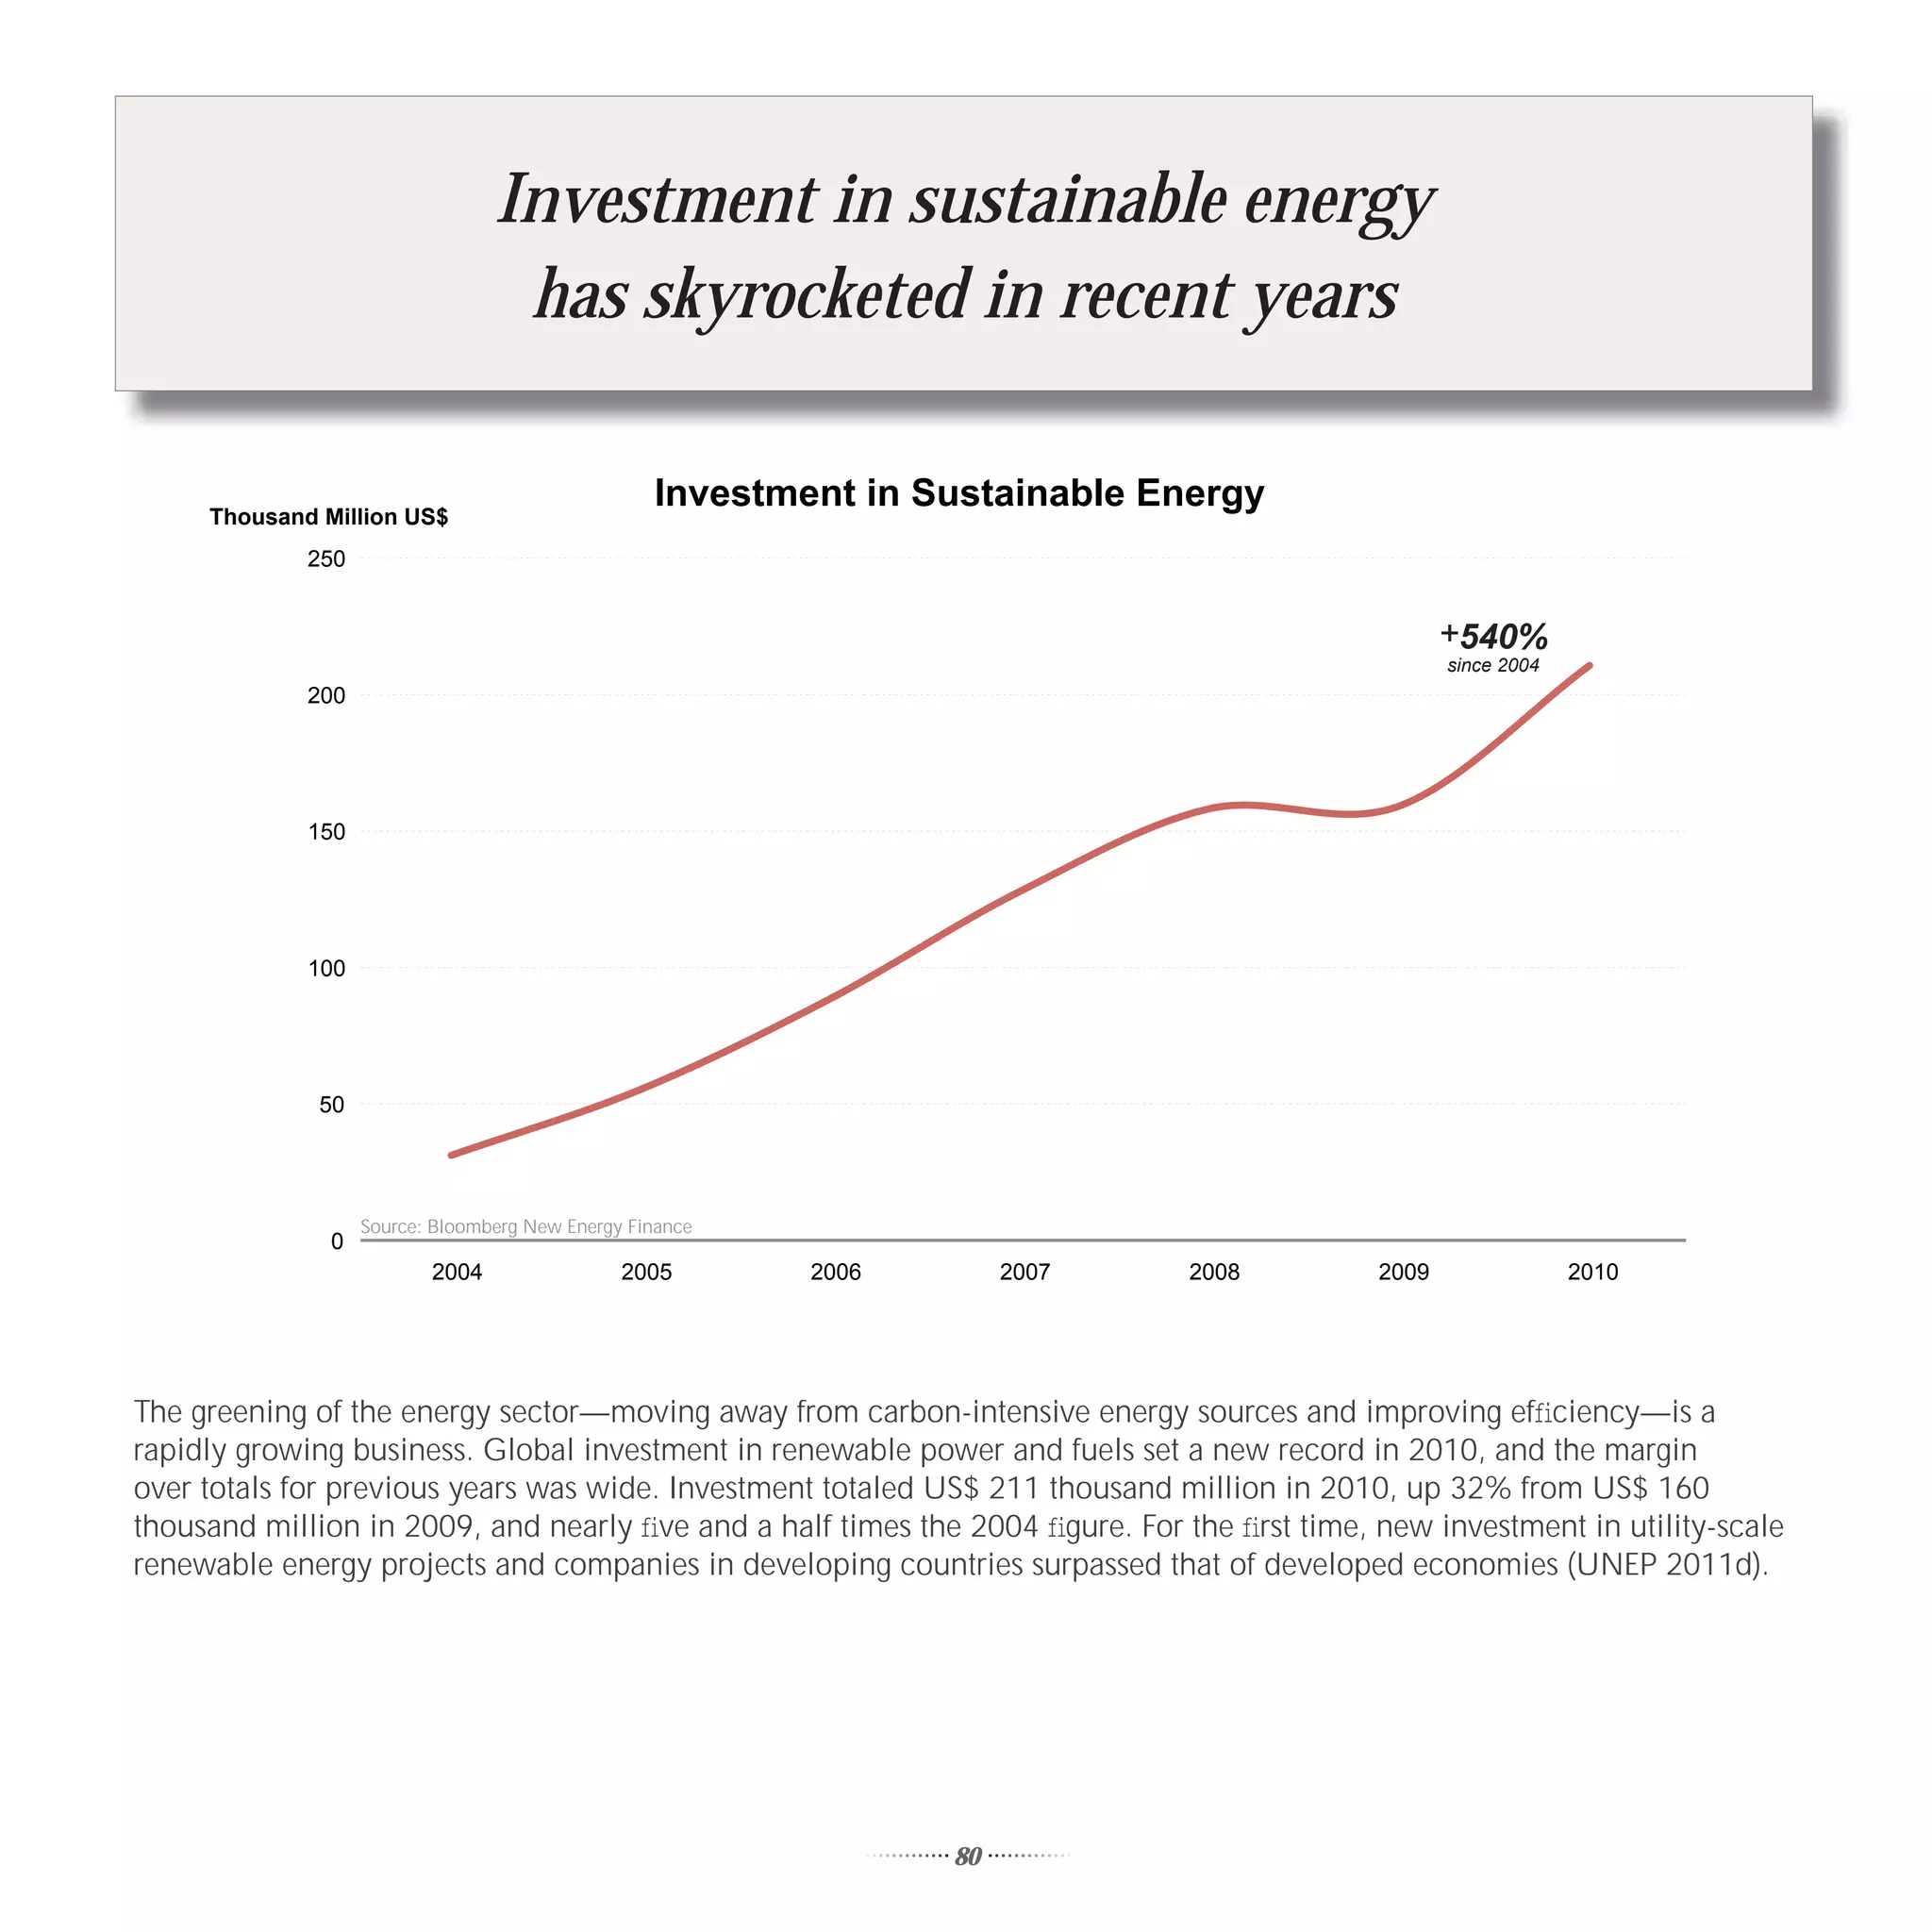

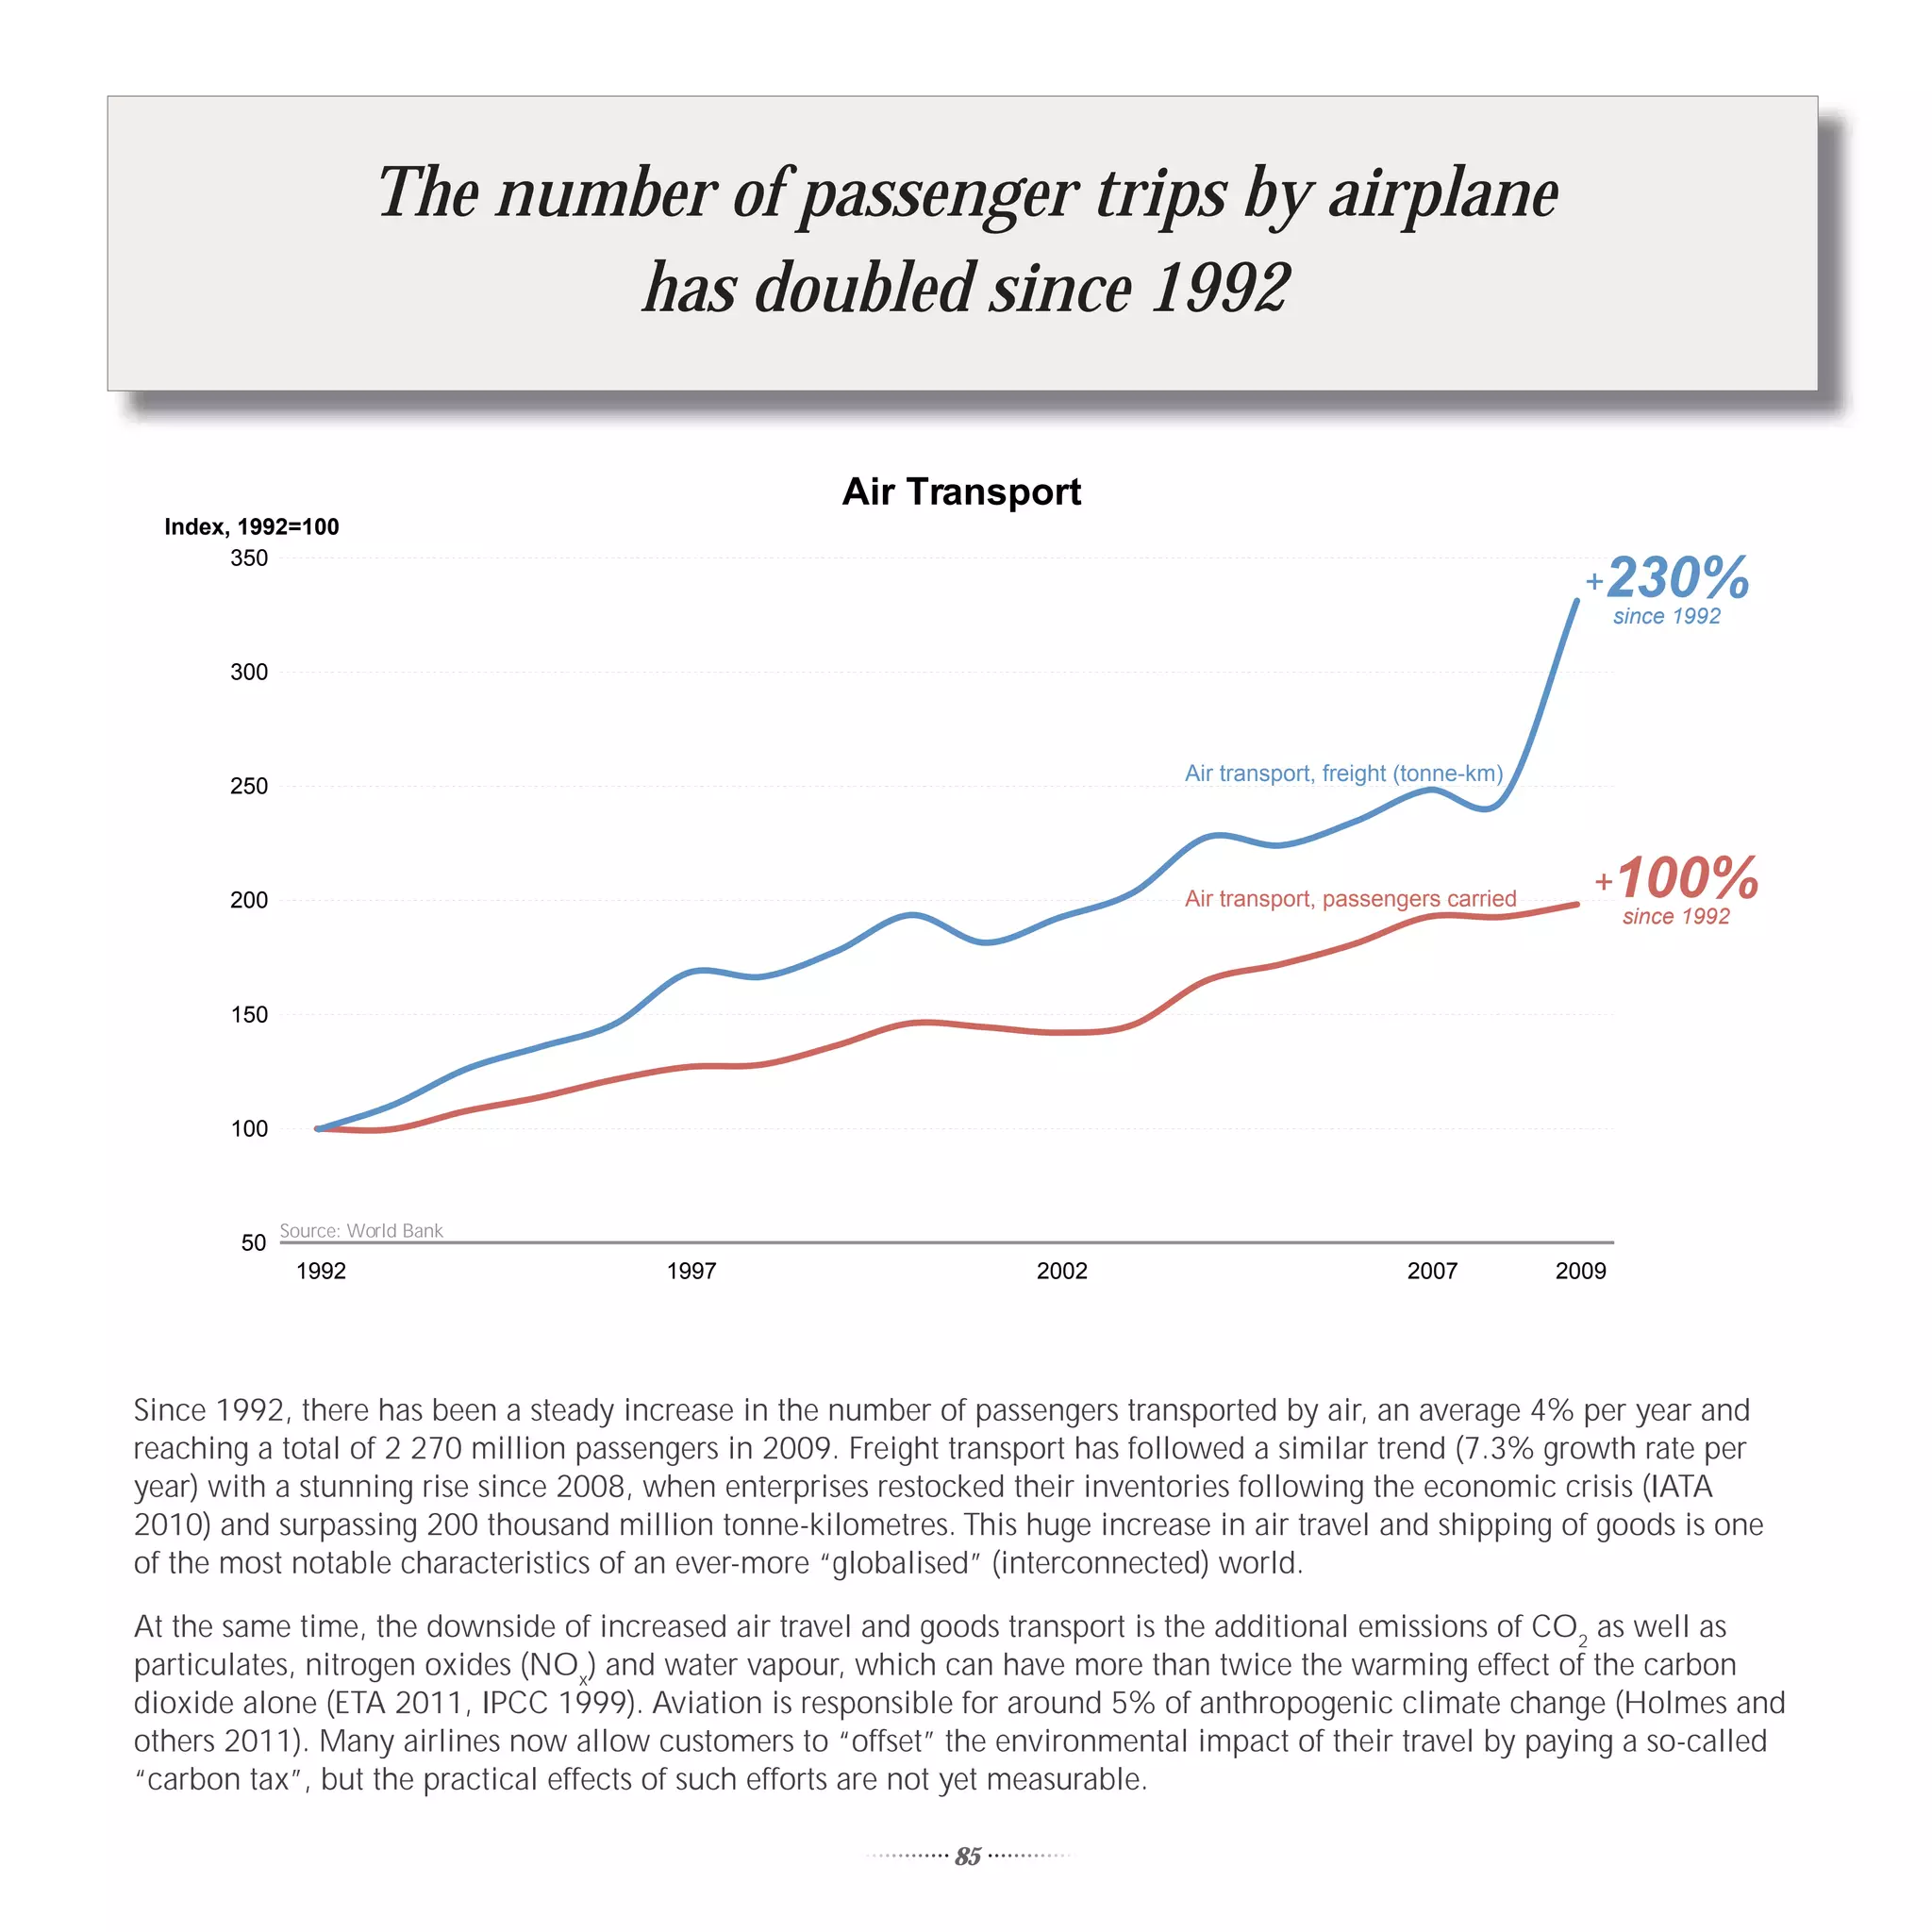

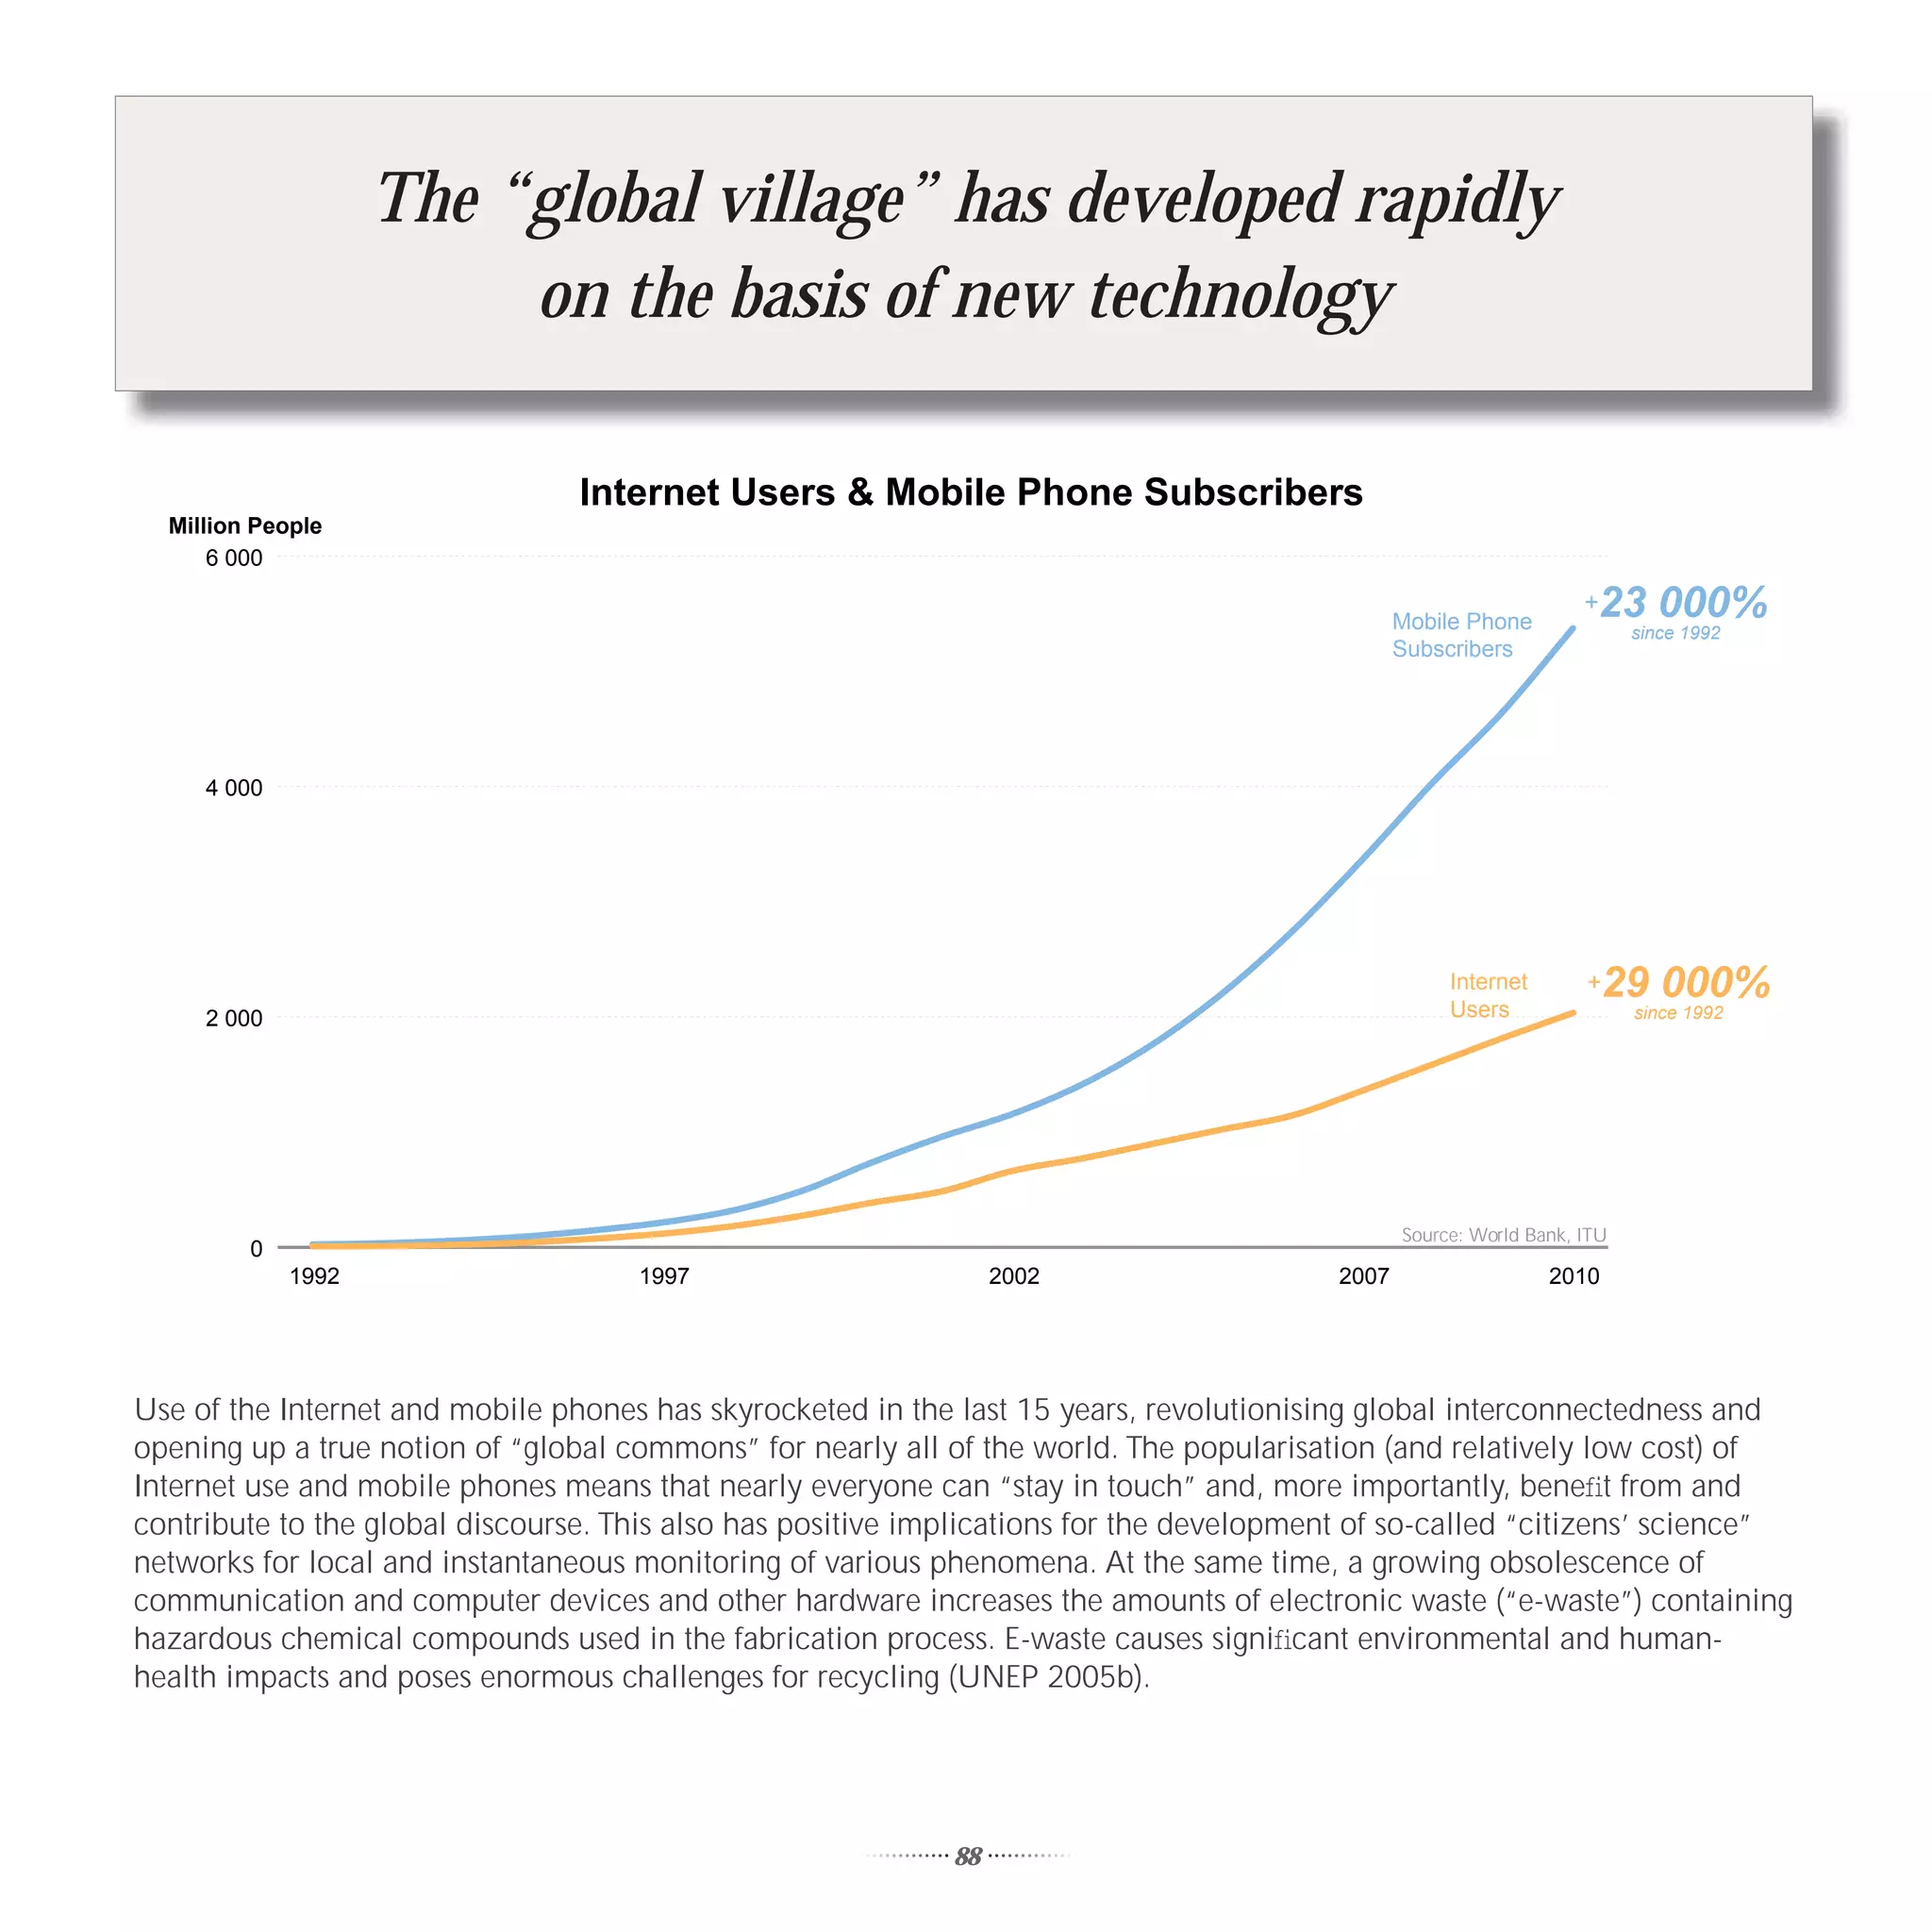


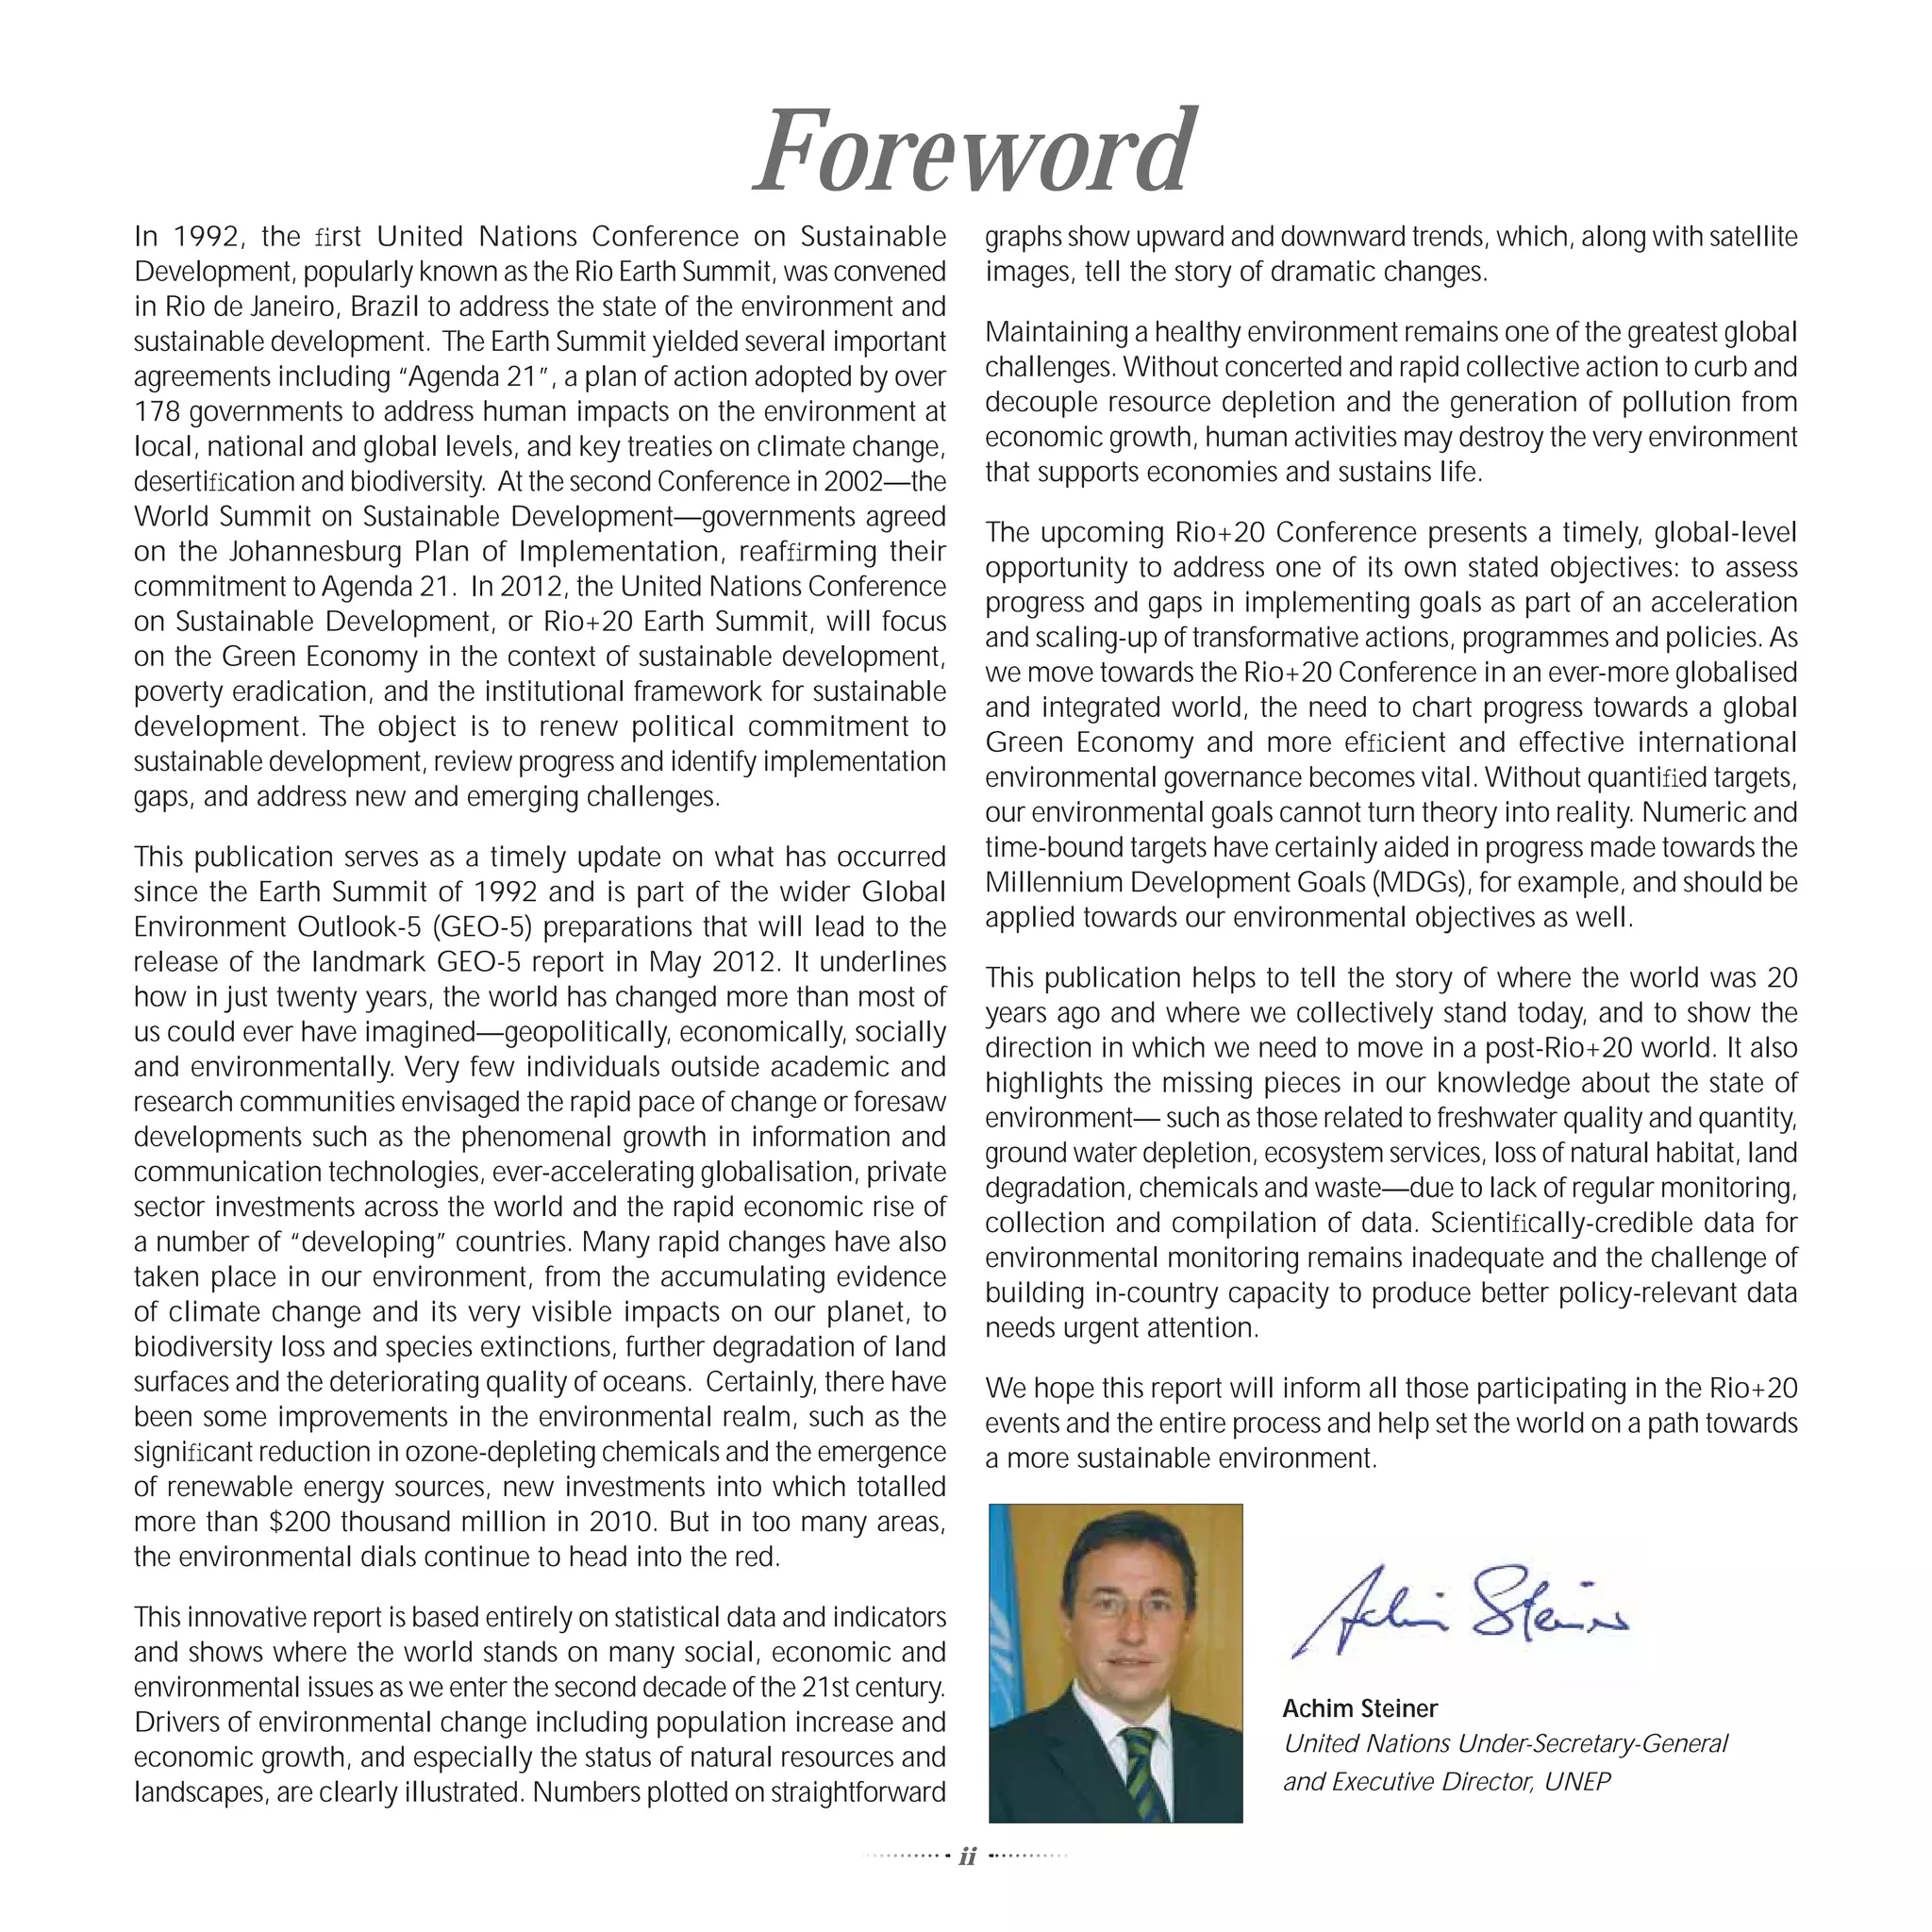
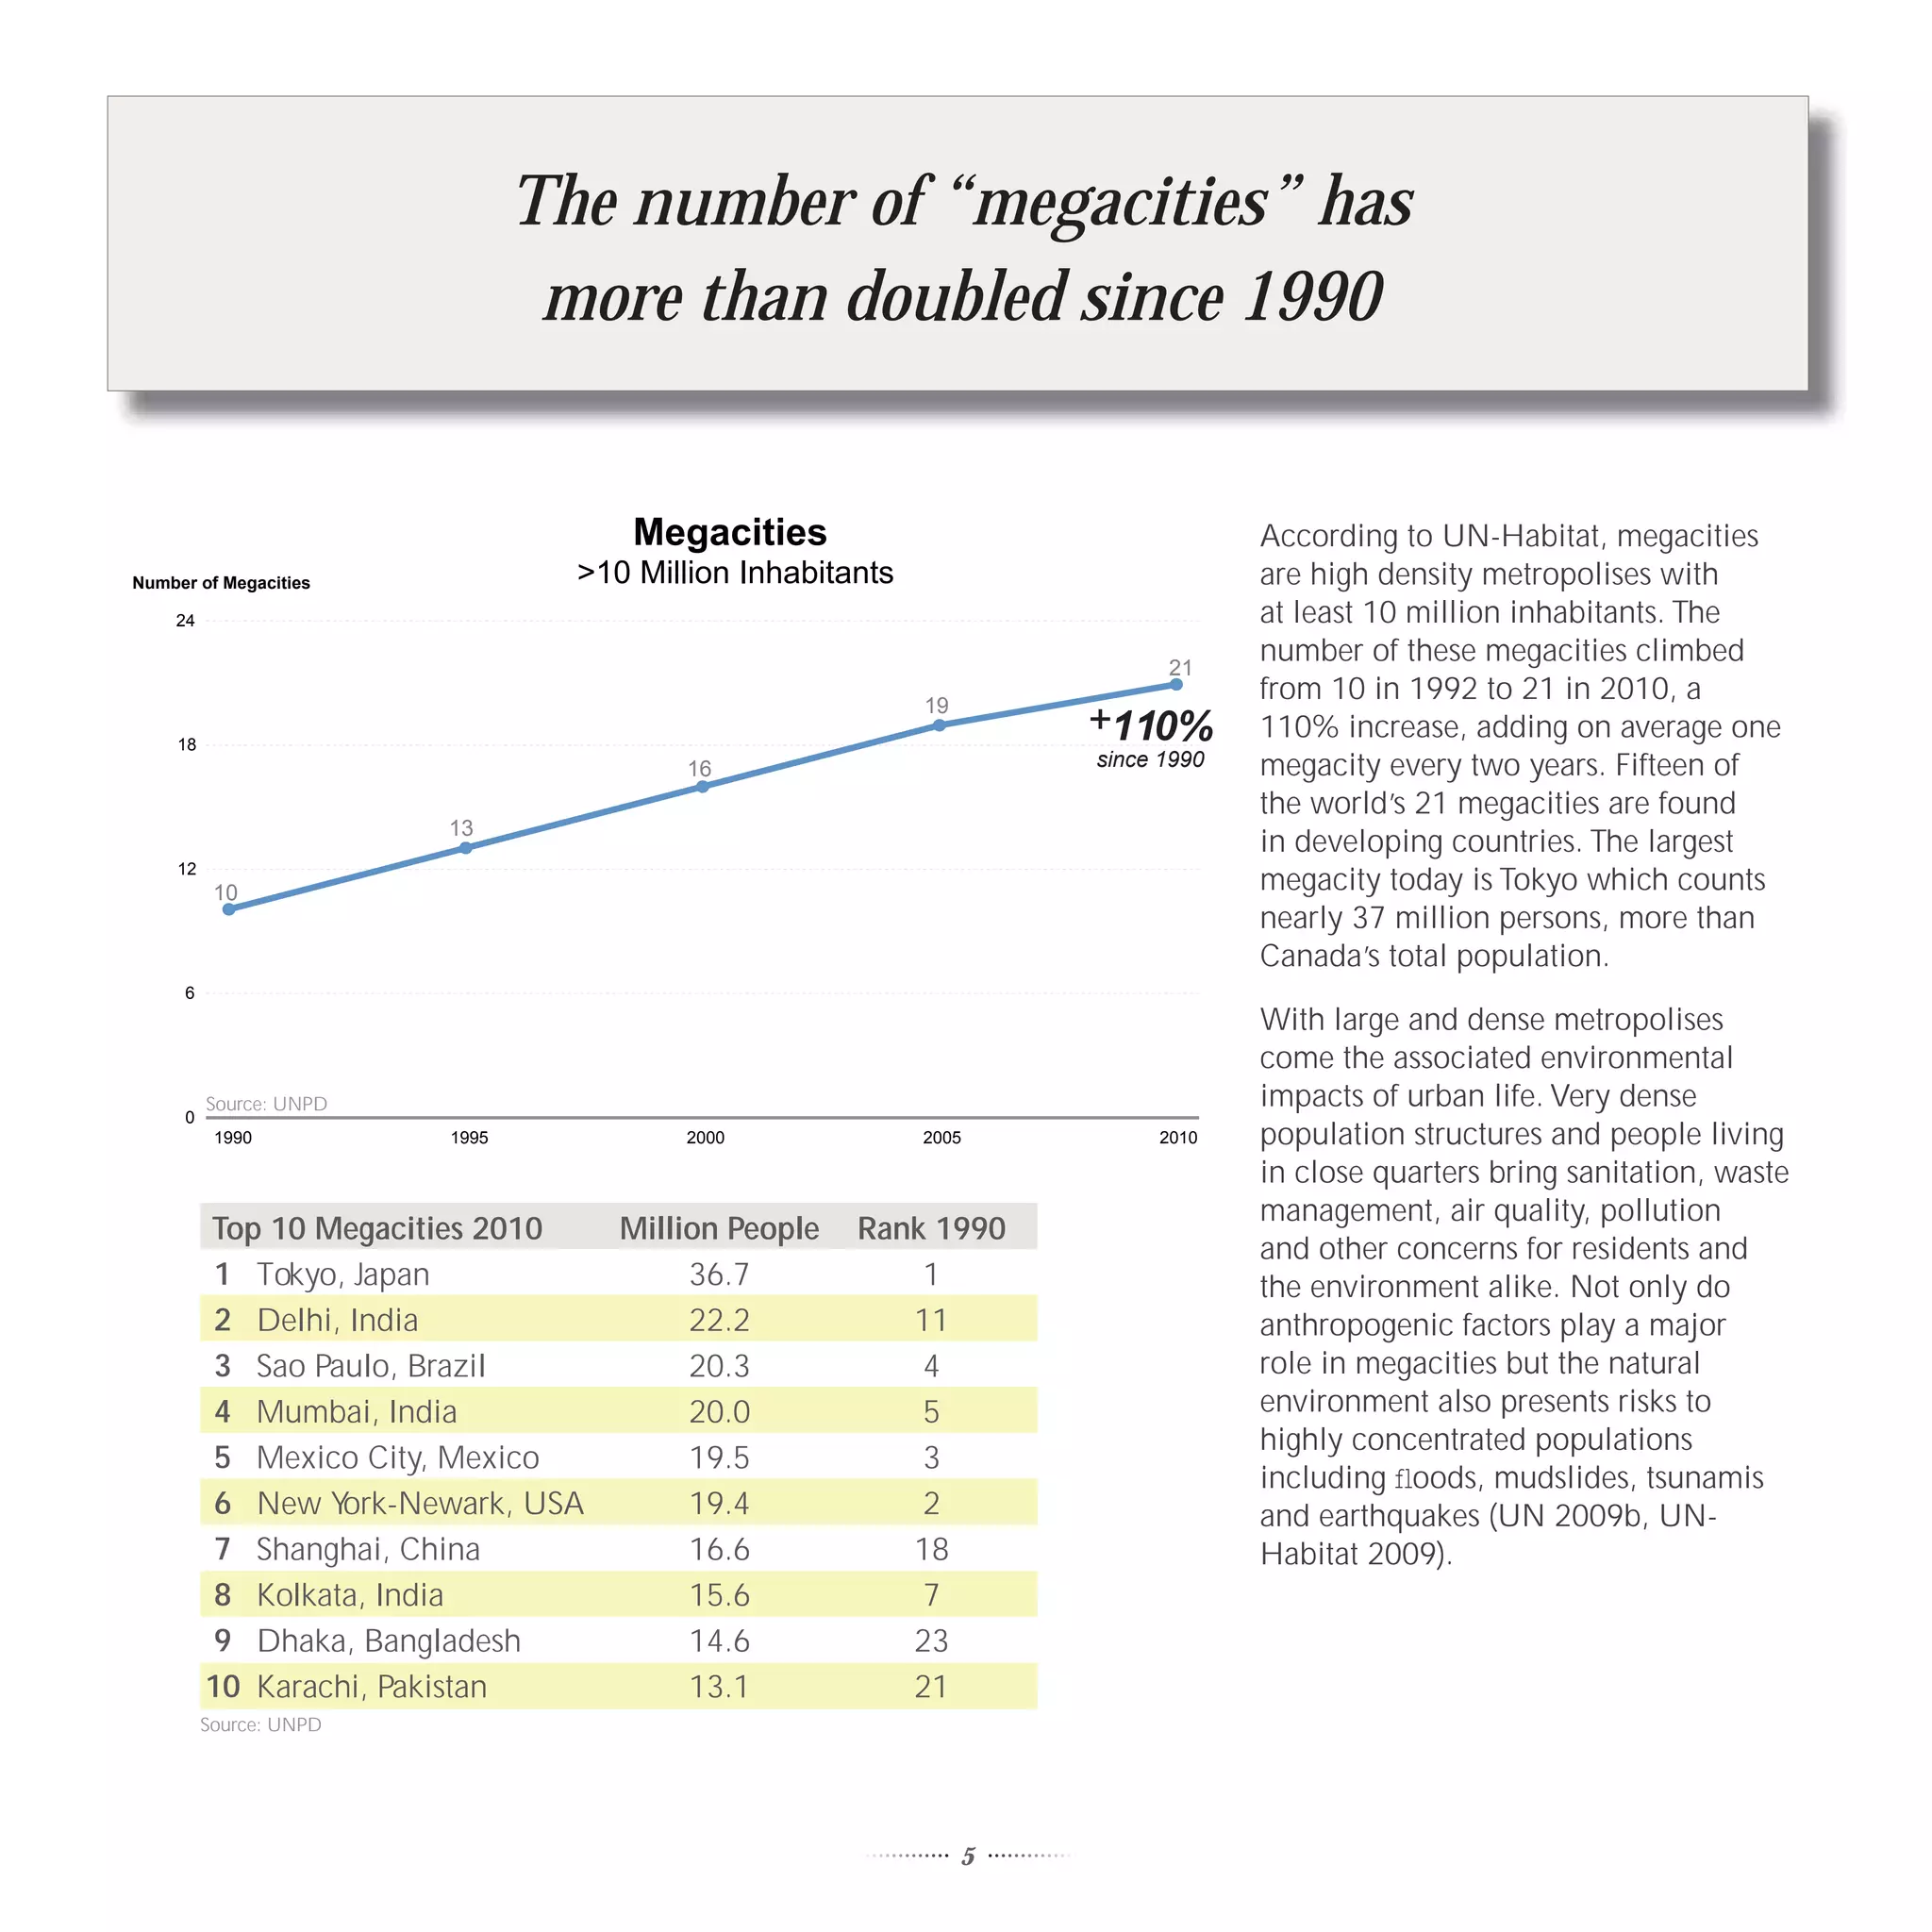
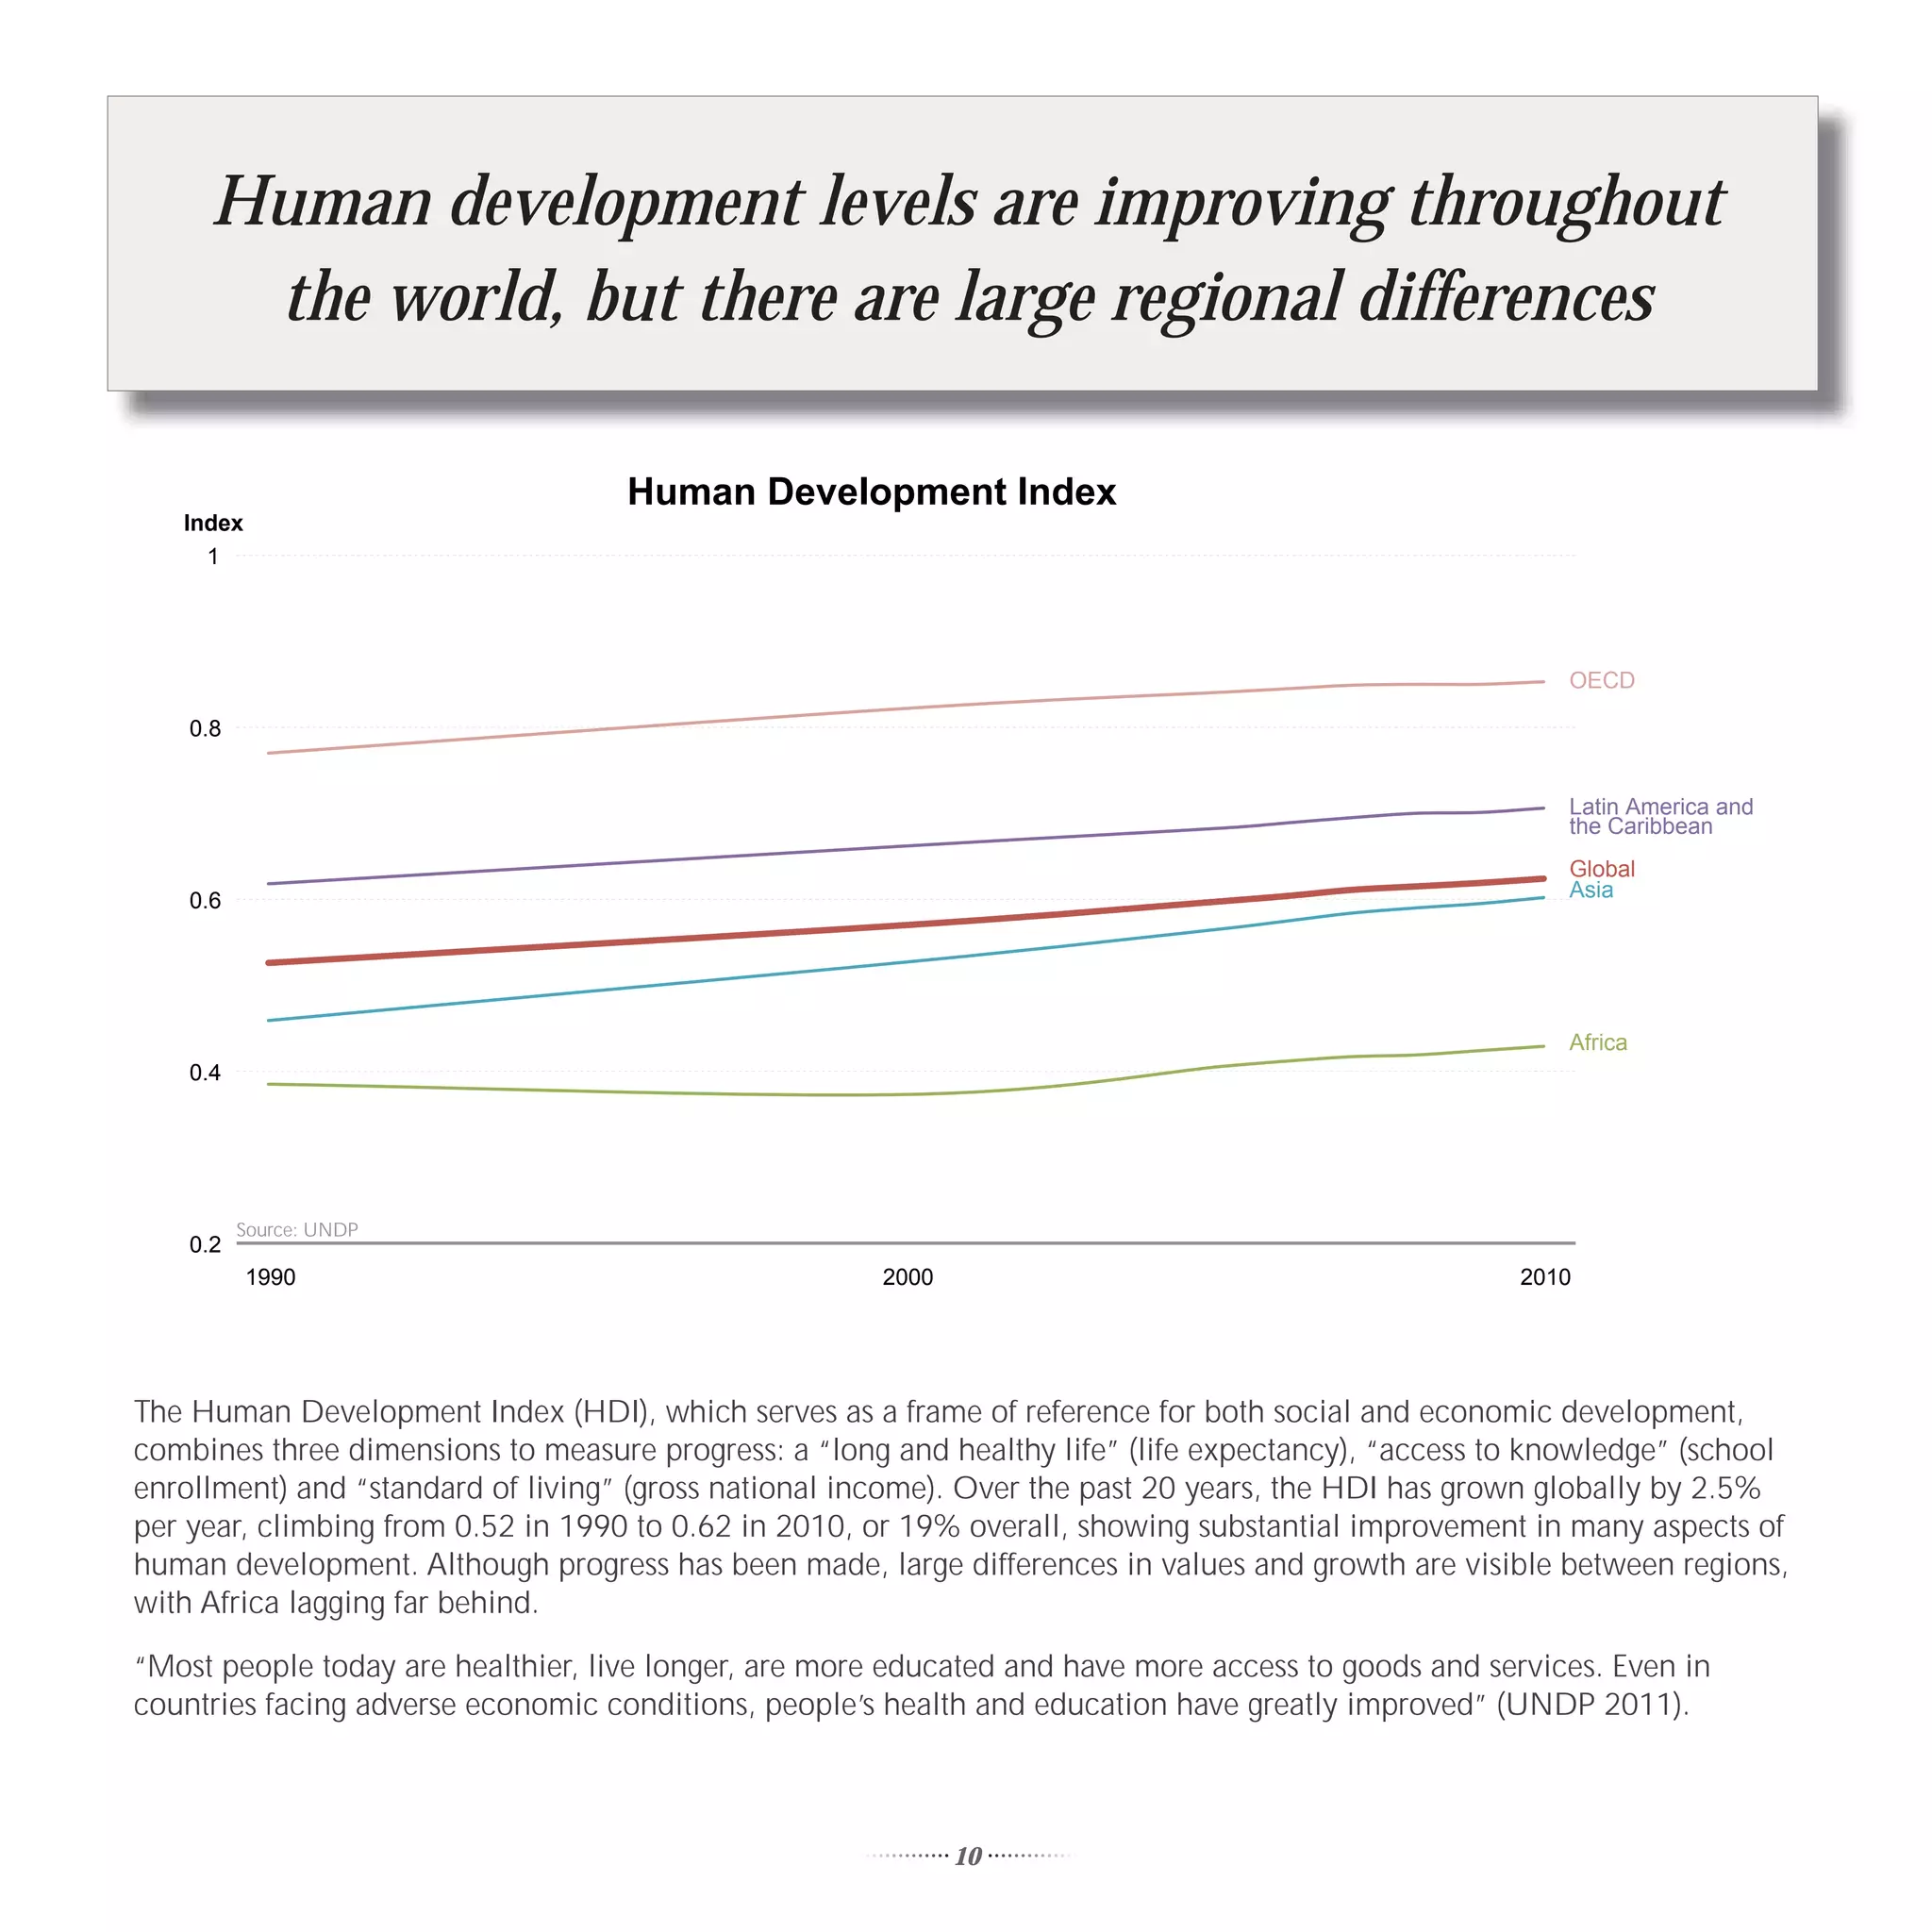
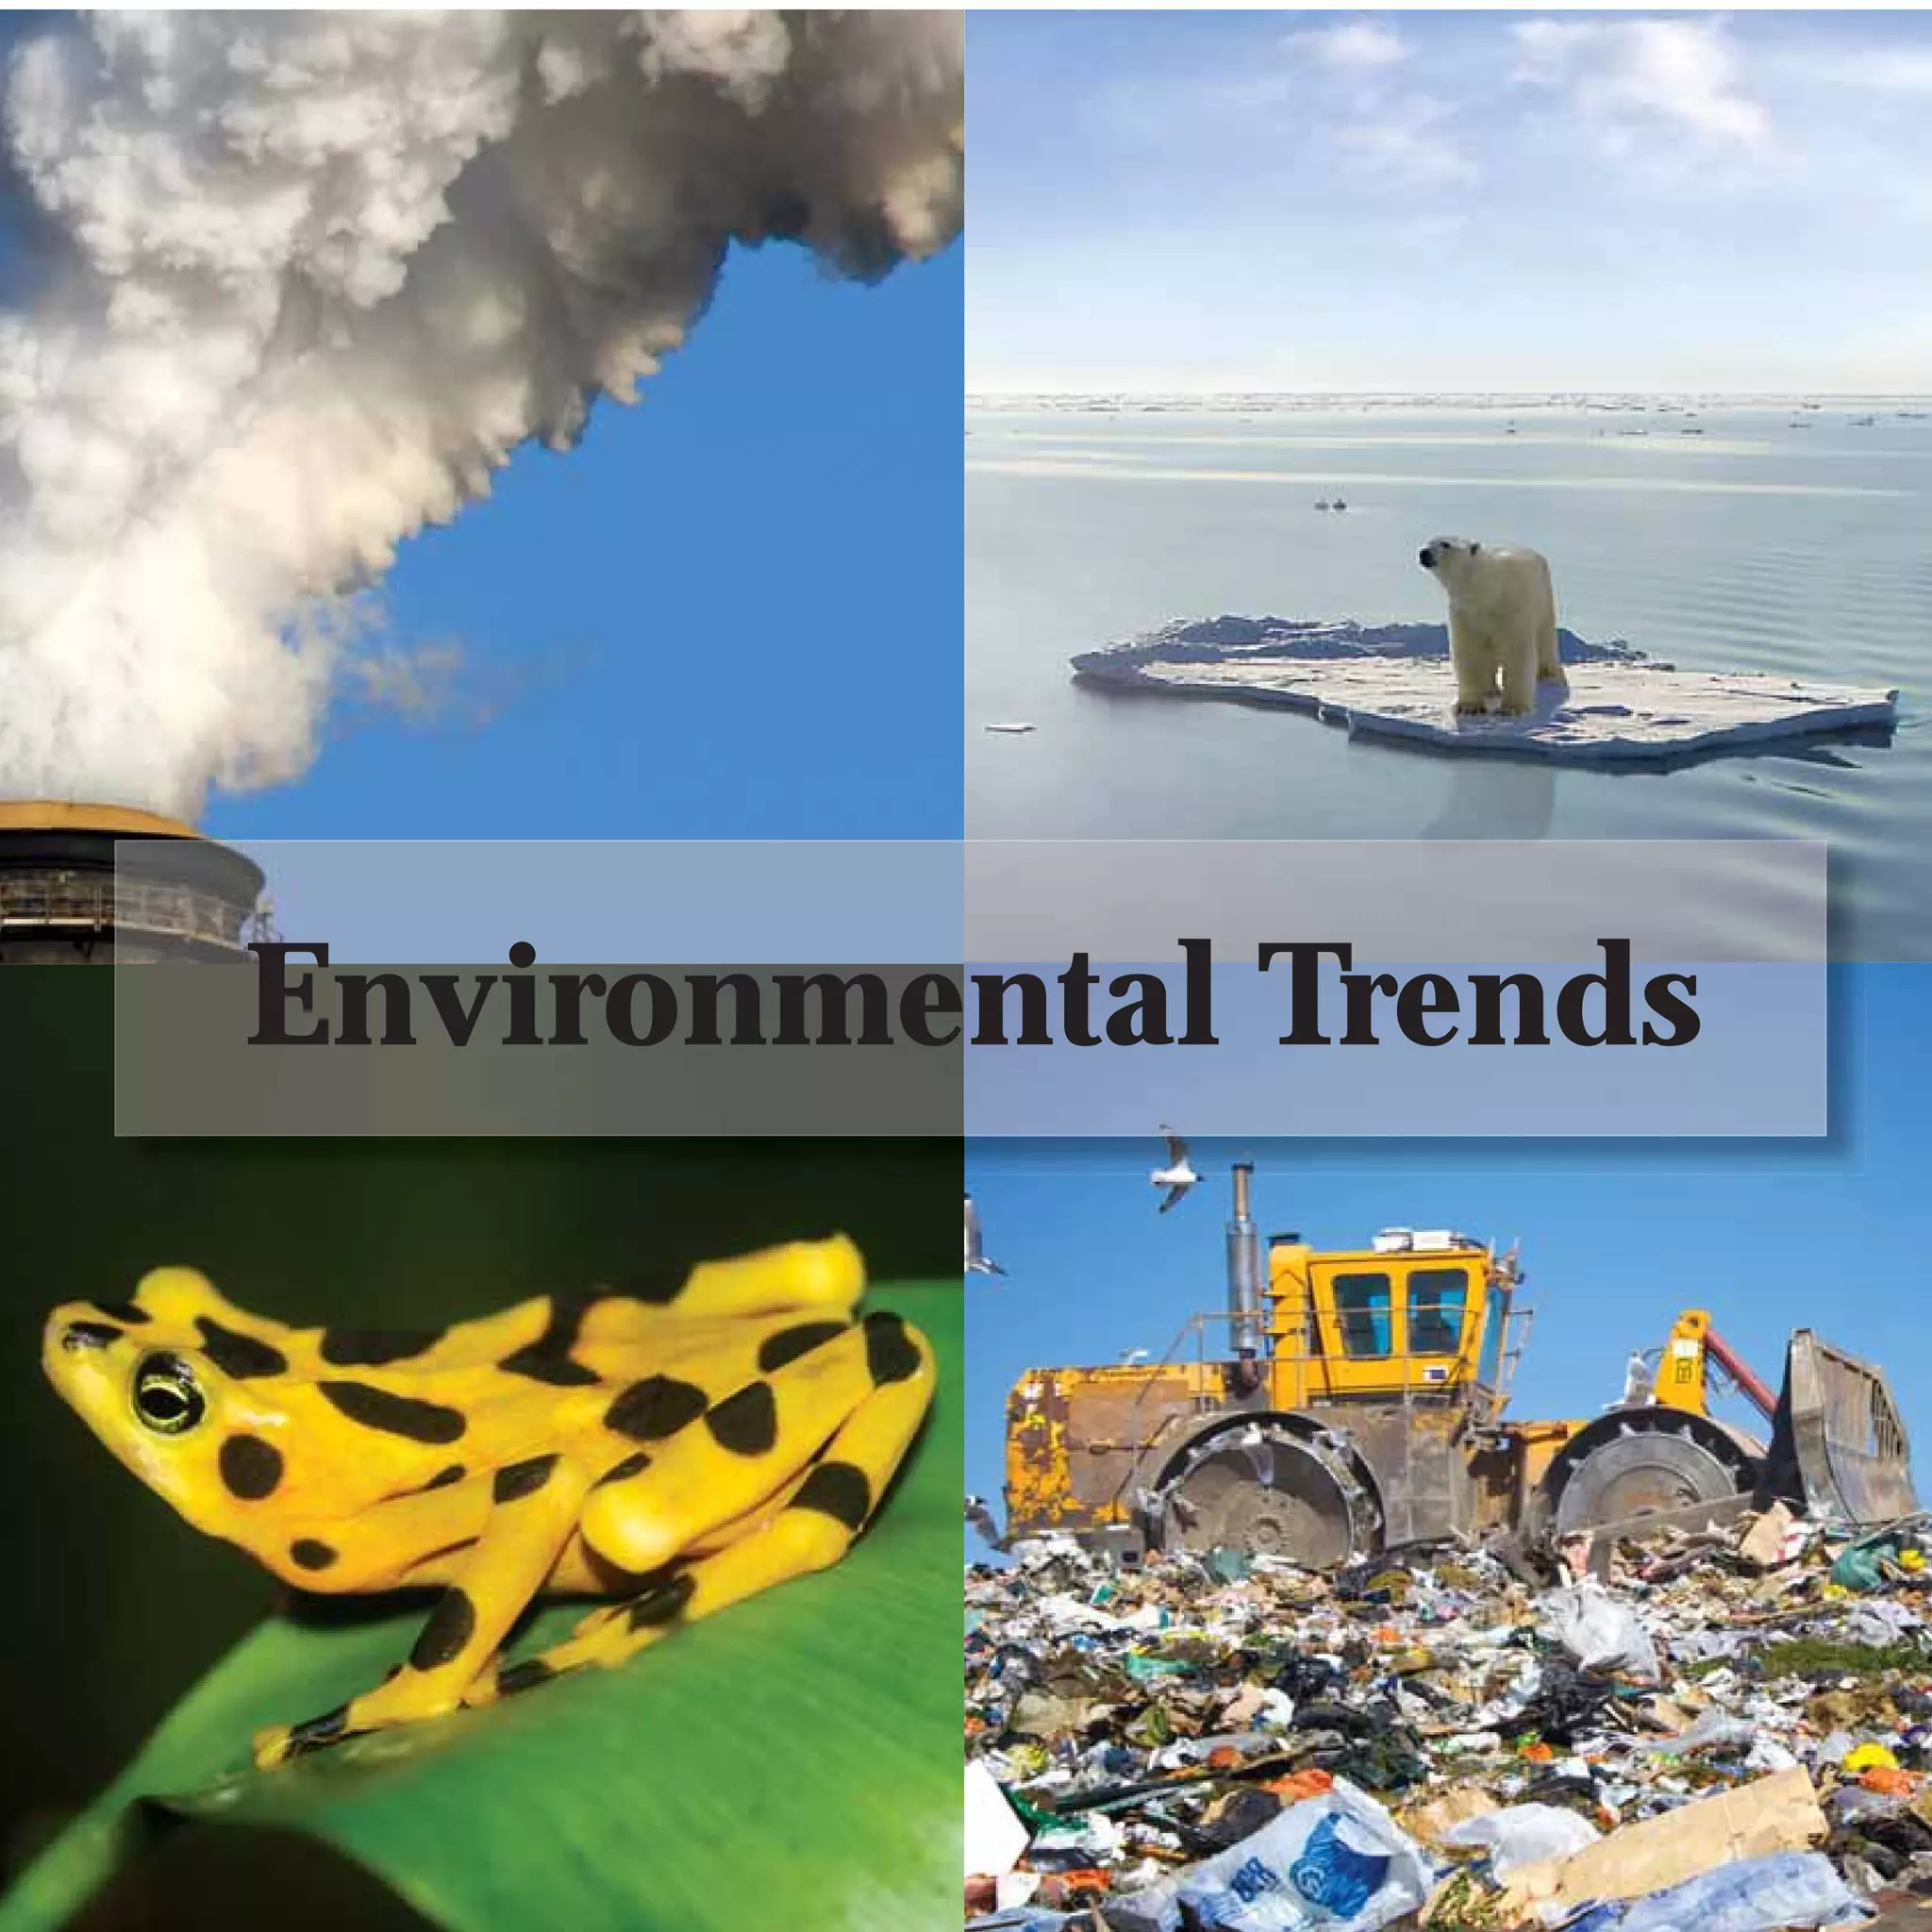
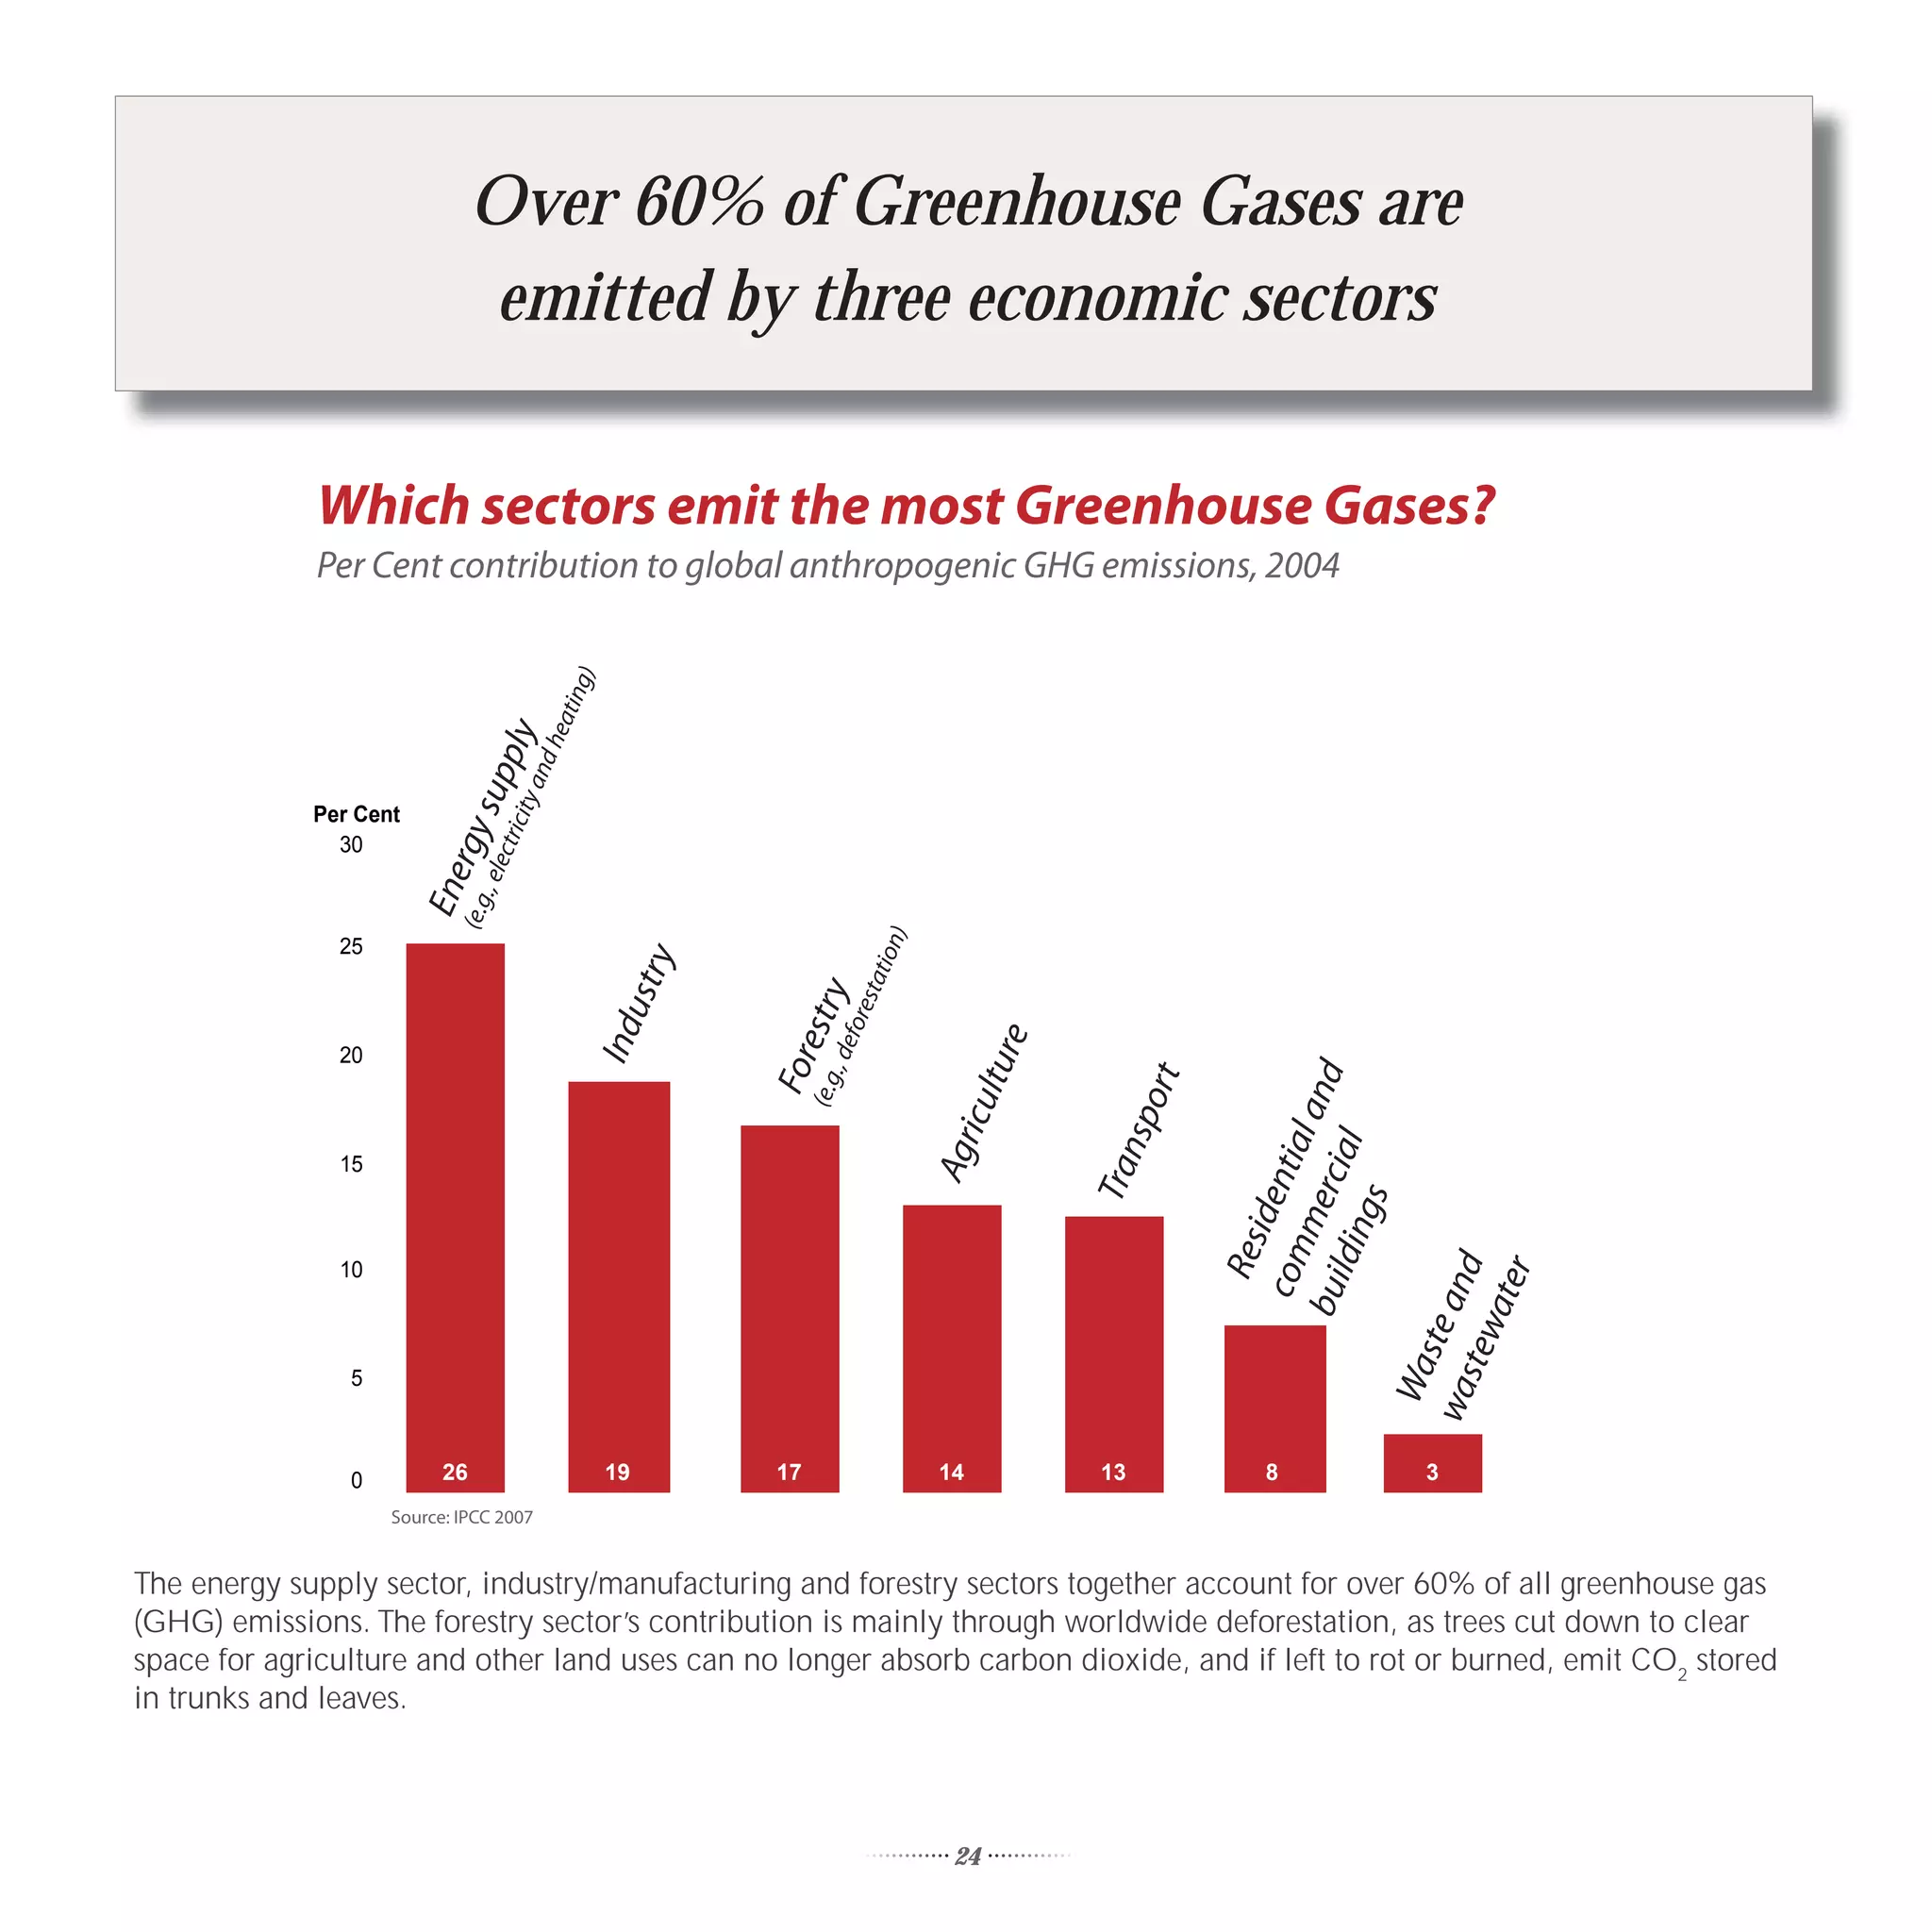
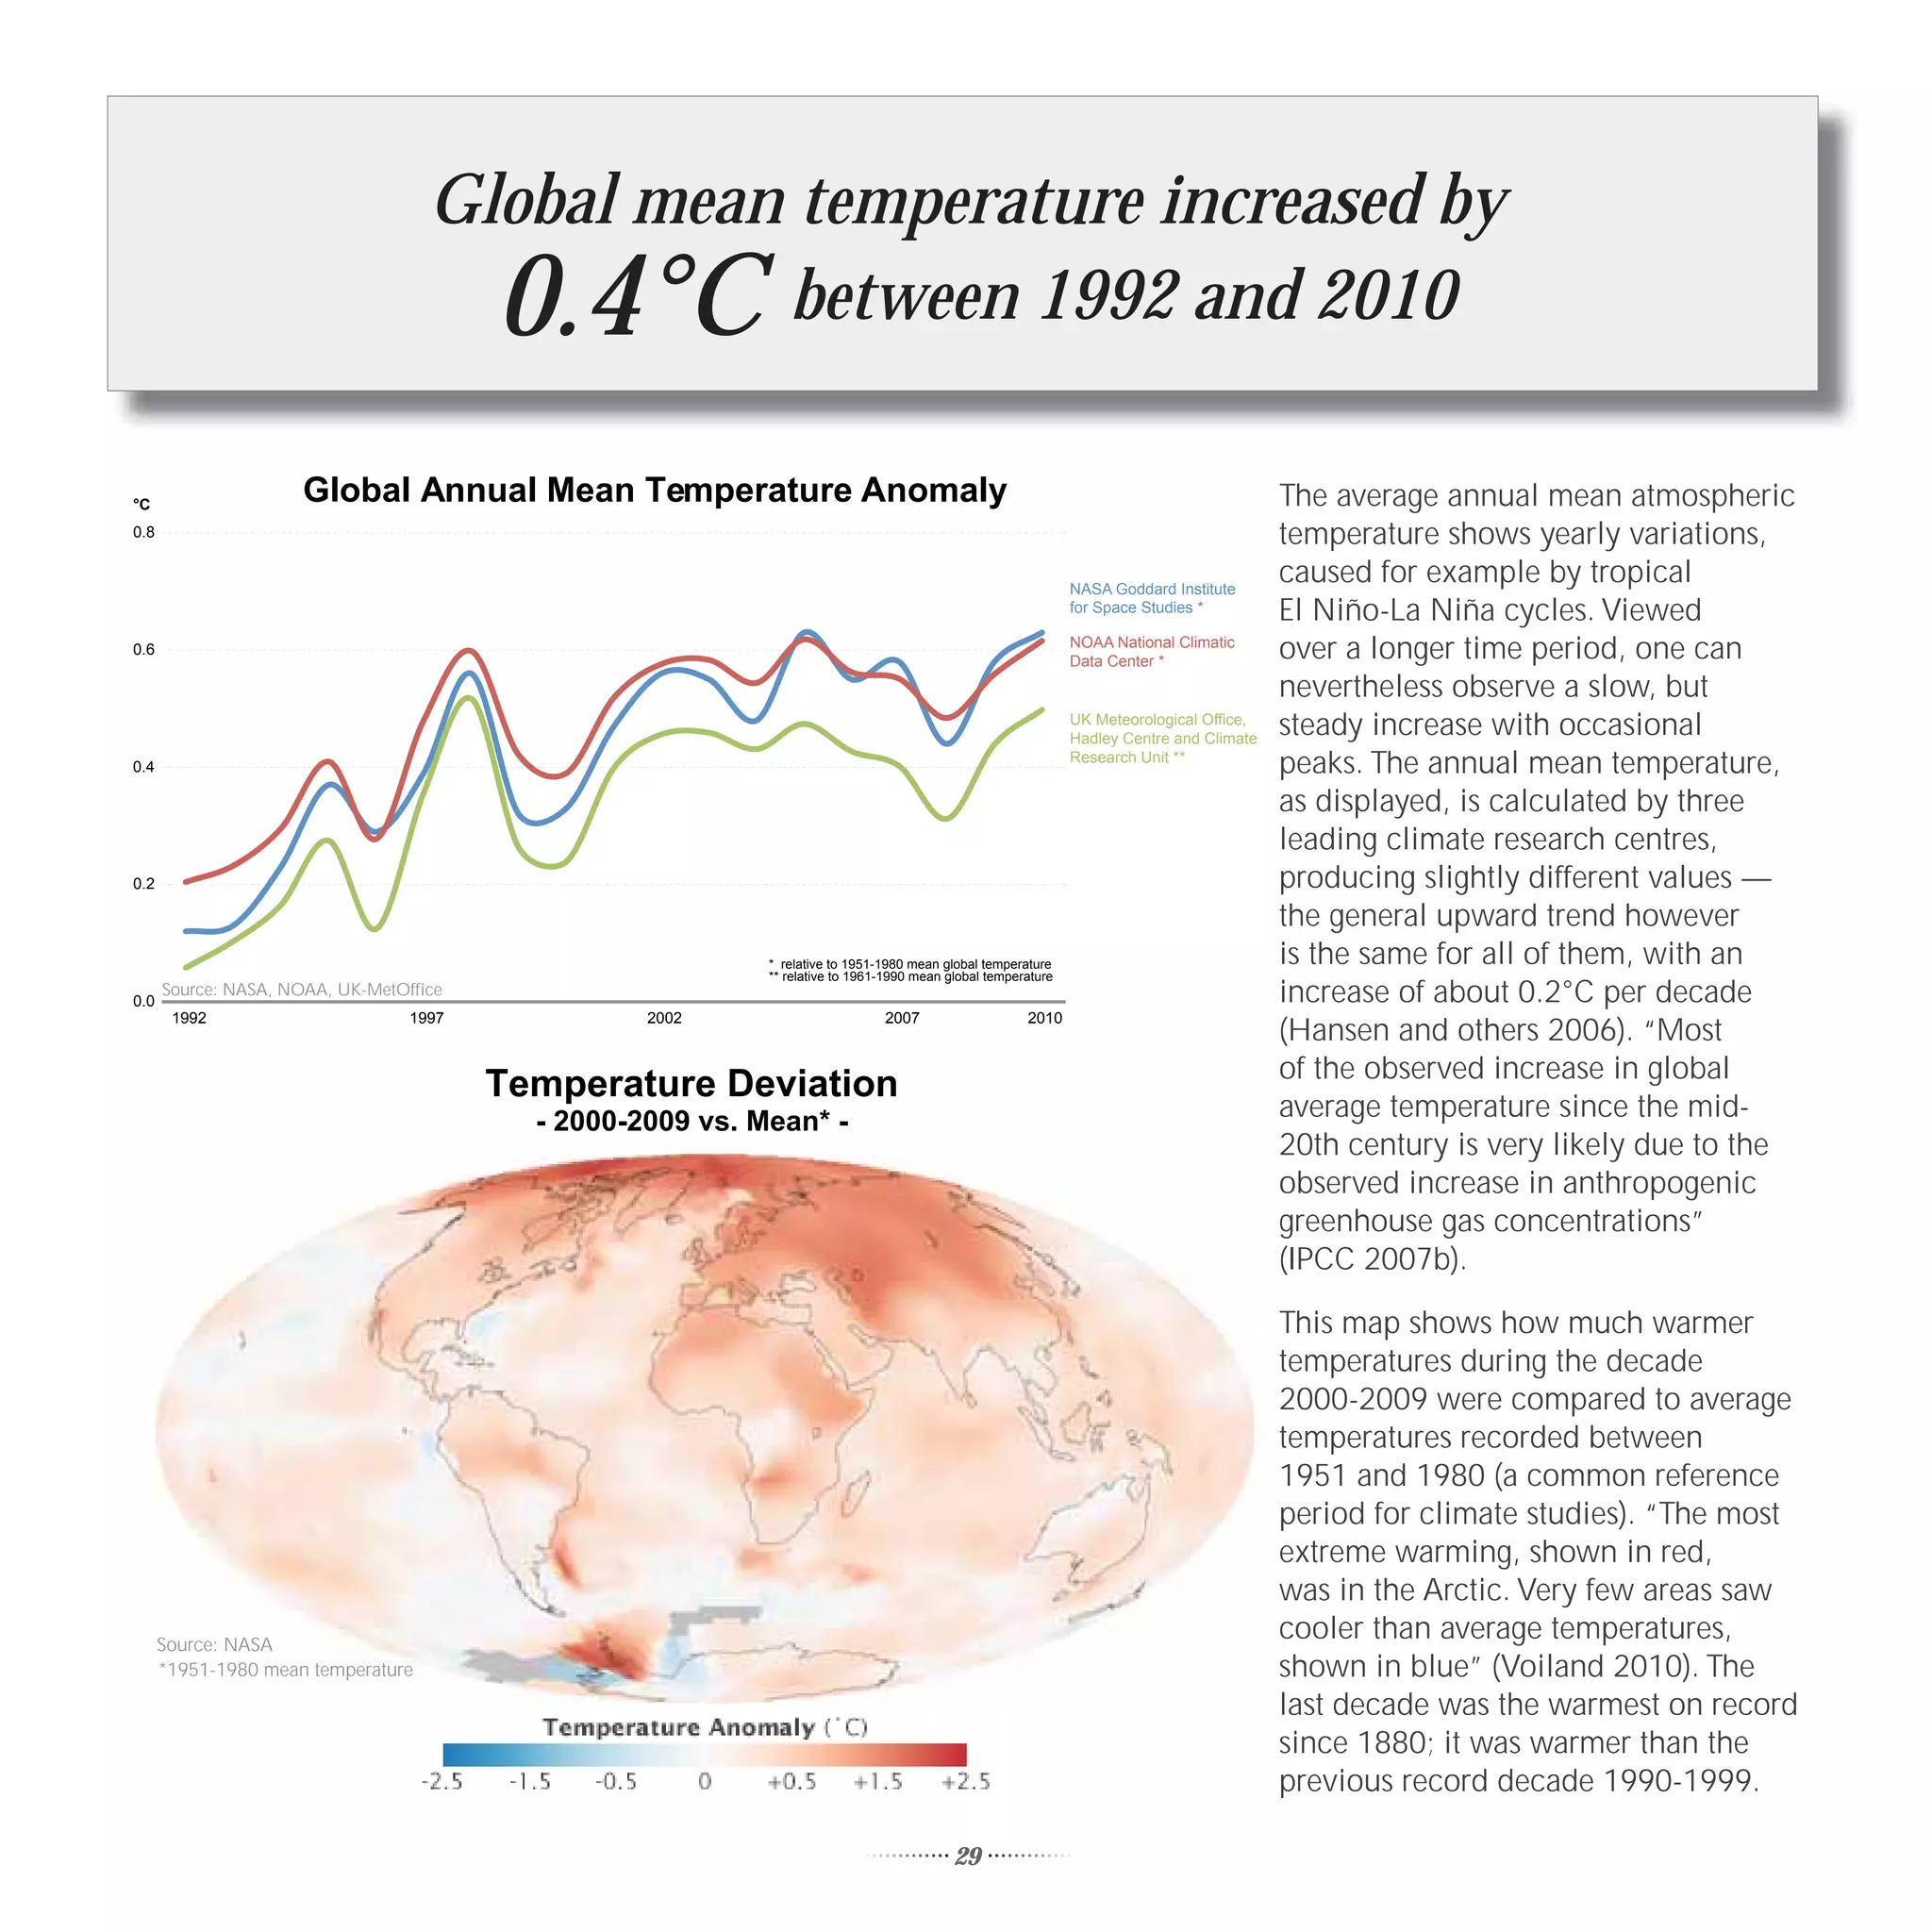
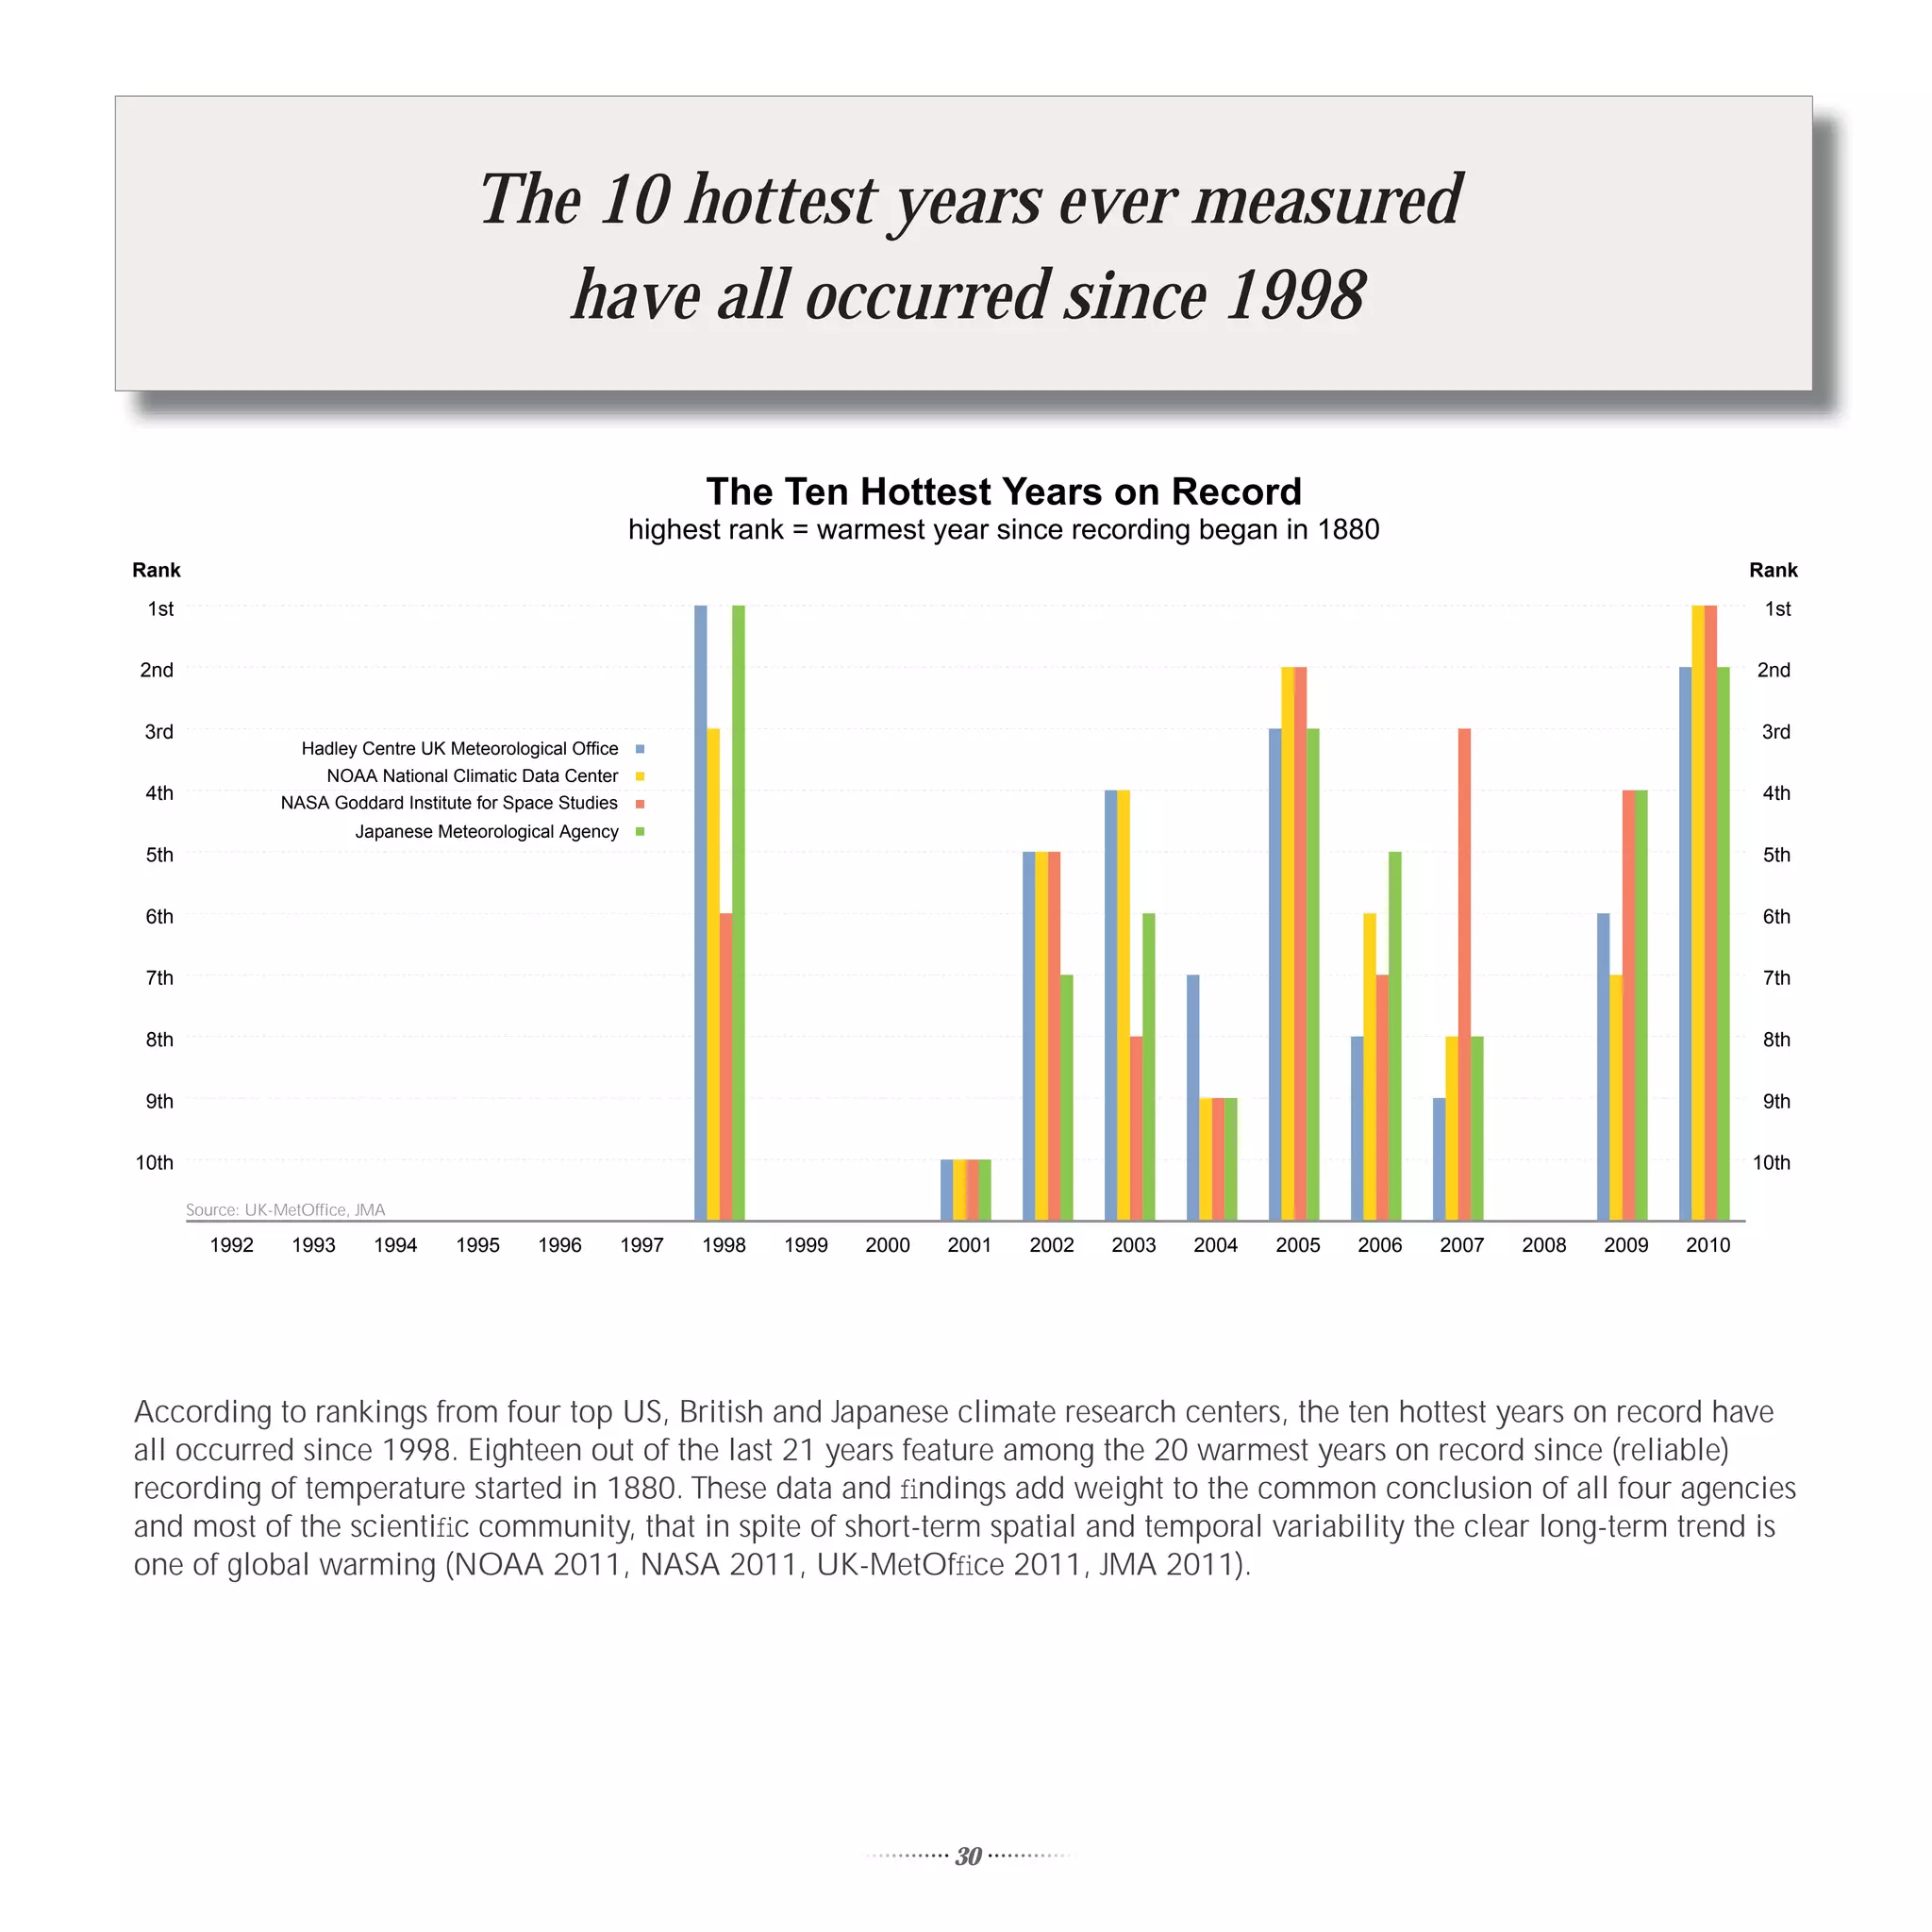
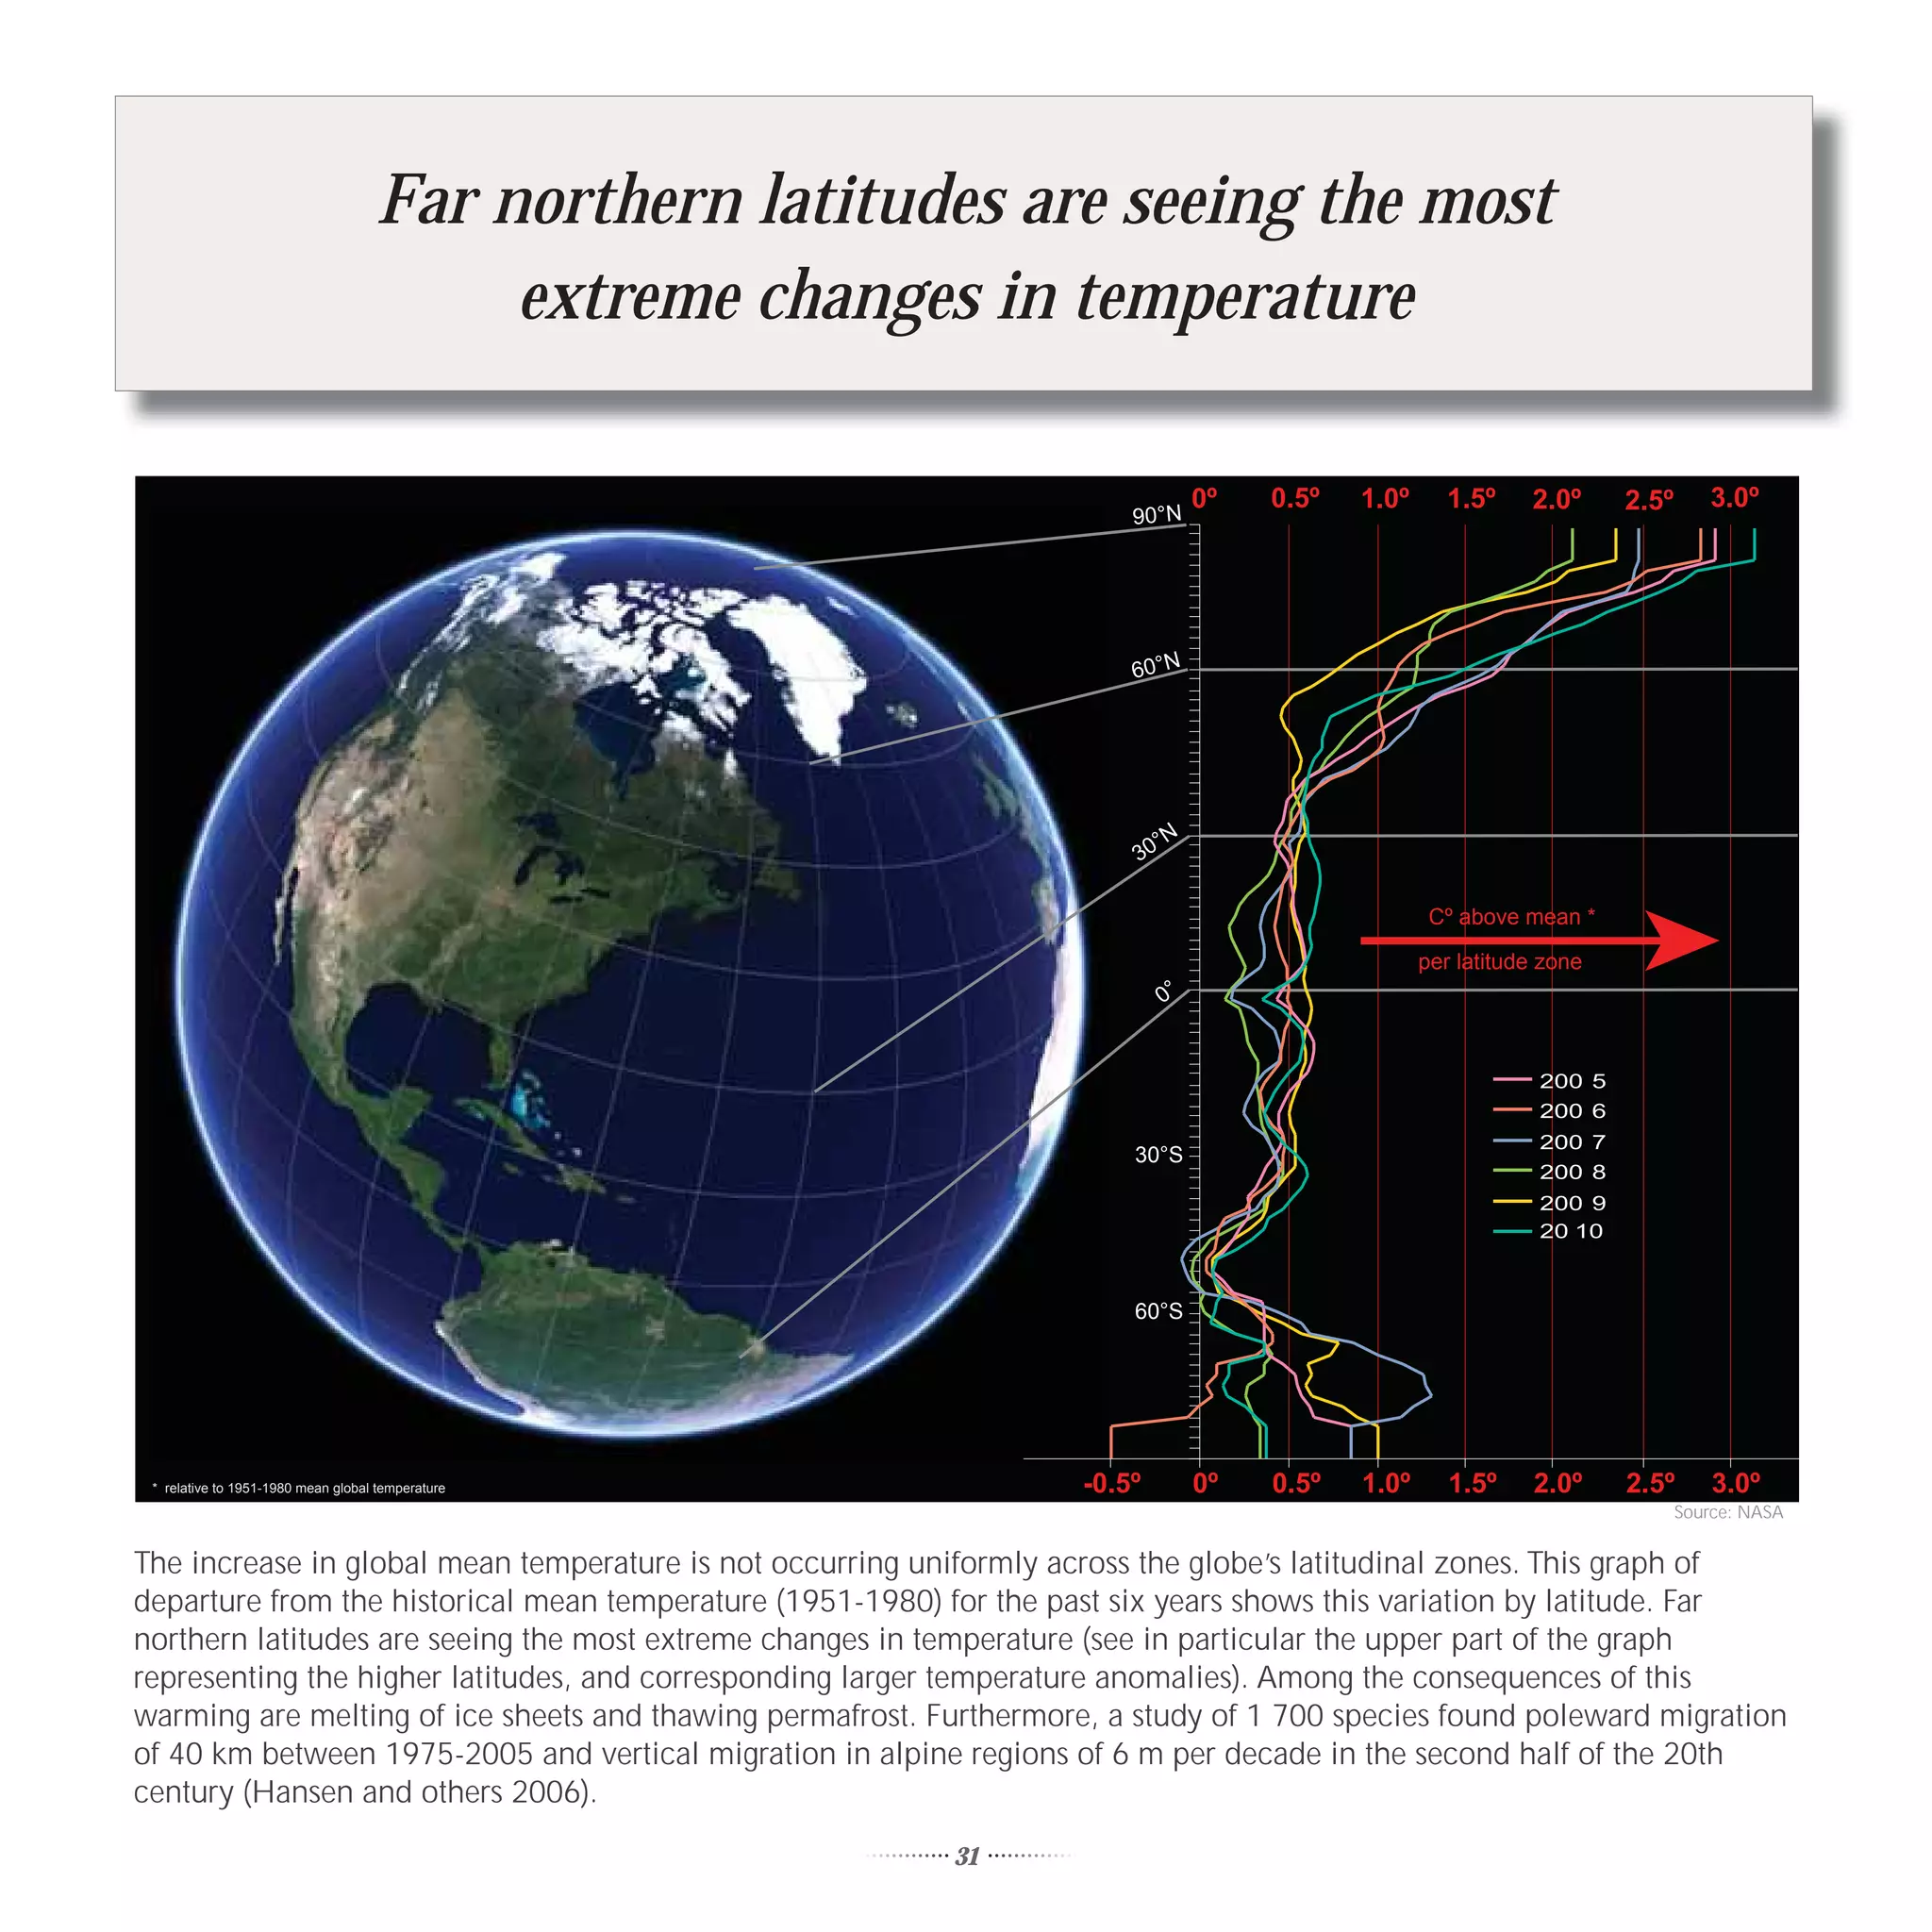
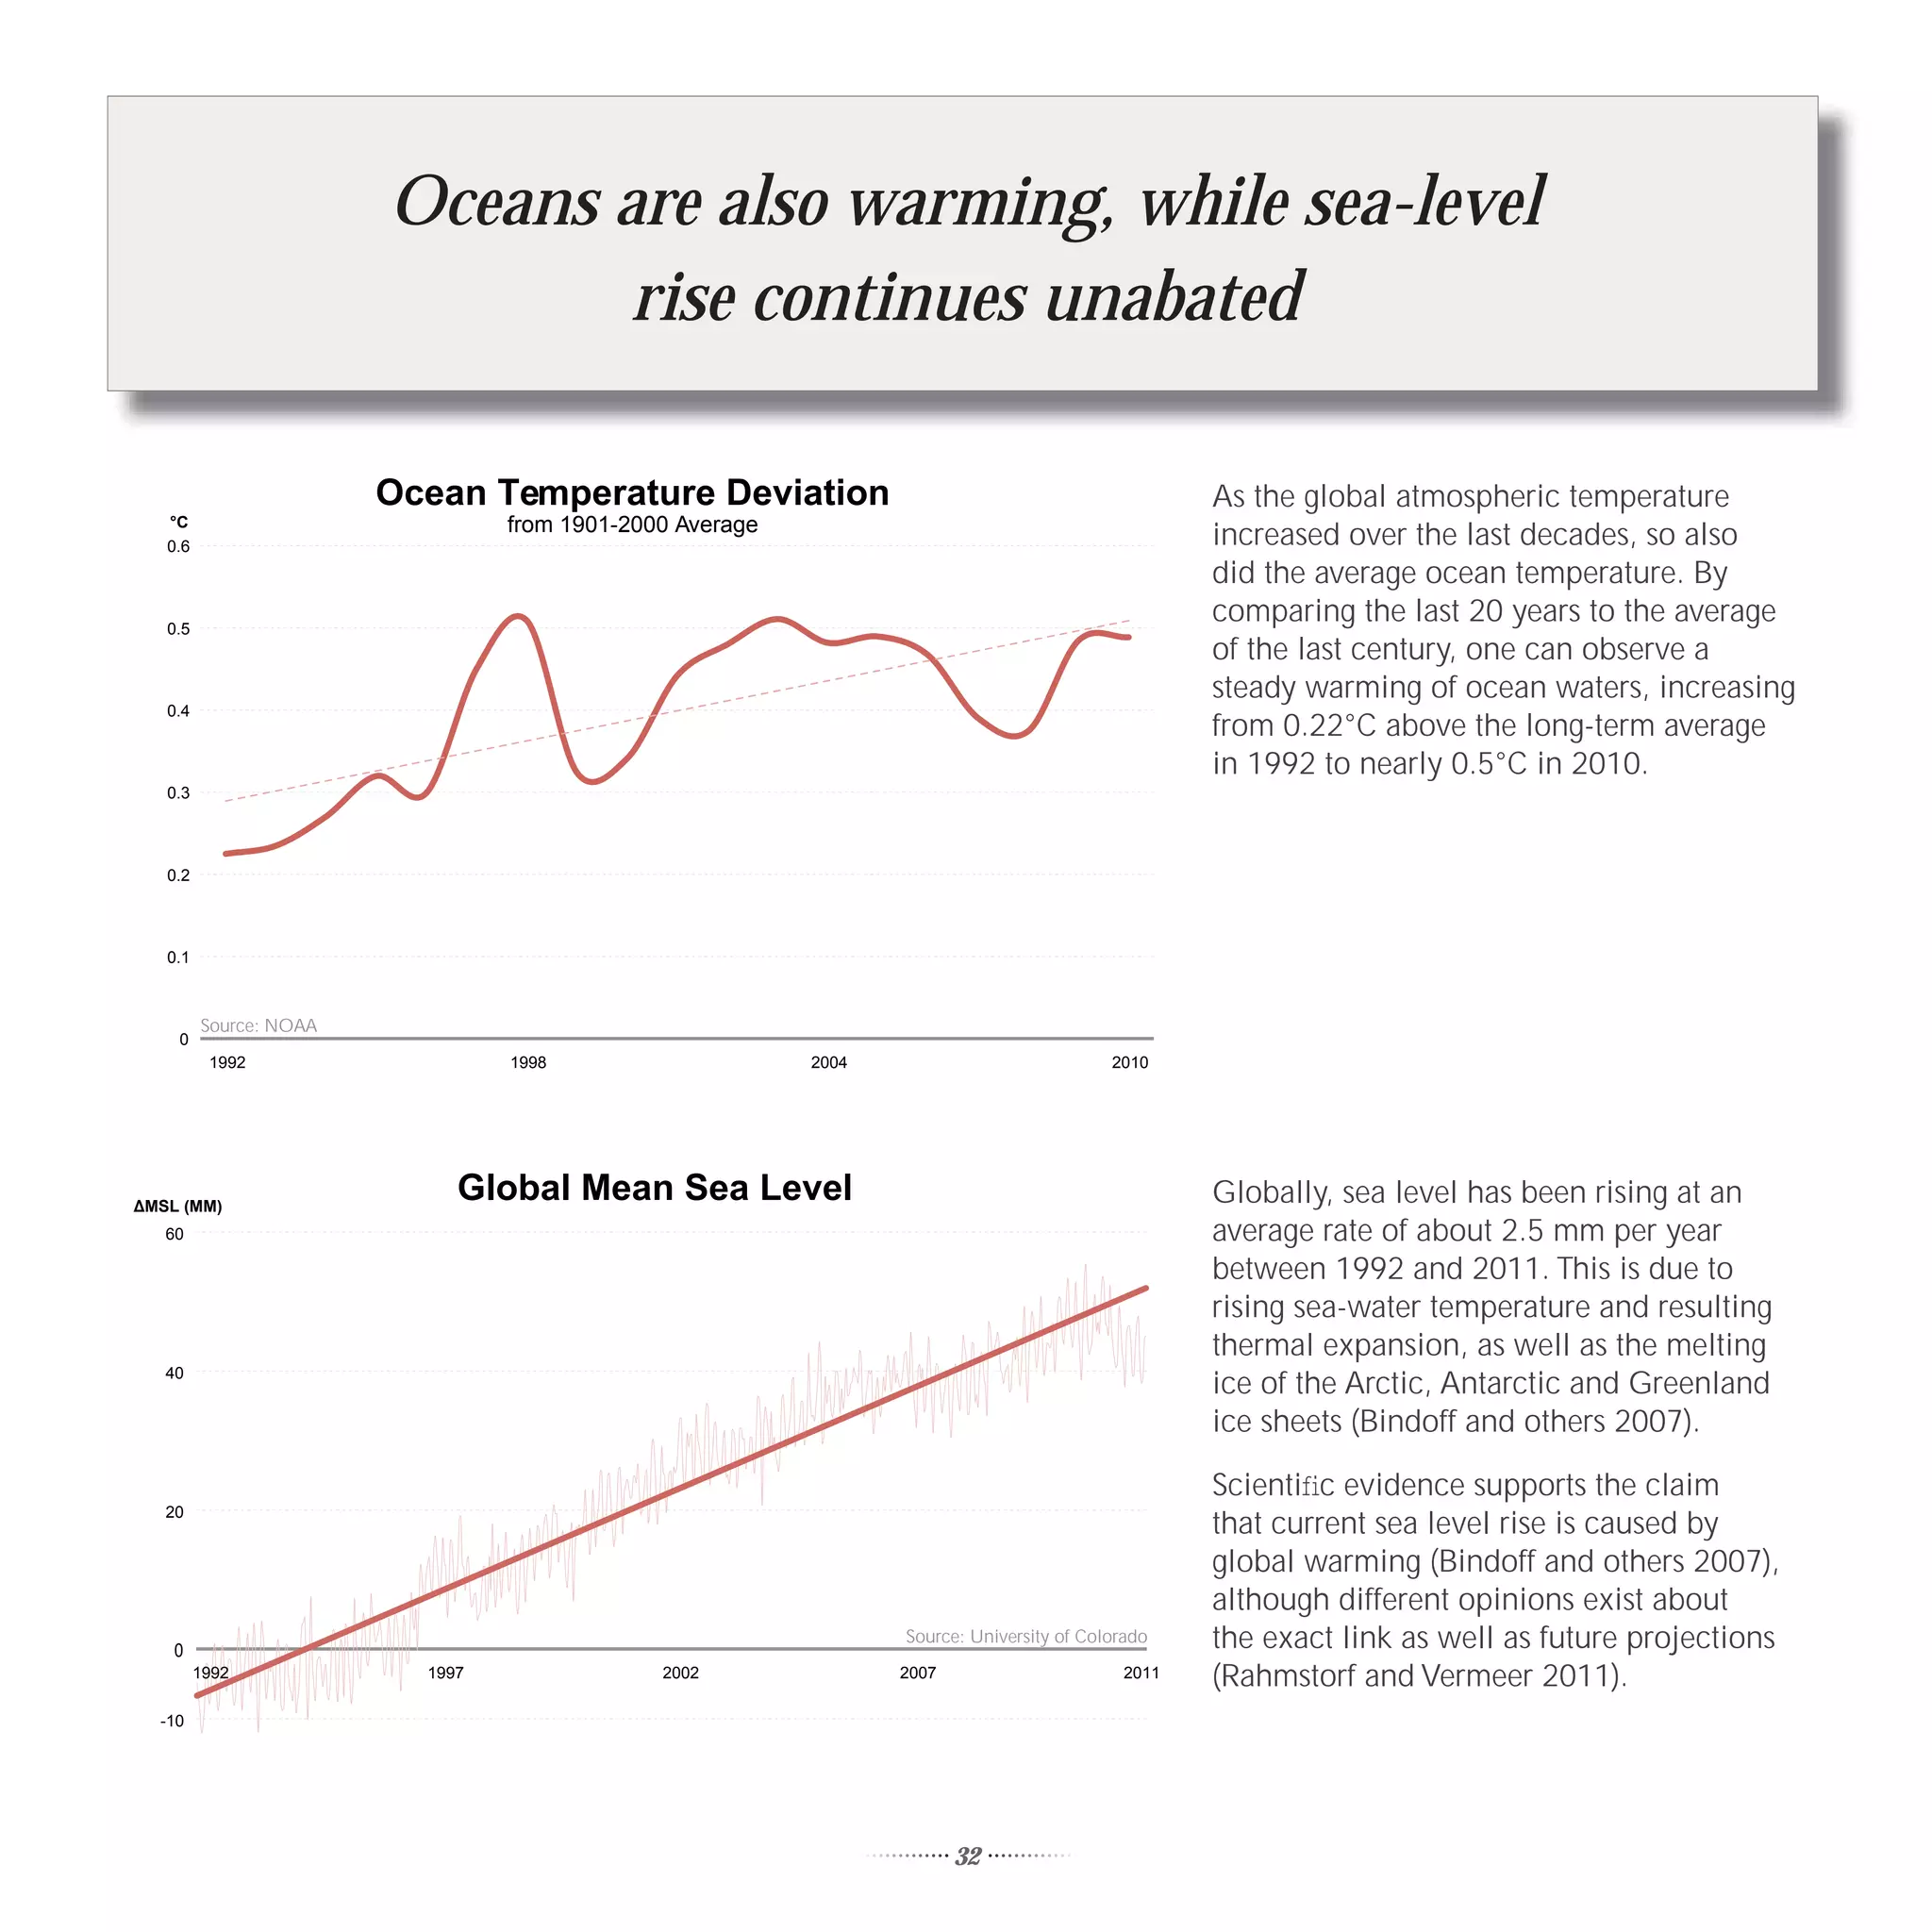
- Evidence of human-caused climate change has strengthened, with global temperatures, sea levels, and carbon dioxide levels rising sharply. - Awareness of biodiversity loss has grown, with over 28,000 species now threatened with extinction. - Issues around chemicals, waste, and pollution have become more pressing as industrialization and consumption have increased globally. - The scale of global challenges like energy, water, and food security has expanded rapidly with continuing population and economic growth. - New technologies like the internet, smartphones, and renewable energy have transformed societies and economies around the world. - International environmental law


