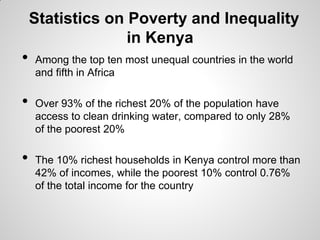
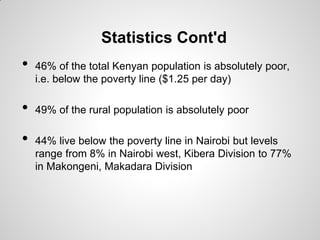
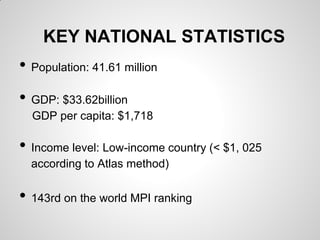
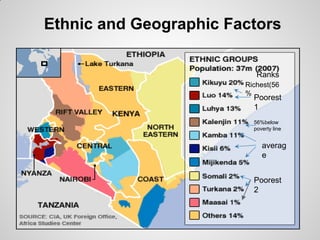
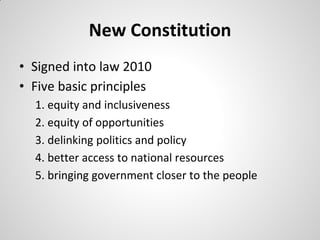
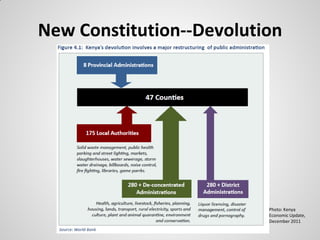
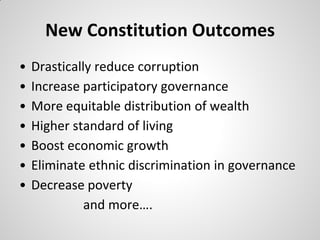
POVERTY, INEQUALITY
AND DEVELOPMENT IN
      KENYA

               Presented by:
            Moses Odhiambo
             Sashae Mitchell
              Rudi Goddard
                Idah Chungu
A study of the current state of
     poverty in Kenya

           Factors:
       Ethnic Divisions
      Political Structure
OBJECTIVES:
•   Brief introduction & facts

•   Key statistics

•   Measures: graphic and numeric

•   Ethnic and geographic factors

•   Role of politics

•   Policy suggestions
Where is Kenya?
Statistics on Poverty and Inequality
                  in Kenya
•   Among the top ten most unequal countries in the world
    and fifth in Africa

•   Over 93% of the richest 20% of the population have
    access to clean drinking water, compared to only 28%
    of the poorest 20%

•   The 10% richest households in Kenya control more than
    42% of incomes, while the poorest 10% control 0.76%
    of the total income for the country
Statistics Cont'd
•   46% of the total Kenyan population is absolutely poor,
    i.e. below the poverty line ($1.25 per day)

•   49% of the rural population is absolutely poor

•   44% live below the poverty line in Nairobi but levels
    range from 8% in Nairobi west, Kibera Division to 77%
    in Makongeni, Makadara Division
KEY NATIONAL STATISTICS
• Population: 41.61 million
• GDP: $33.62billion
  GDP per capita: $1,718

• Income level: Low-income country (< $1, 025
  according to Atlas method)

• 143rd on the world MPI ranking
GNI per capita, PPP
Projected population growth
               rate
Increase in urbanization (both good and bad)
—
Income Share
Trend: 1994-1997 (decline in high, increase in low)
Comparison: Lowest 10% and highest 10% (1992 - 39x; 1994 - 15x; 1997 – 13x; 2005 – 19x)


     Year                                    Income Share of:


               Lowest    First 20%   Second     Third      Fourth   Highest   Highest
               10%                   20%        20%        20%      20%       10%


     1992      1.24      3.39        6.72       10.73      17.32    61.84     47.87


     1994      2.11      5.61        10.12      14.75      21.43    48.08     32.76


     1997      2.50      5.97        9.86       14.27      20.82    49.08     33.83


     2005      1.96      4.84        8.68       13.20      20.08    53.20     37.99
Lorenz Curves
Multidimensional Poverty Index
O
—PHI–reflects intensity of poverty as a result of
  deprivations.
National & Regional MPI
Ethnic and Geographic Factors


                           Ranks
                        Richest(56
                        %
                          Poorest
                          1
                          56%below
                          poverty line


                             averag
                             e


                          Poorest
                          2
Theory
•   John Burton – The Human Needs Theory
•   Certain universal needs that must be satisfied if people
    are to prevent or resolve destructive conflicts
•   High competition for:
     o rights
     o jobs
     o education
     o language
     o social amenities and good health care facilities
Solutions
• Discourage corruption
• Embrace transparency
• Equitable distribution of resources
• Good governance
Political Structure & Poverty
HISTORY
• 1885-1963 British colony
• 1963 declared independence
  • President Jomo Kenyatta 1963-1978
  • President Daniel Arap Moi 1978-2002
  • President Mwai Kibaki 2002-present
Kenyatta Presidency
• Kenyan African National Union (KANU)
• Economic growth
  • Increased foreign investment
  • Decreased capital outflows
• Higher standard of living

• Primary exports-based economy
• Unequal distribution of wealth
Moi Presidency
•   KANU
•   Created one-party state
•   Corruption
•   Too much power concentrated in one place
•   Foreign aid/investment dwindles
•   Served 5 terms (max)
Kibaki Presidency
•   KANU
•   Anti-corruption platform
•   Limit ethnic discrimination
•   Proposed new Constitution

• Corruption, stagnant economic growth, high
  levels of poverty, natural disasters, restricted
  foreign aid
2007 Post-Election Crisis
• Kibaki closely defeats Raila Odinga (National
  Rainbow Coalition—NARC)
• Violent crisis sparked by ethnic tensions


                                          Photo: Committee
                                          to Protect
                                          Journalists,
                                          December 2010
Participatory Governance

―Human development broadens people’s
choices, raises their standard of living and
improves their quality of life. It expands human
capabilities and access to opportunities in the
social, economic and political arenas,
especially for the poor.‖ --Third Kenya Human
Development Report (2003)
New Constitution
• Signed into law 2010
• Five basic principles
  1. equity and inclusiveness
  2. equity of opportunities
  3. delinking politics and policy
  4. better access to national resources
  5. bringing government closer to the people
New Constitution--Devolution


                          Photo: Kenya
                          Economic Update,
                          December 2011
New Constitution Outcomes
•   Drastically reduce corruption
•   Increase participatory governance
•   More equitable distribution of wealth
•   Higher standard of living
•   Boost economic growth
•   Eliminate ethnic discrimination in governance
•   Decrease poverty
              and more….
Sources
•   Dupas & Robinson. ―Coping with Political Instability: Micro Evidence from
    Kenya’s 2007 Election Crisis.‖ American Economic Review: Papers &
    Proceedings 100 (May 2010): 120–124. Web. November 2012.


•   Rhodes, Tom. ―Kenyan radio station manager wanted at The Hague‖
    Committee to Protect Journalists Blog. 23 December 2010. Web. November
    2012.


•   United States. Library of Congress—Federal Research Division. Country
    Profile: Kenya. June 2007. Web. November 2012.


•   United Nations Development Programme. Human Development Report
    2003: Participatory Governance for Human Development. 2003. Human
    Development Reports. Web. November 2012.
Sources Cont'd
•   The World Bank. Kenya Economic Update: Navigating the Storm, Delivering
    the Promise with a special focus on Kenya’s momentous devolution.
    December 2011. Ed. 5. Web. November 2012.


•   Society of International Development, "Pulling Apart:Facts and Figures on
    Inequality in Kenya." Trans. Array Rich and Poor: National Discourses on
    Poverty, Inequality and Growth Project. Society of International
    Development, 2004.


•   Suri, Tavneet, David Tschirley, Charity Irungu, Raphael Gitau, and Daniel
    Kariuki. "Egerton University." 13 Nov 2012.
    <http://www.tegemeo.org/documents/work/Tegemeo-WP30-Rural-incomes-
    inequality-poverty-dynamics-Kenya.pdf>.

Econ 225 powerpoint presentation

  • 1.
    POVERTY, INEQUALITY AND DEVELOPMENTIN KENYA Presented by: Moses Odhiambo Sashae Mitchell Rudi Goddard Idah Chungu
  • 2.
    A study ofthe current state of poverty in Kenya Factors: Ethnic Divisions Political Structure
  • 3.
    OBJECTIVES: • Brief introduction & facts • Key statistics • Measures: graphic and numeric • Ethnic and geographic factors • Role of politics • Policy suggestions
  • 4.
  • 6.
    Statistics on Povertyand Inequality in Kenya • Among the top ten most unequal countries in the world and fifth in Africa • Over 93% of the richest 20% of the population have access to clean drinking water, compared to only 28% of the poorest 20% • The 10% richest households in Kenya control more than 42% of incomes, while the poorest 10% control 0.76% of the total income for the country
  • 7.
    Statistics Cont'd • 46% of the total Kenyan population is absolutely poor, i.e. below the poverty line ($1.25 per day) • 49% of the rural population is absolutely poor • 44% live below the poverty line in Nairobi but levels range from 8% in Nairobi west, Kibera Division to 77% in Makongeni, Makadara Division
  • 8.
    KEY NATIONAL STATISTICS •Population: 41.61 million • GDP: $33.62billion GDP per capita: $1,718 • Income level: Low-income country (< $1, 025 according to Atlas method) • 143rd on the world MPI ranking
  • 9.
  • 10.
    Projected population growth rate Increase in urbanization (both good and bad) —
  • 11.
    Income Share Trend: 1994-1997(decline in high, increase in low) Comparison: Lowest 10% and highest 10% (1992 - 39x; 1994 - 15x; 1997 – 13x; 2005 – 19x) Year Income Share of: Lowest First 20% Second Third Fourth Highest Highest 10% 20% 20% 20% 20% 10% 1992 1.24 3.39 6.72 10.73 17.32 61.84 47.87 1994 2.11 5.61 10.12 14.75 21.43 48.08 32.76 1997 2.50 5.97 9.86 14.27 20.82 49.08 33.83 2005 1.96 4.84 8.68 13.20 20.08 53.20 37.99
  • 12.
  • 13.
    Multidimensional Poverty Index O —PHI–reflectsintensity of poverty as a result of deprivations.
  • 14.
  • 15.
    Ethnic and GeographicFactors Ranks Richest(56 % Poorest 1 56%below poverty line averag e Poorest 2
  • 17.
    Theory • John Burton – The Human Needs Theory • Certain universal needs that must be satisfied if people are to prevent or resolve destructive conflicts • High competition for: o rights o jobs o education o language o social amenities and good health care facilities
  • 18.
    Solutions • Discourage corruption •Embrace transparency • Equitable distribution of resources • Good governance
  • 19.
    Political Structure &Poverty HISTORY • 1885-1963 British colony • 1963 declared independence • President Jomo Kenyatta 1963-1978 • President Daniel Arap Moi 1978-2002 • President Mwai Kibaki 2002-present
  • 20.
    Kenyatta Presidency • KenyanAfrican National Union (KANU) • Economic growth • Increased foreign investment • Decreased capital outflows • Higher standard of living • Primary exports-based economy • Unequal distribution of wealth
  • 21.
    Moi Presidency • KANU • Created one-party state • Corruption • Too much power concentrated in one place • Foreign aid/investment dwindles • Served 5 terms (max)
  • 22.
    Kibaki Presidency • KANU • Anti-corruption platform • Limit ethnic discrimination • Proposed new Constitution • Corruption, stagnant economic growth, high levels of poverty, natural disasters, restricted foreign aid
  • 23.
    2007 Post-Election Crisis •Kibaki closely defeats Raila Odinga (National Rainbow Coalition—NARC) • Violent crisis sparked by ethnic tensions Photo: Committee to Protect Journalists, December 2010
  • 24.
    Participatory Governance ―Human developmentbroadens people’s choices, raises their standard of living and improves their quality of life. It expands human capabilities and access to opportunities in the social, economic and political arenas, especially for the poor.‖ --Third Kenya Human Development Report (2003)
  • 25.
    New Constitution • Signedinto law 2010 • Five basic principles 1. equity and inclusiveness 2. equity of opportunities 3. delinking politics and policy 4. better access to national resources 5. bringing government closer to the people
  • 26.
    New Constitution--Devolution Photo: Kenya Economic Update, December 2011
  • 27.
    New Constitution Outcomes • Drastically reduce corruption • Increase participatory governance • More equitable distribution of wealth • Higher standard of living • Boost economic growth • Eliminate ethnic discrimination in governance • Decrease poverty and more….
  • 28.
    Sources • Dupas & Robinson. ―Coping with Political Instability: Micro Evidence from Kenya’s 2007 Election Crisis.‖ American Economic Review: Papers & Proceedings 100 (May 2010): 120–124. Web. November 2012. • Rhodes, Tom. ―Kenyan radio station manager wanted at The Hague‖ Committee to Protect Journalists Blog. 23 December 2010. Web. November 2012. • United States. Library of Congress—Federal Research Division. Country Profile: Kenya. June 2007. Web. November 2012. • United Nations Development Programme. Human Development Report 2003: Participatory Governance for Human Development. 2003. Human Development Reports. Web. November 2012.
  • 29.
    Sources Cont'd • The World Bank. Kenya Economic Update: Navigating the Storm, Delivering the Promise with a special focus on Kenya’s momentous devolution. December 2011. Ed. 5. Web. November 2012. • Society of International Development, "Pulling Apart:Facts and Figures on Inequality in Kenya." Trans. Array Rich and Poor: National Discourses on Poverty, Inequality and Growth Project. Society of International Development, 2004. • Suri, Tavneet, David Tschirley, Charity Irungu, Raphael Gitau, and Daniel Kariuki. "Egerton University." 13 Nov 2012. <http://www.tegemeo.org/documents/work/Tegemeo-WP30-Rural-incomes- inequality-poverty-dynamics-Kenya.pdf>.