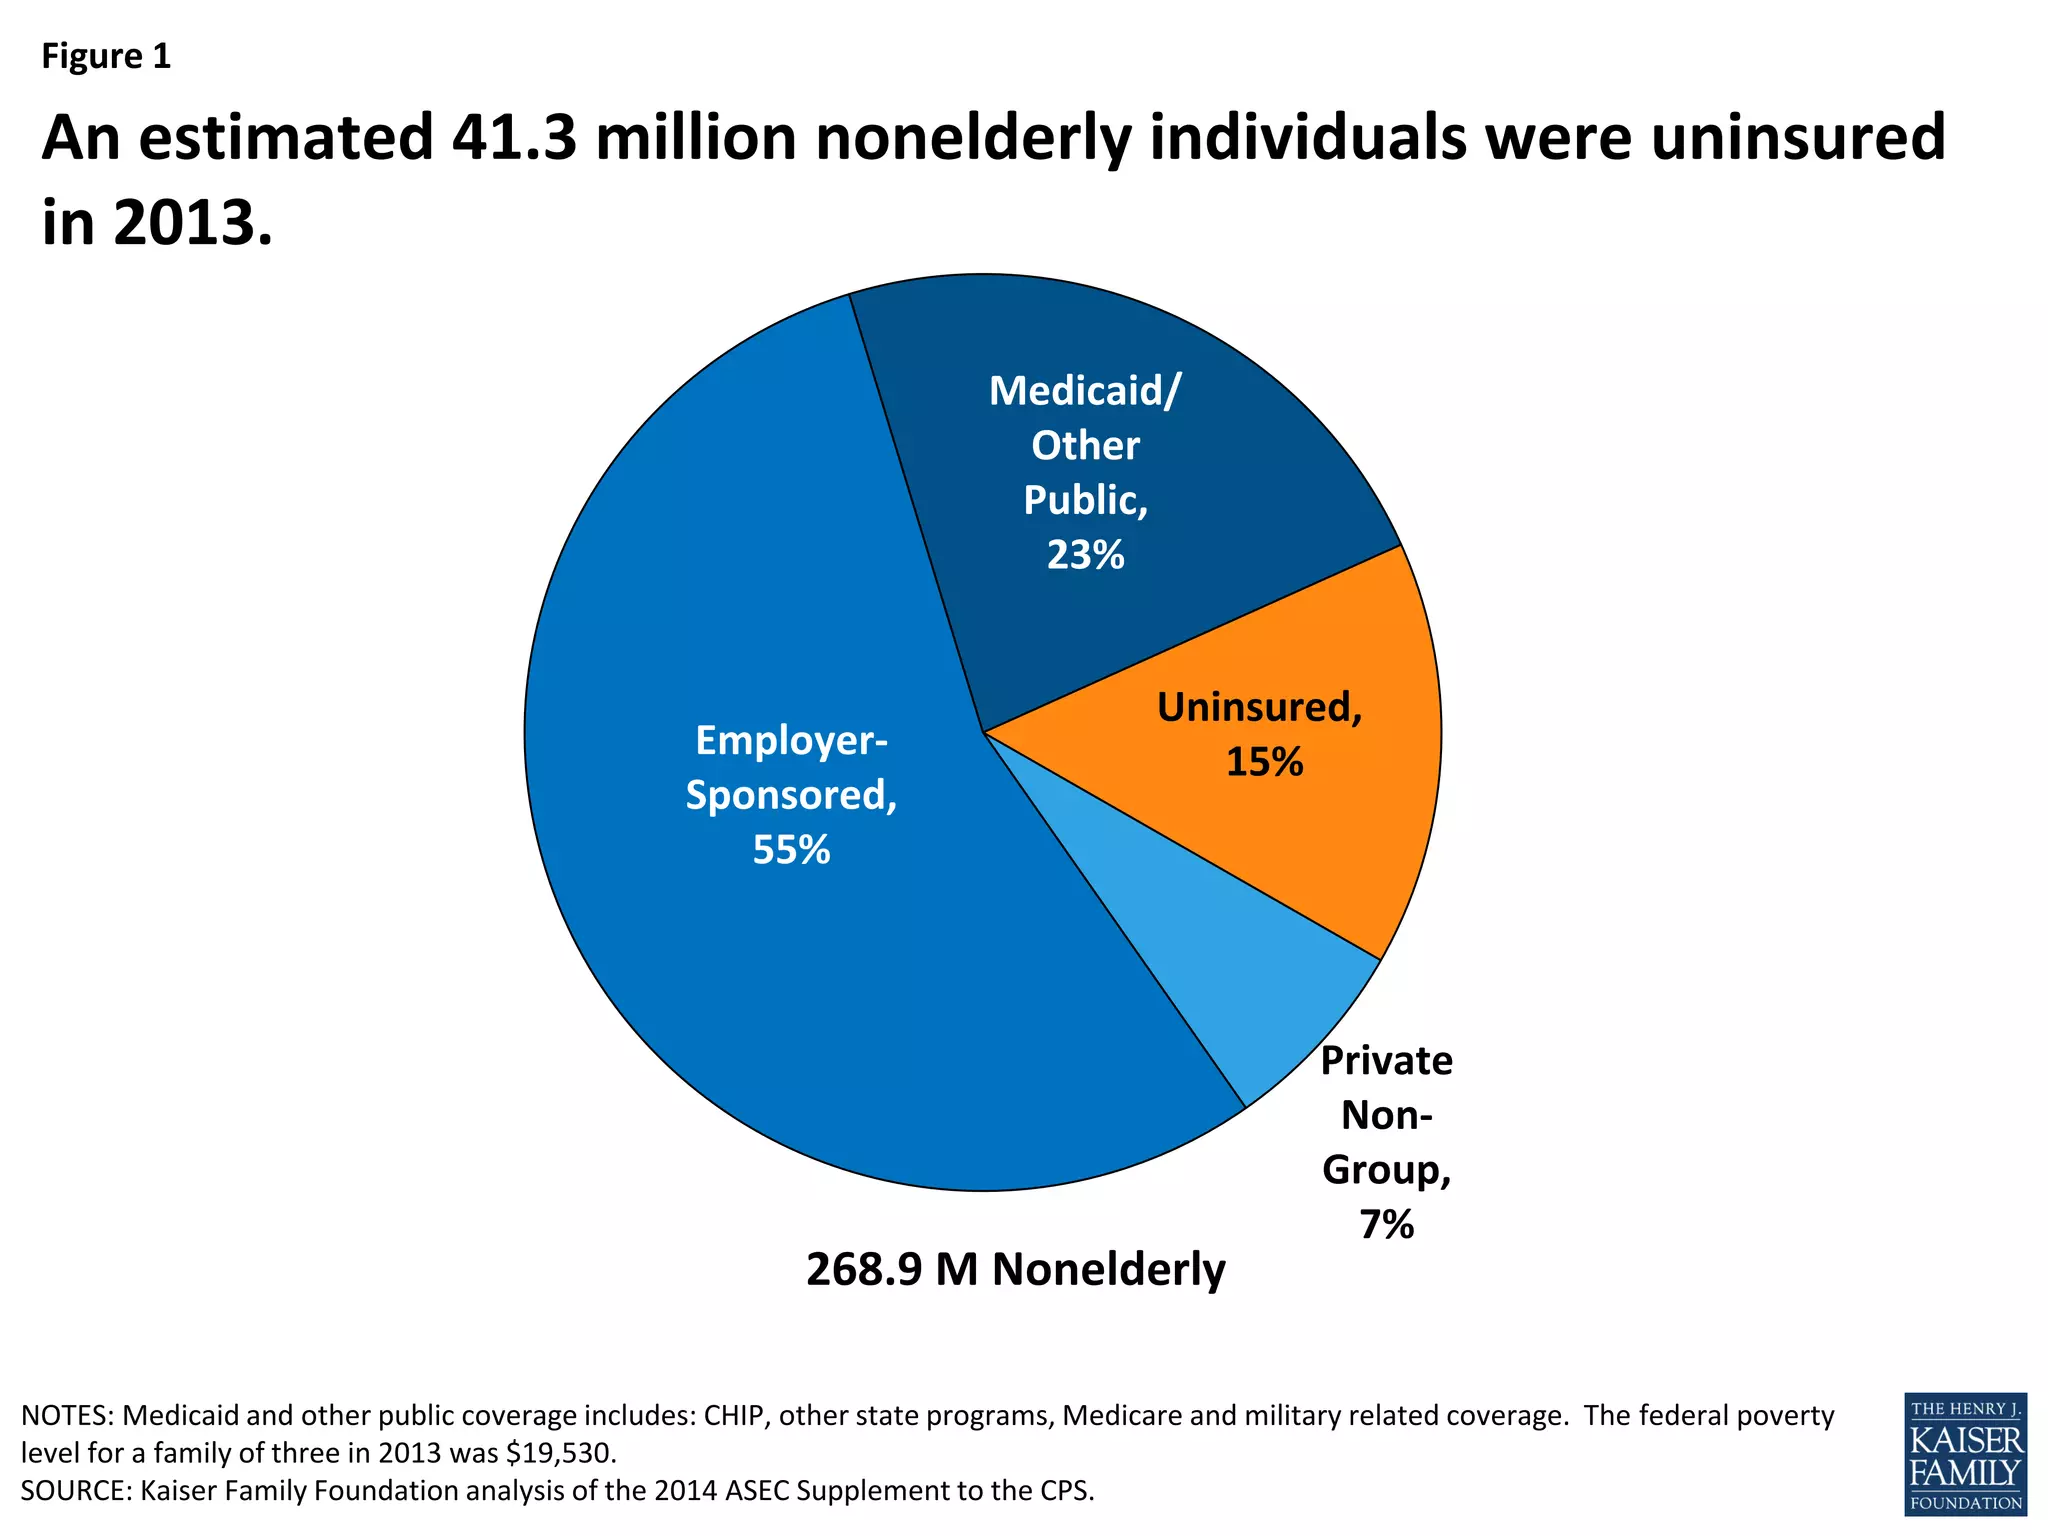
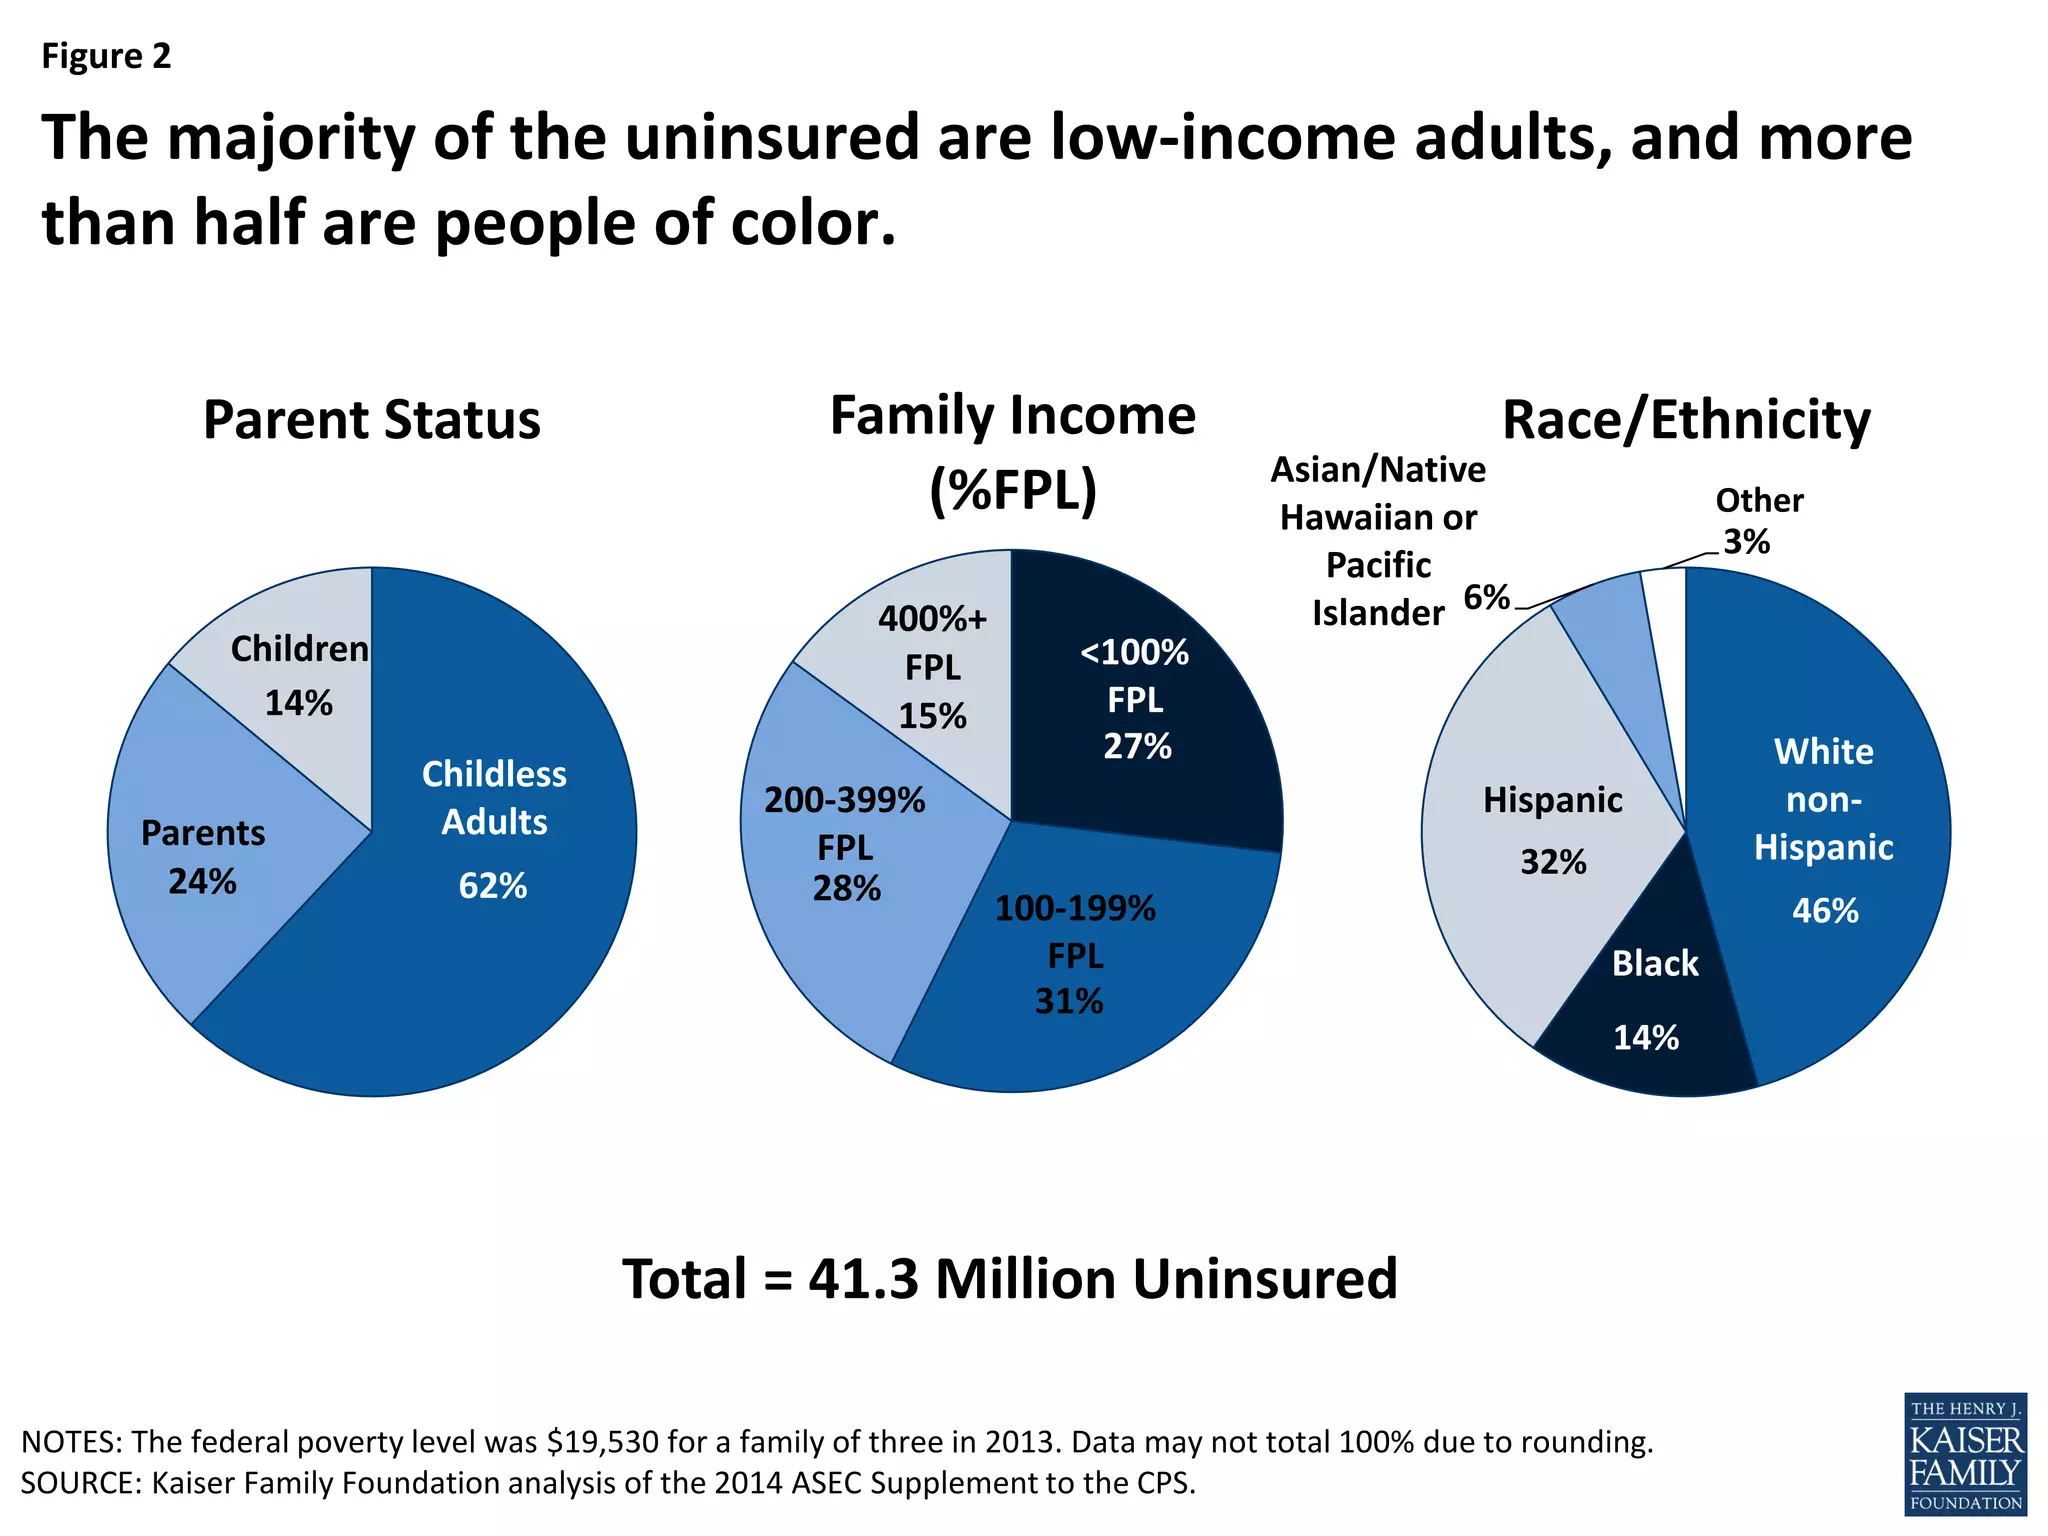
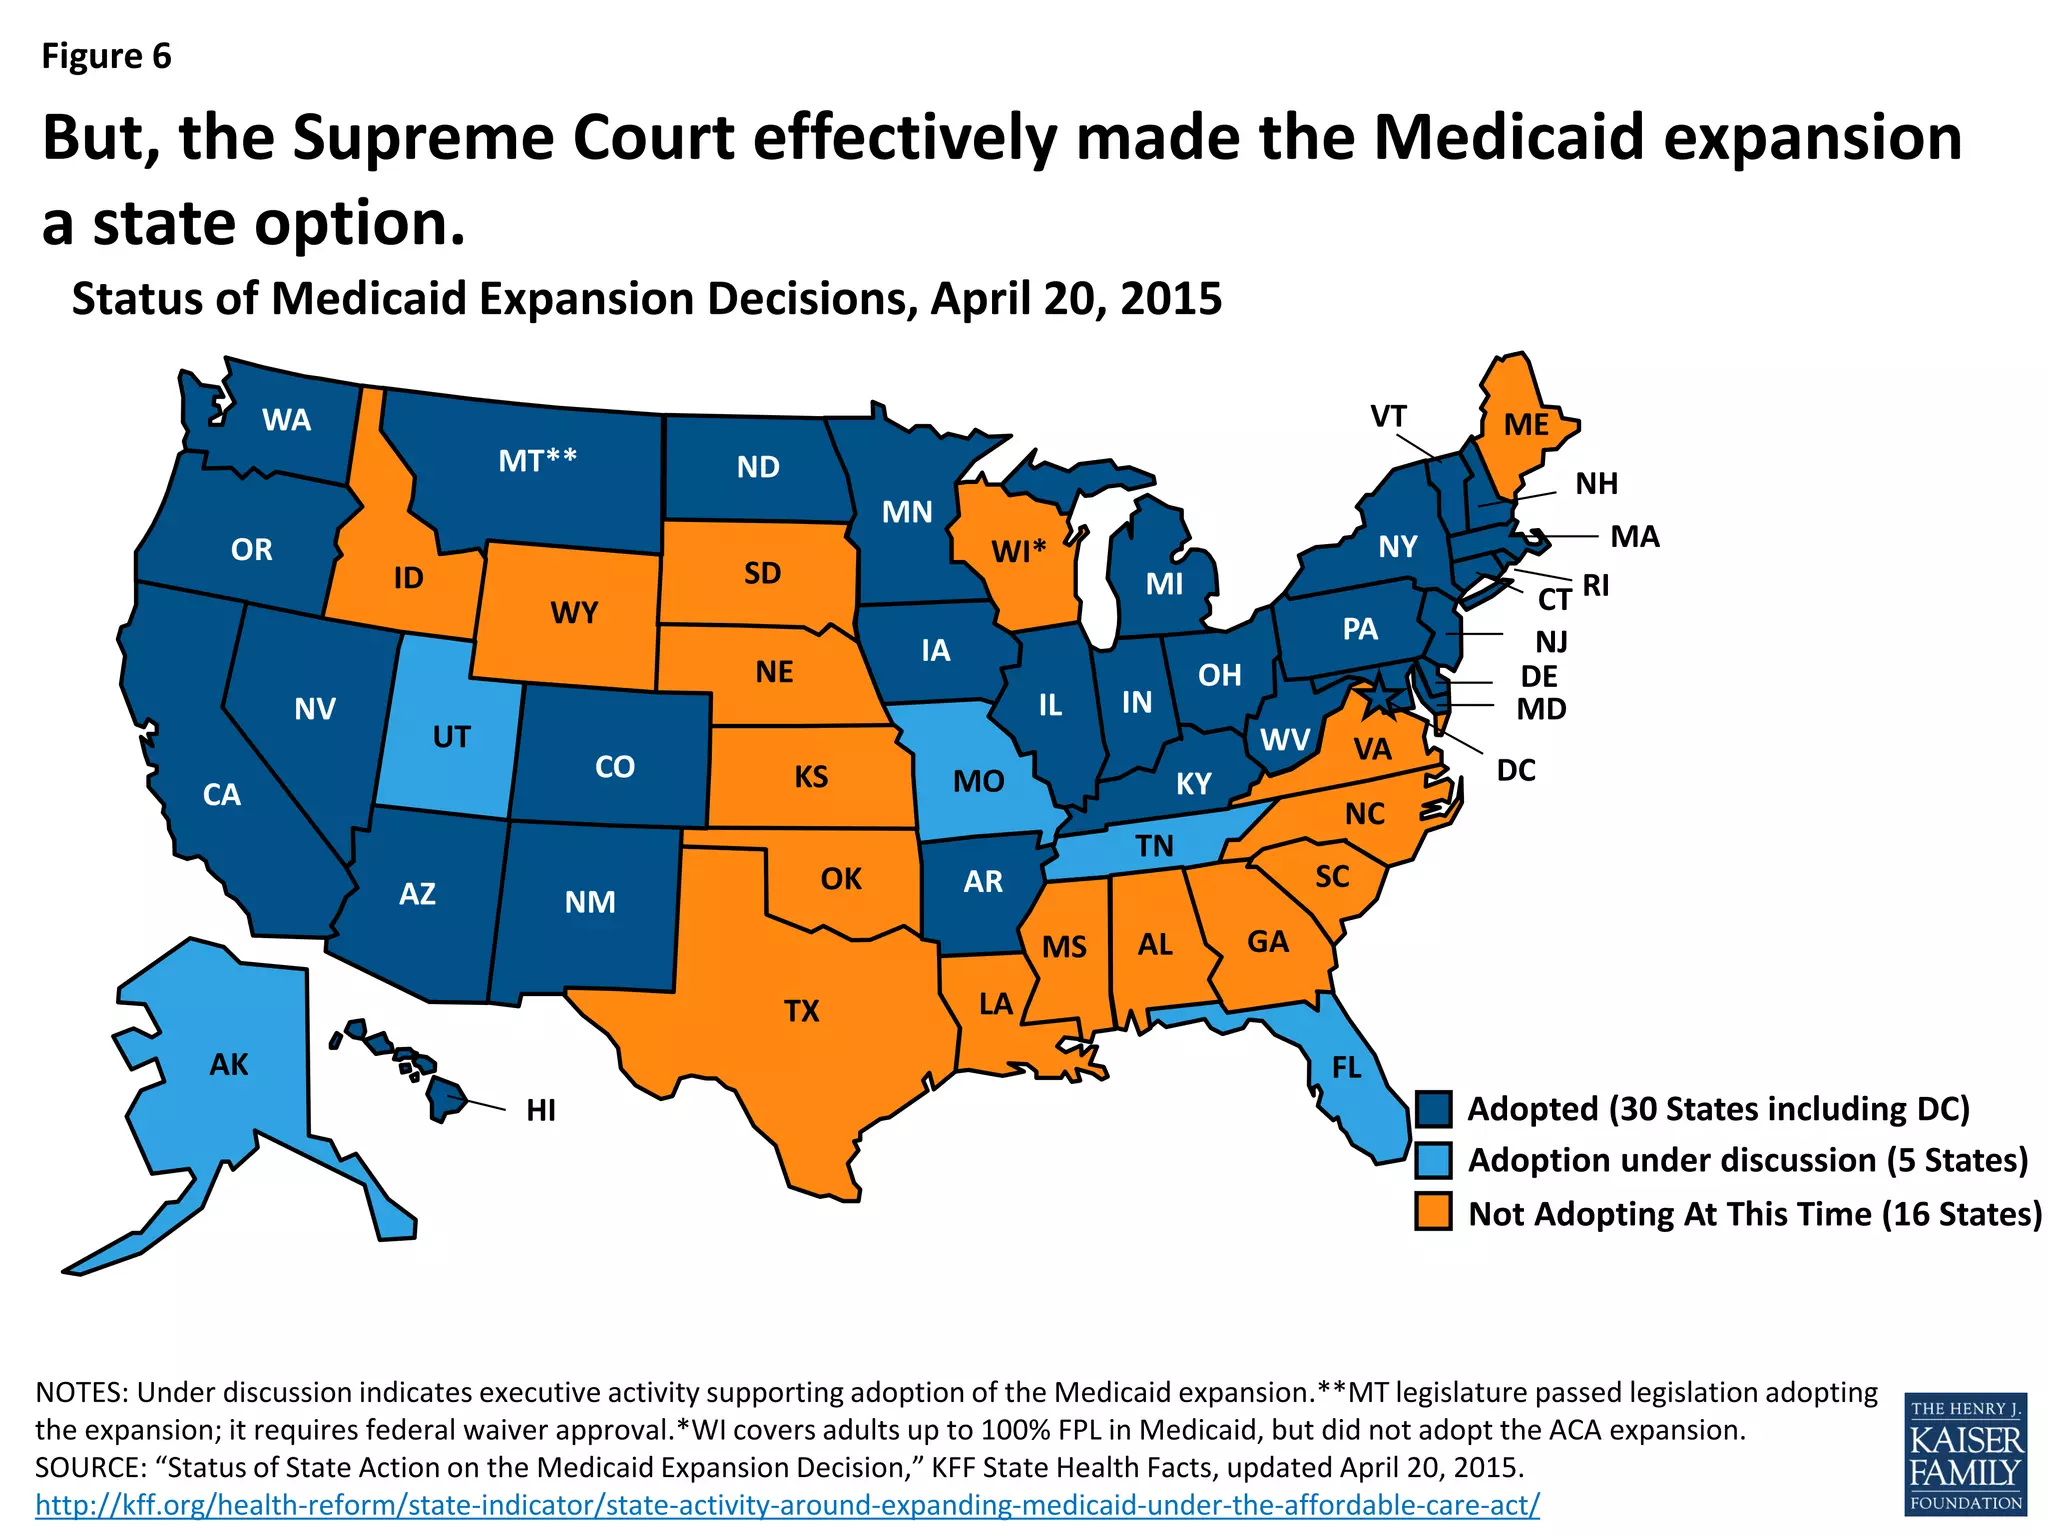
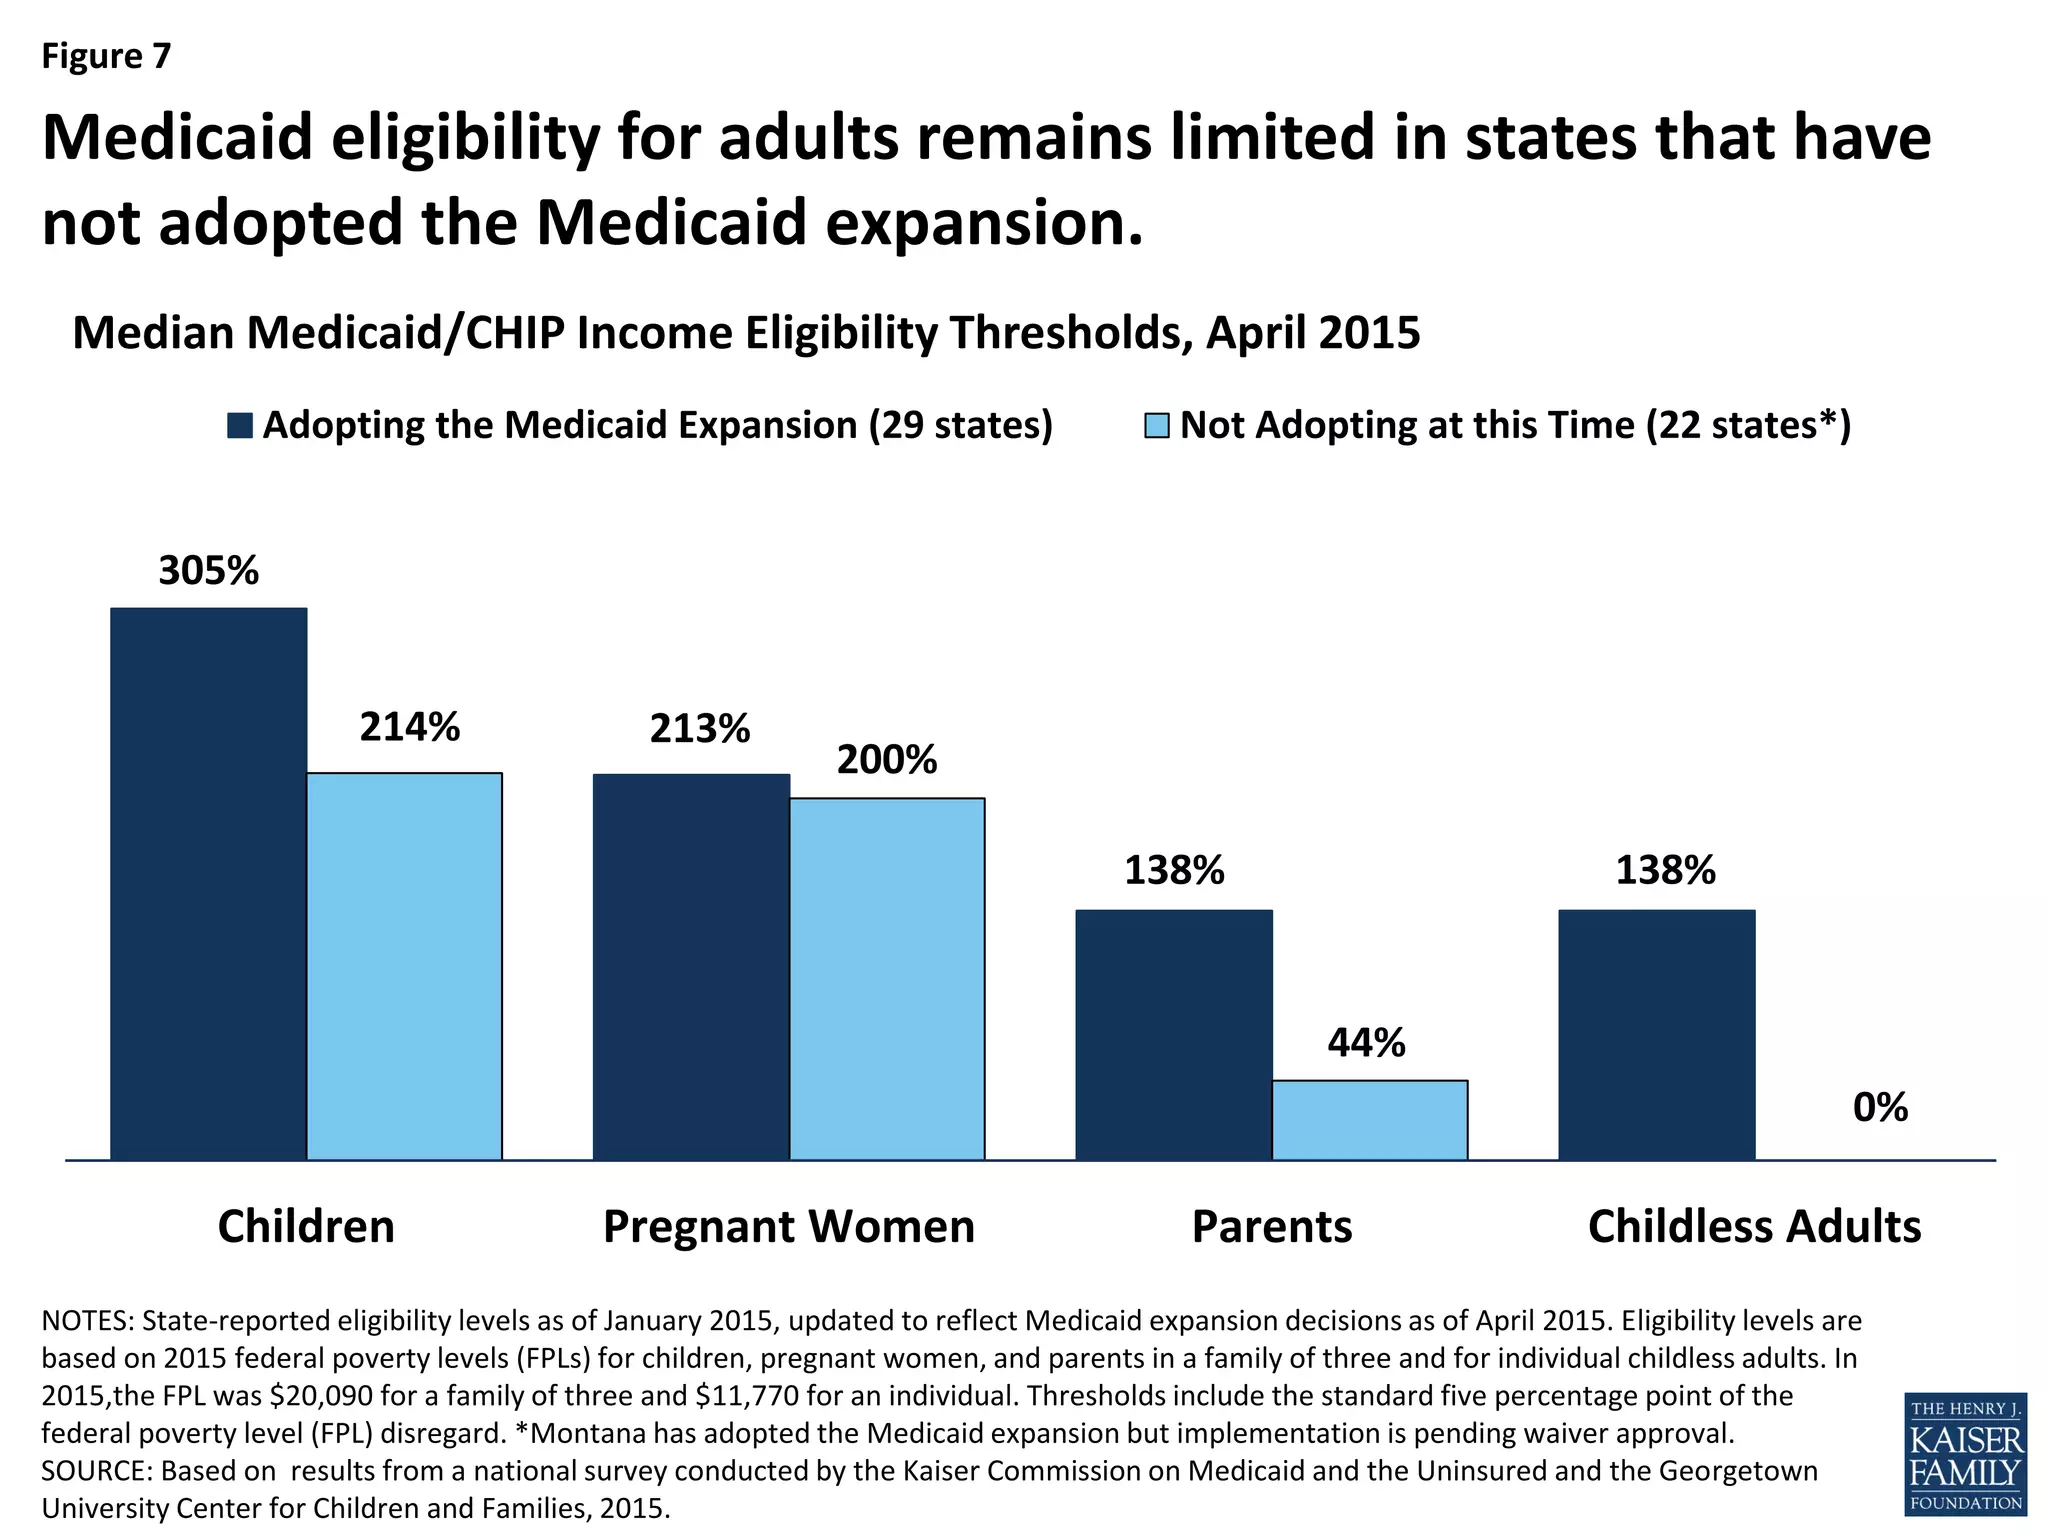
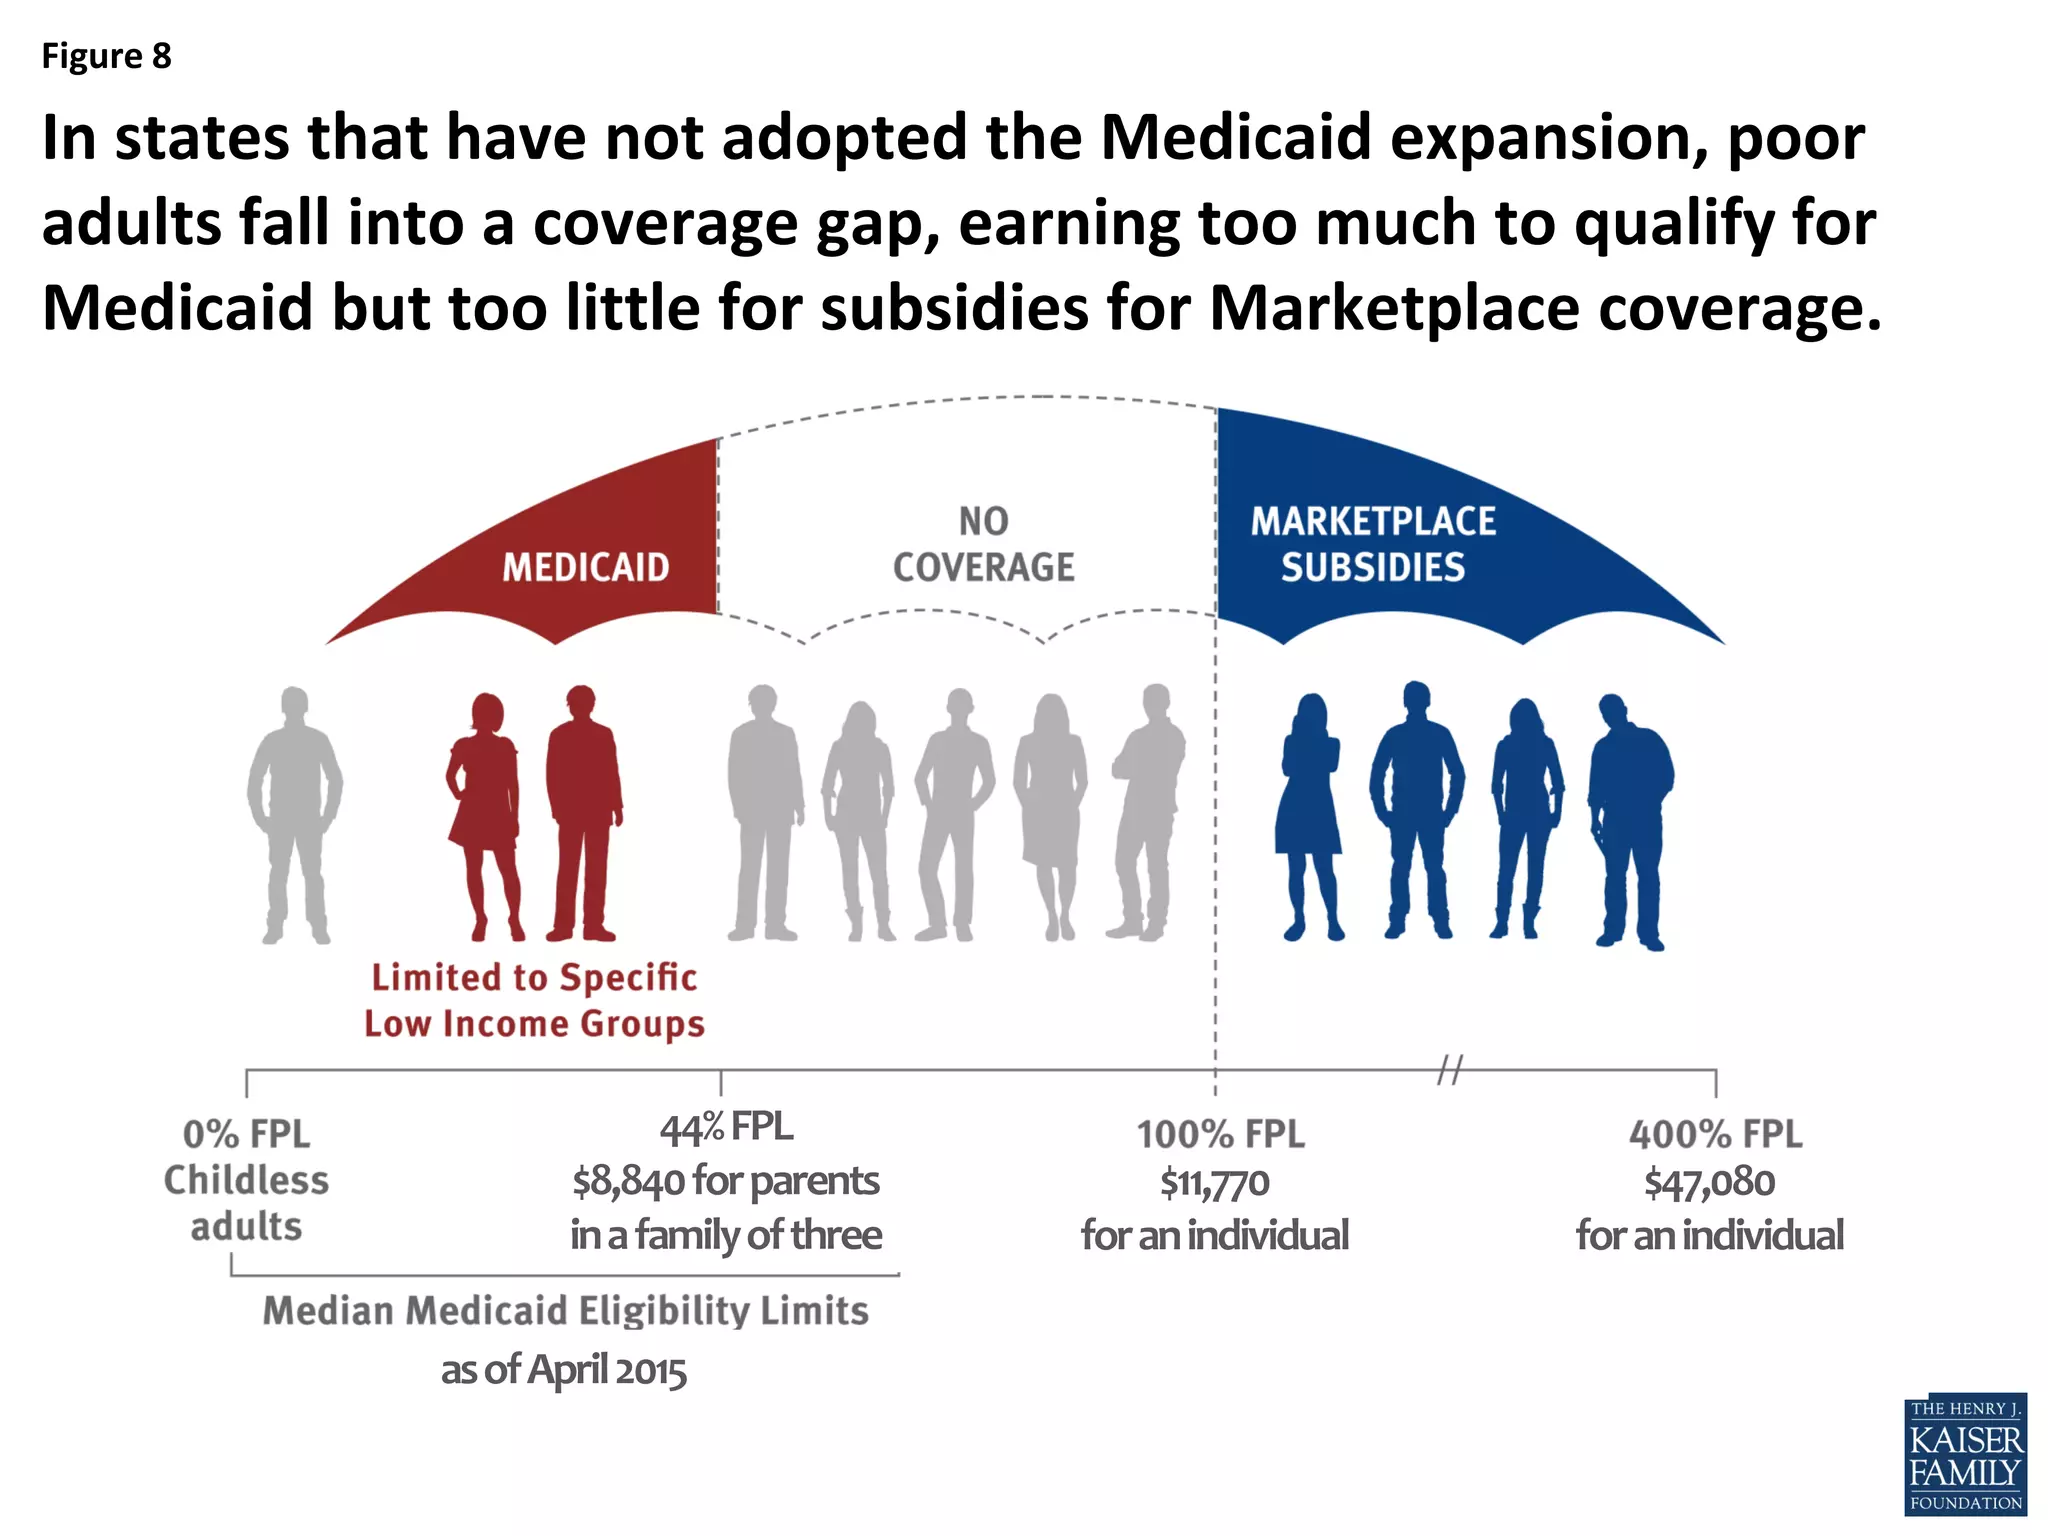
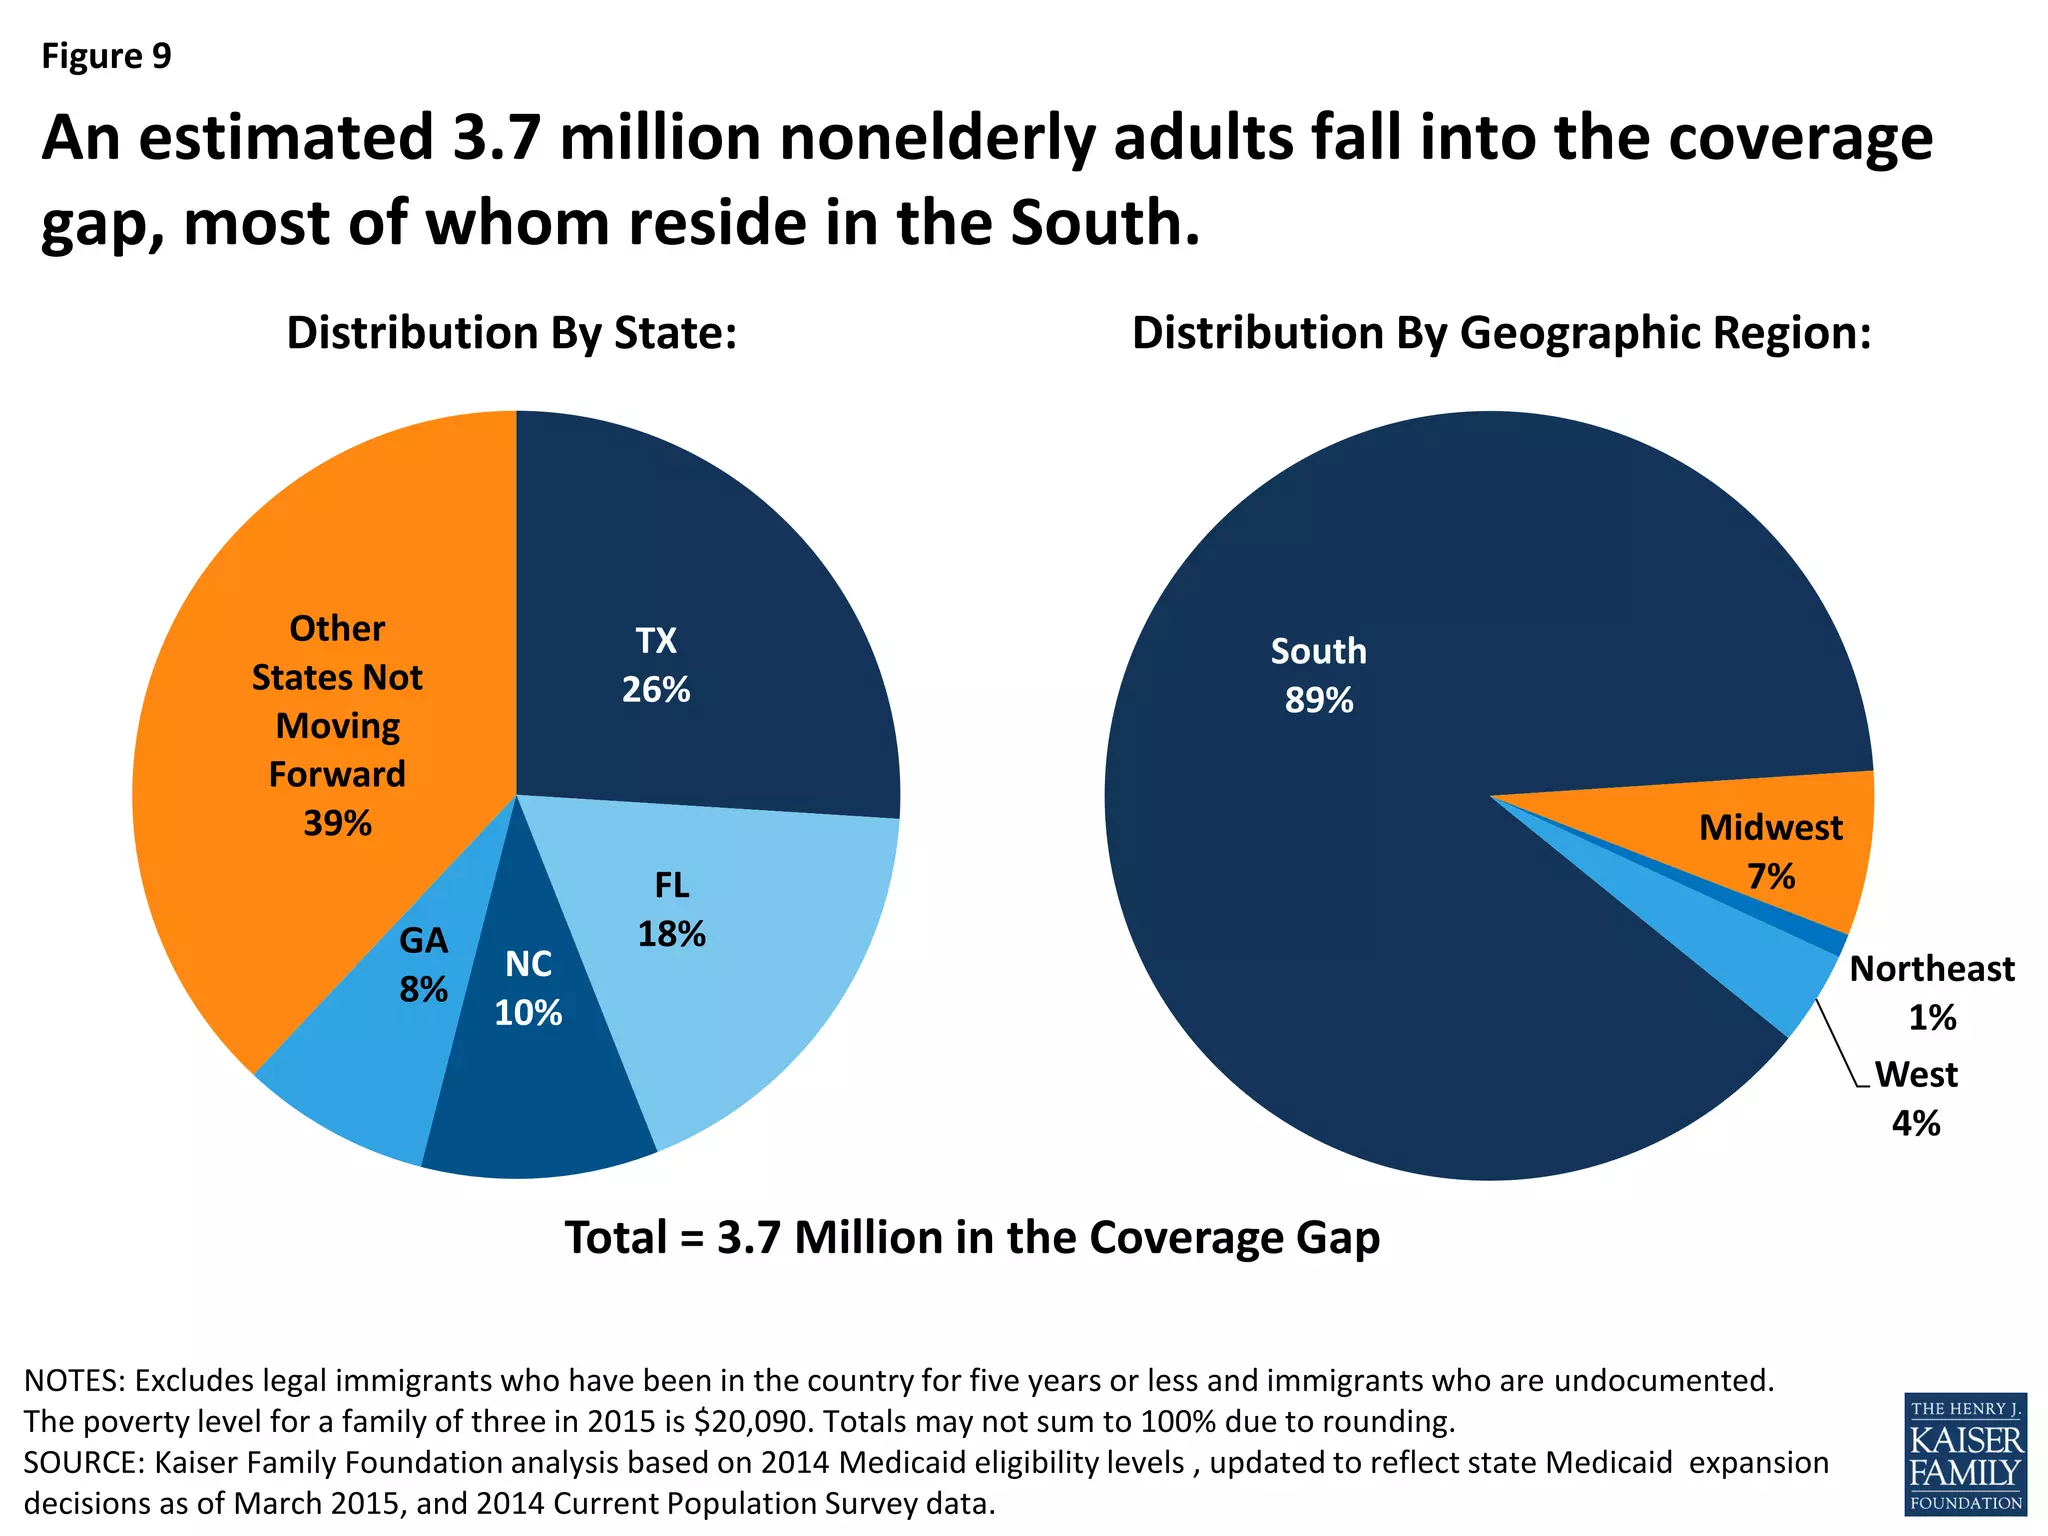
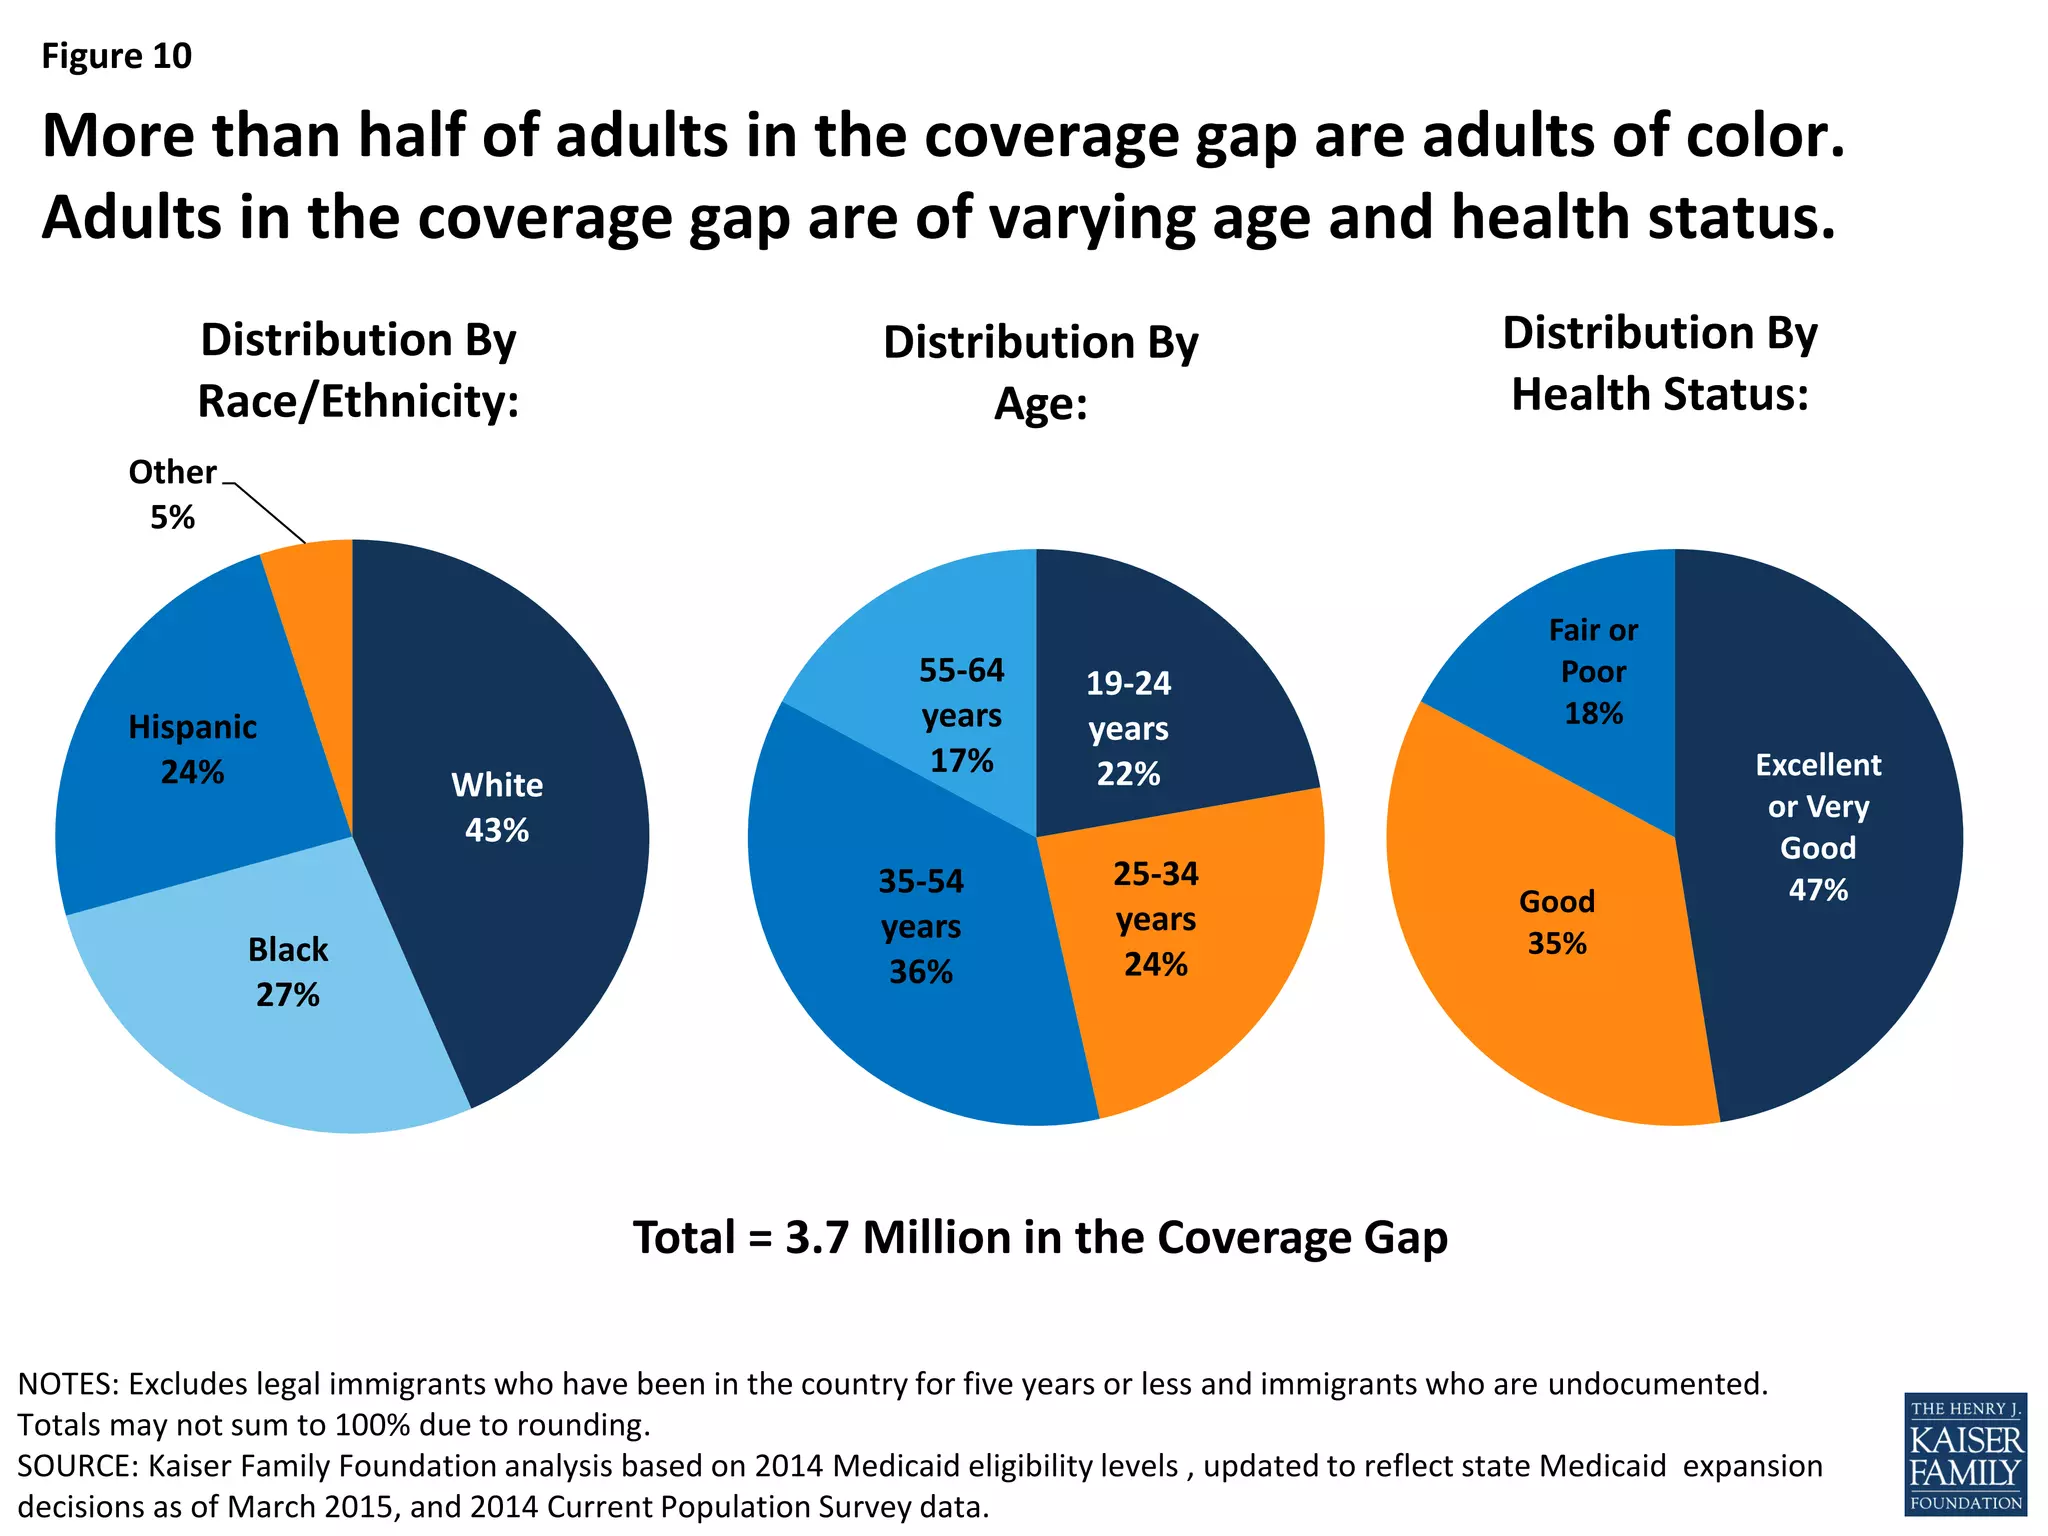
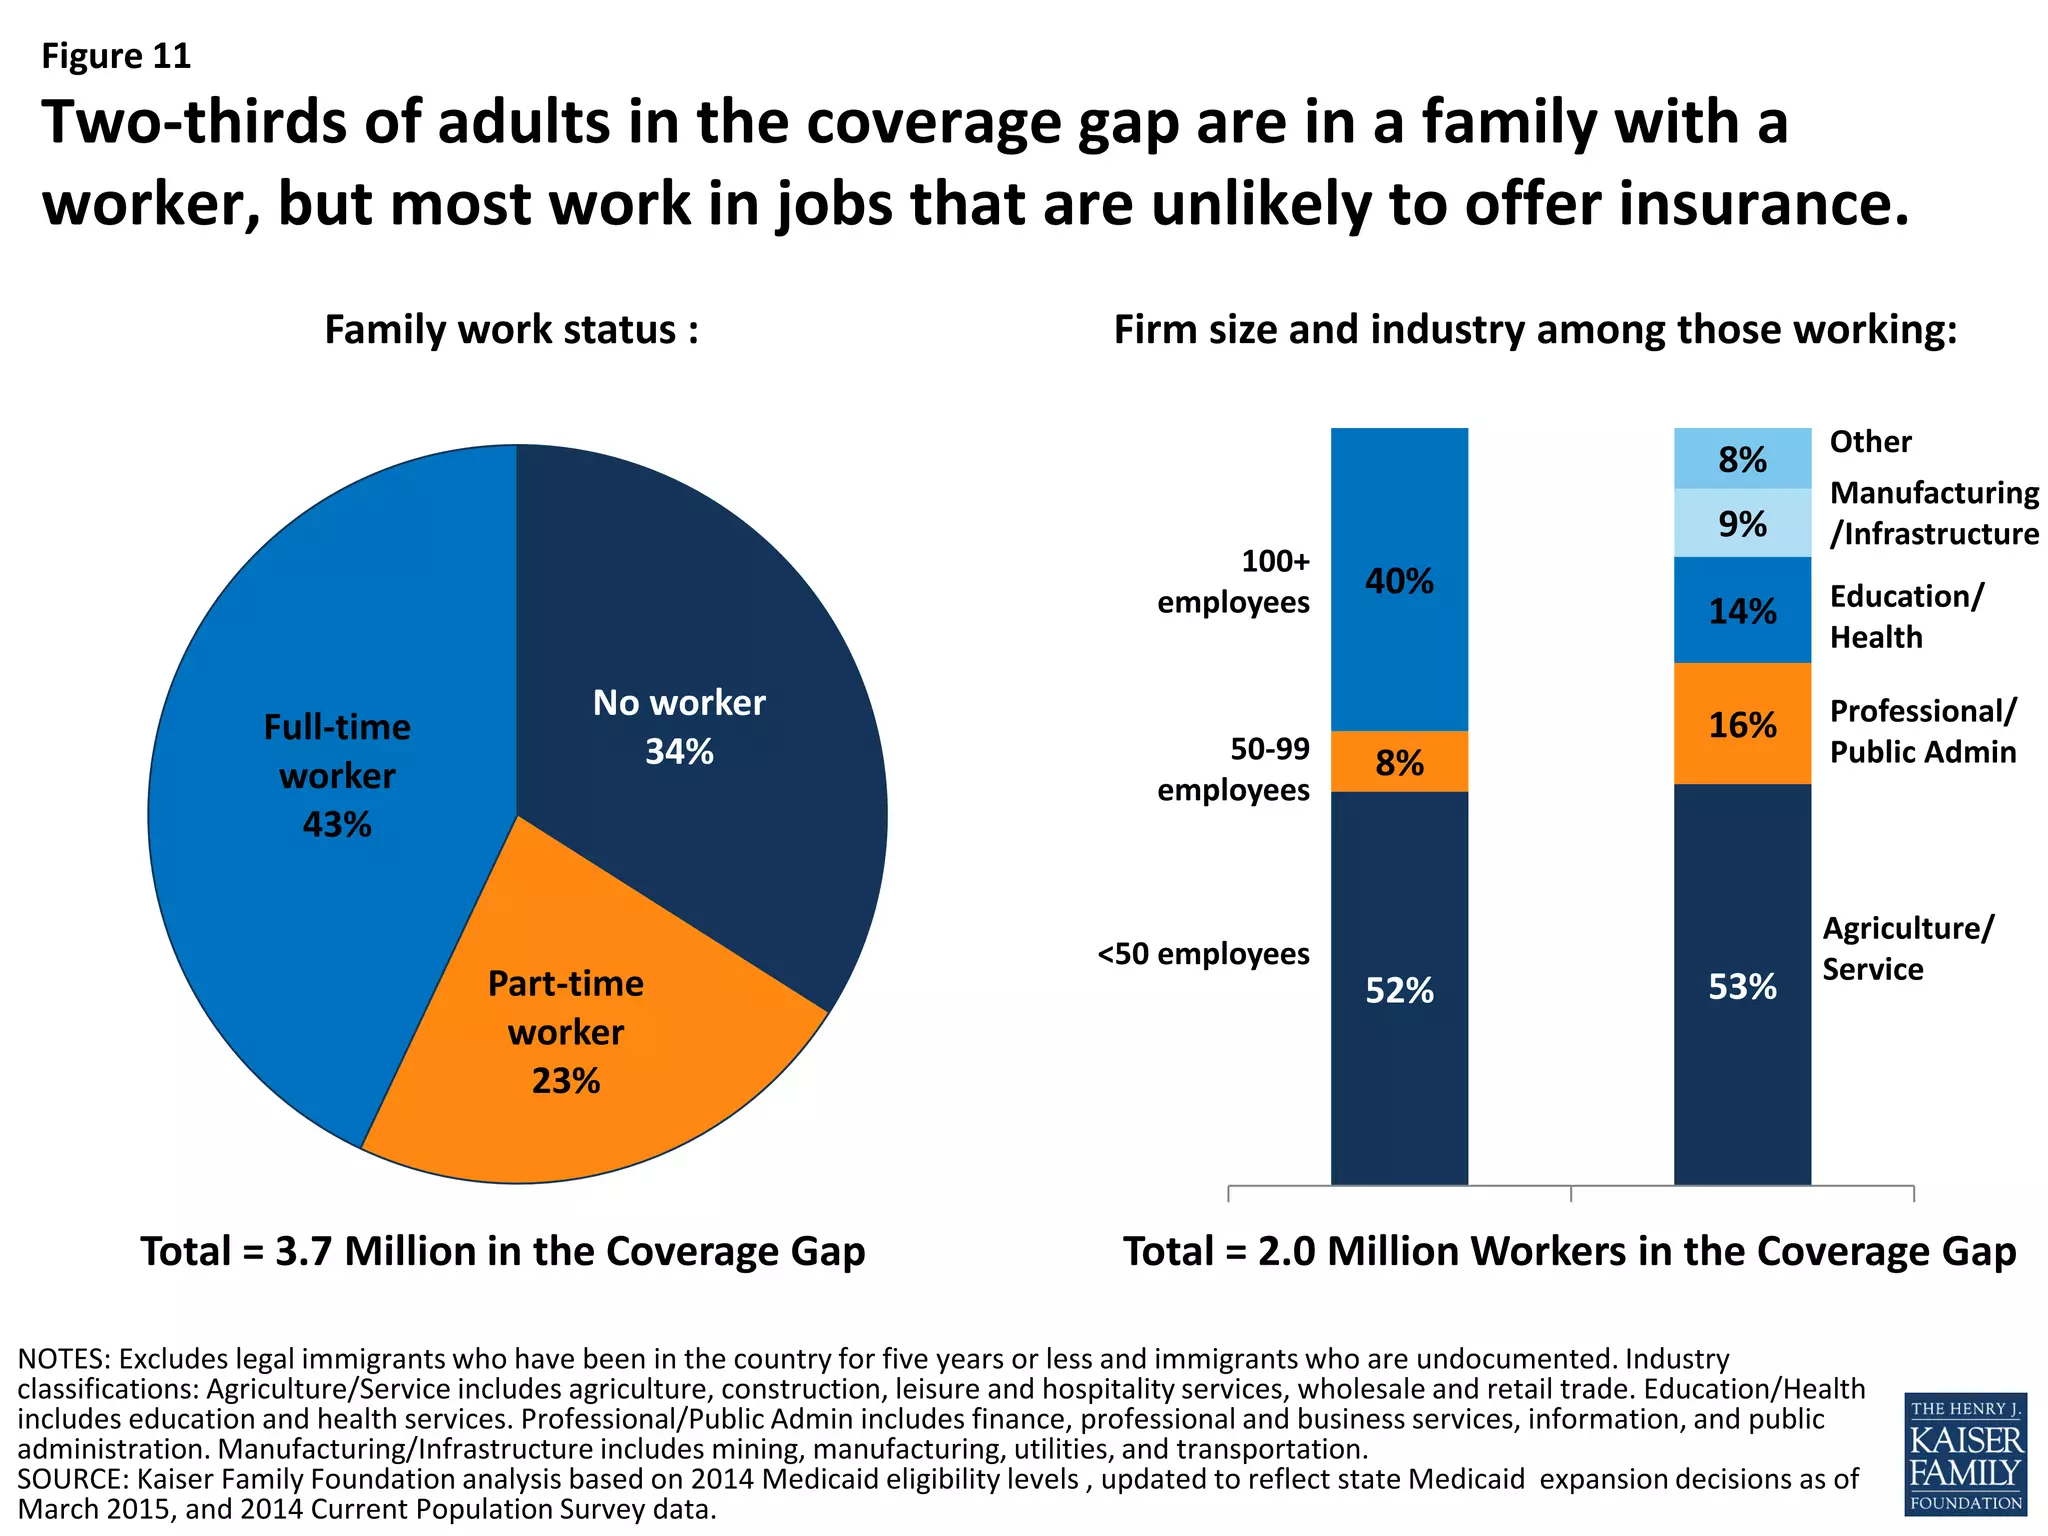
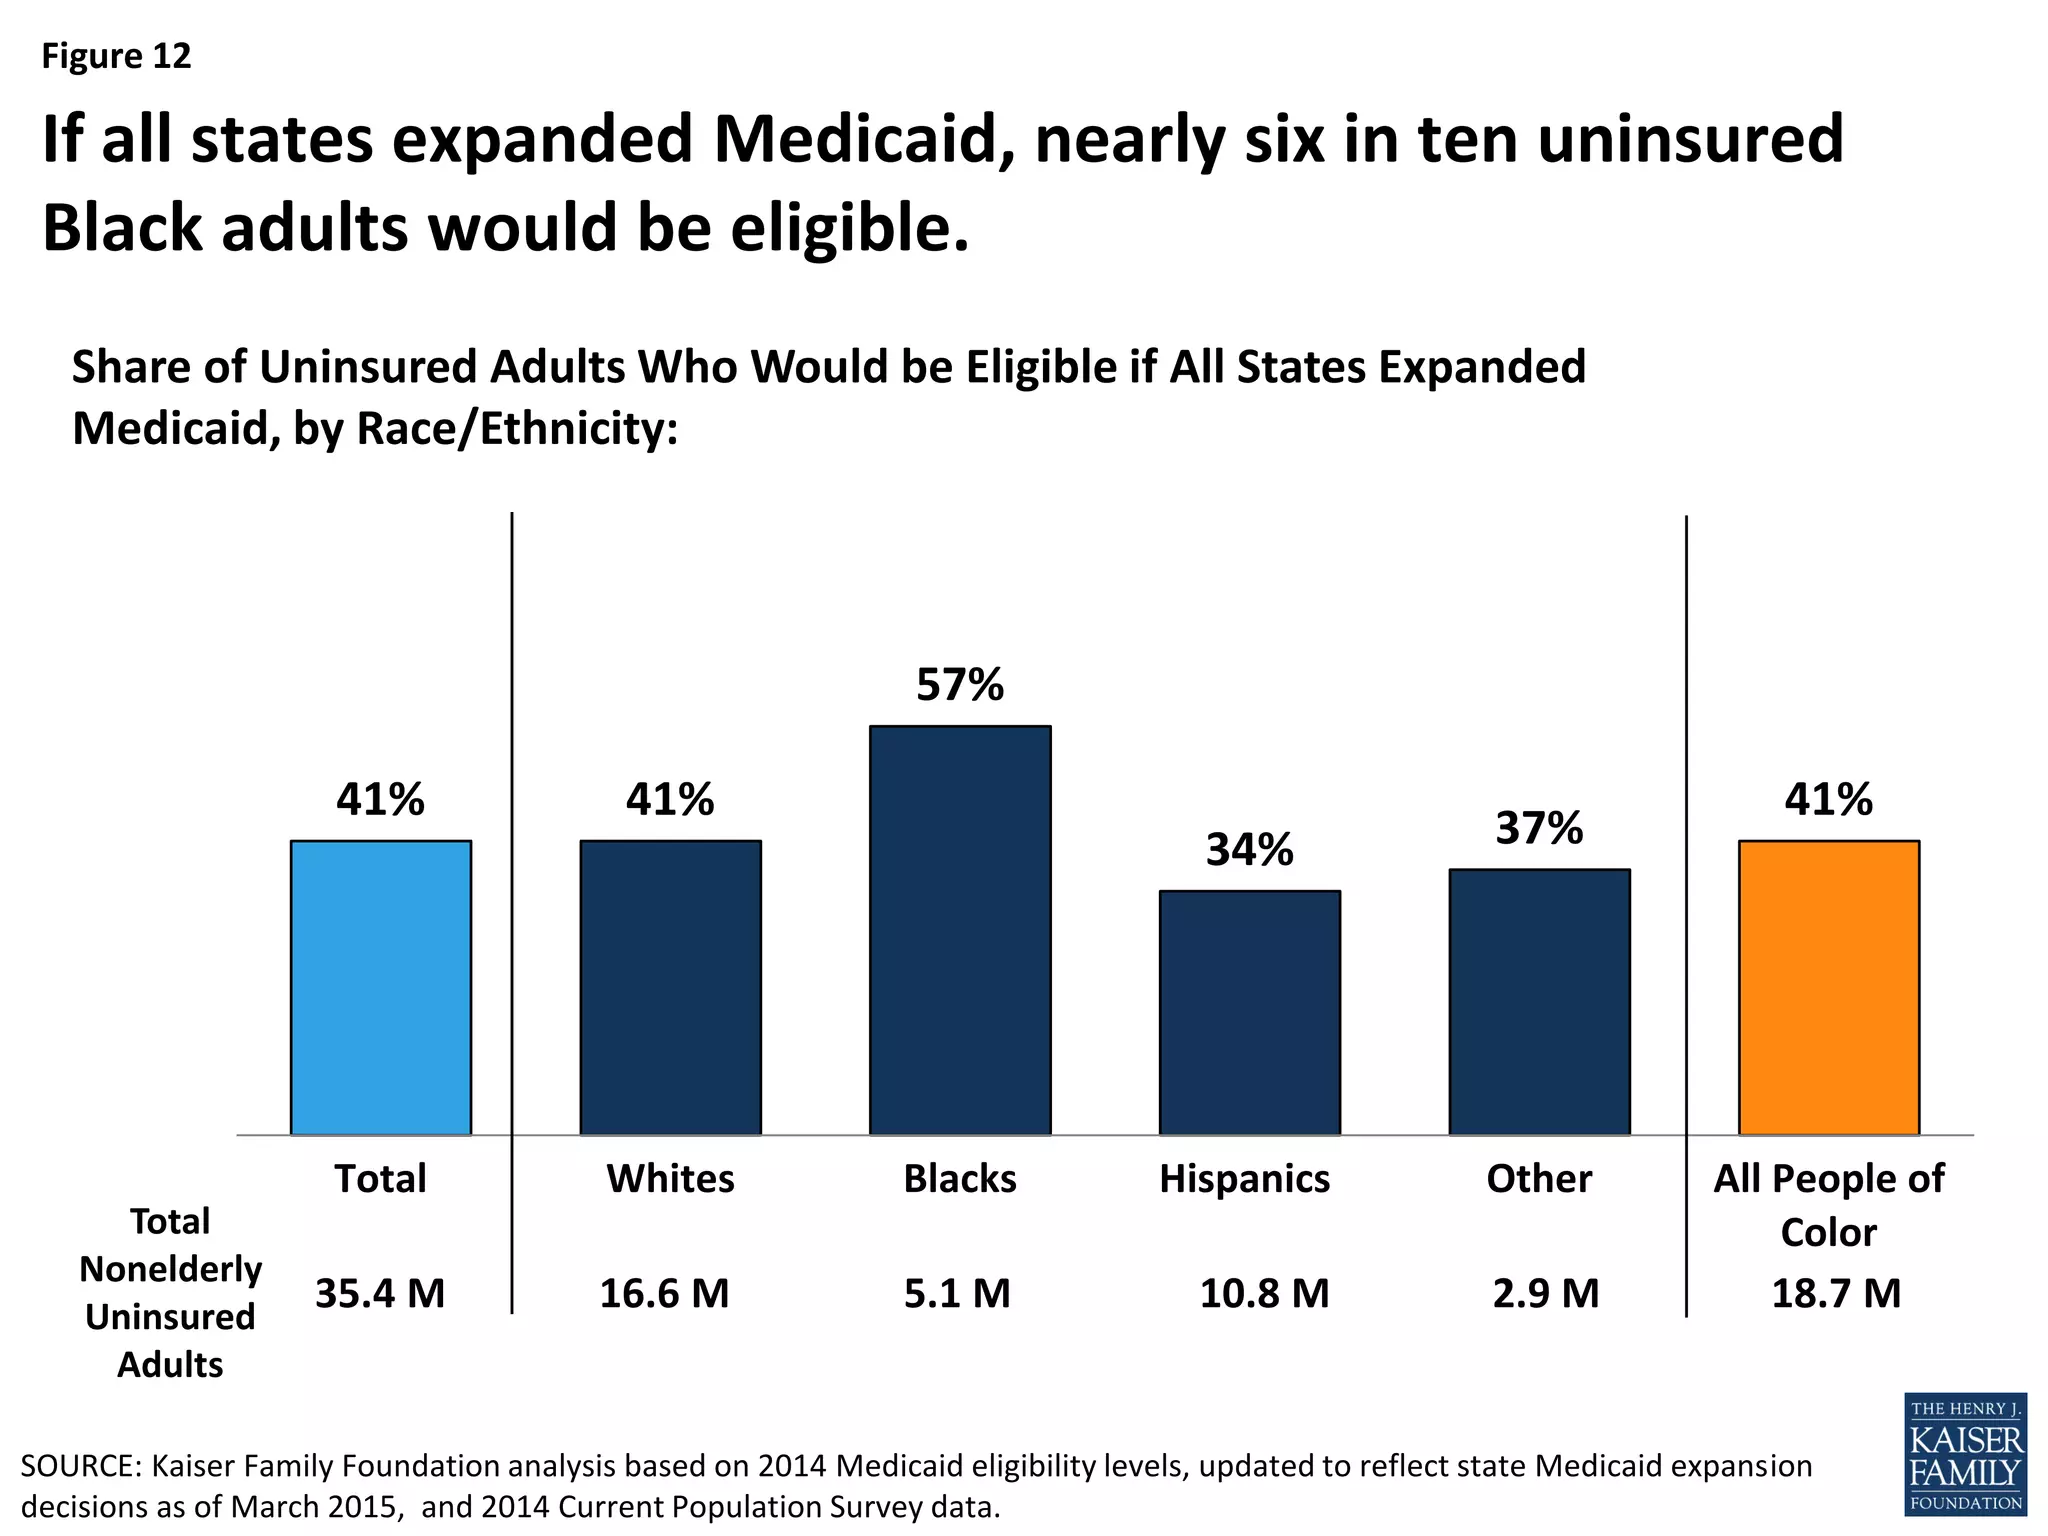
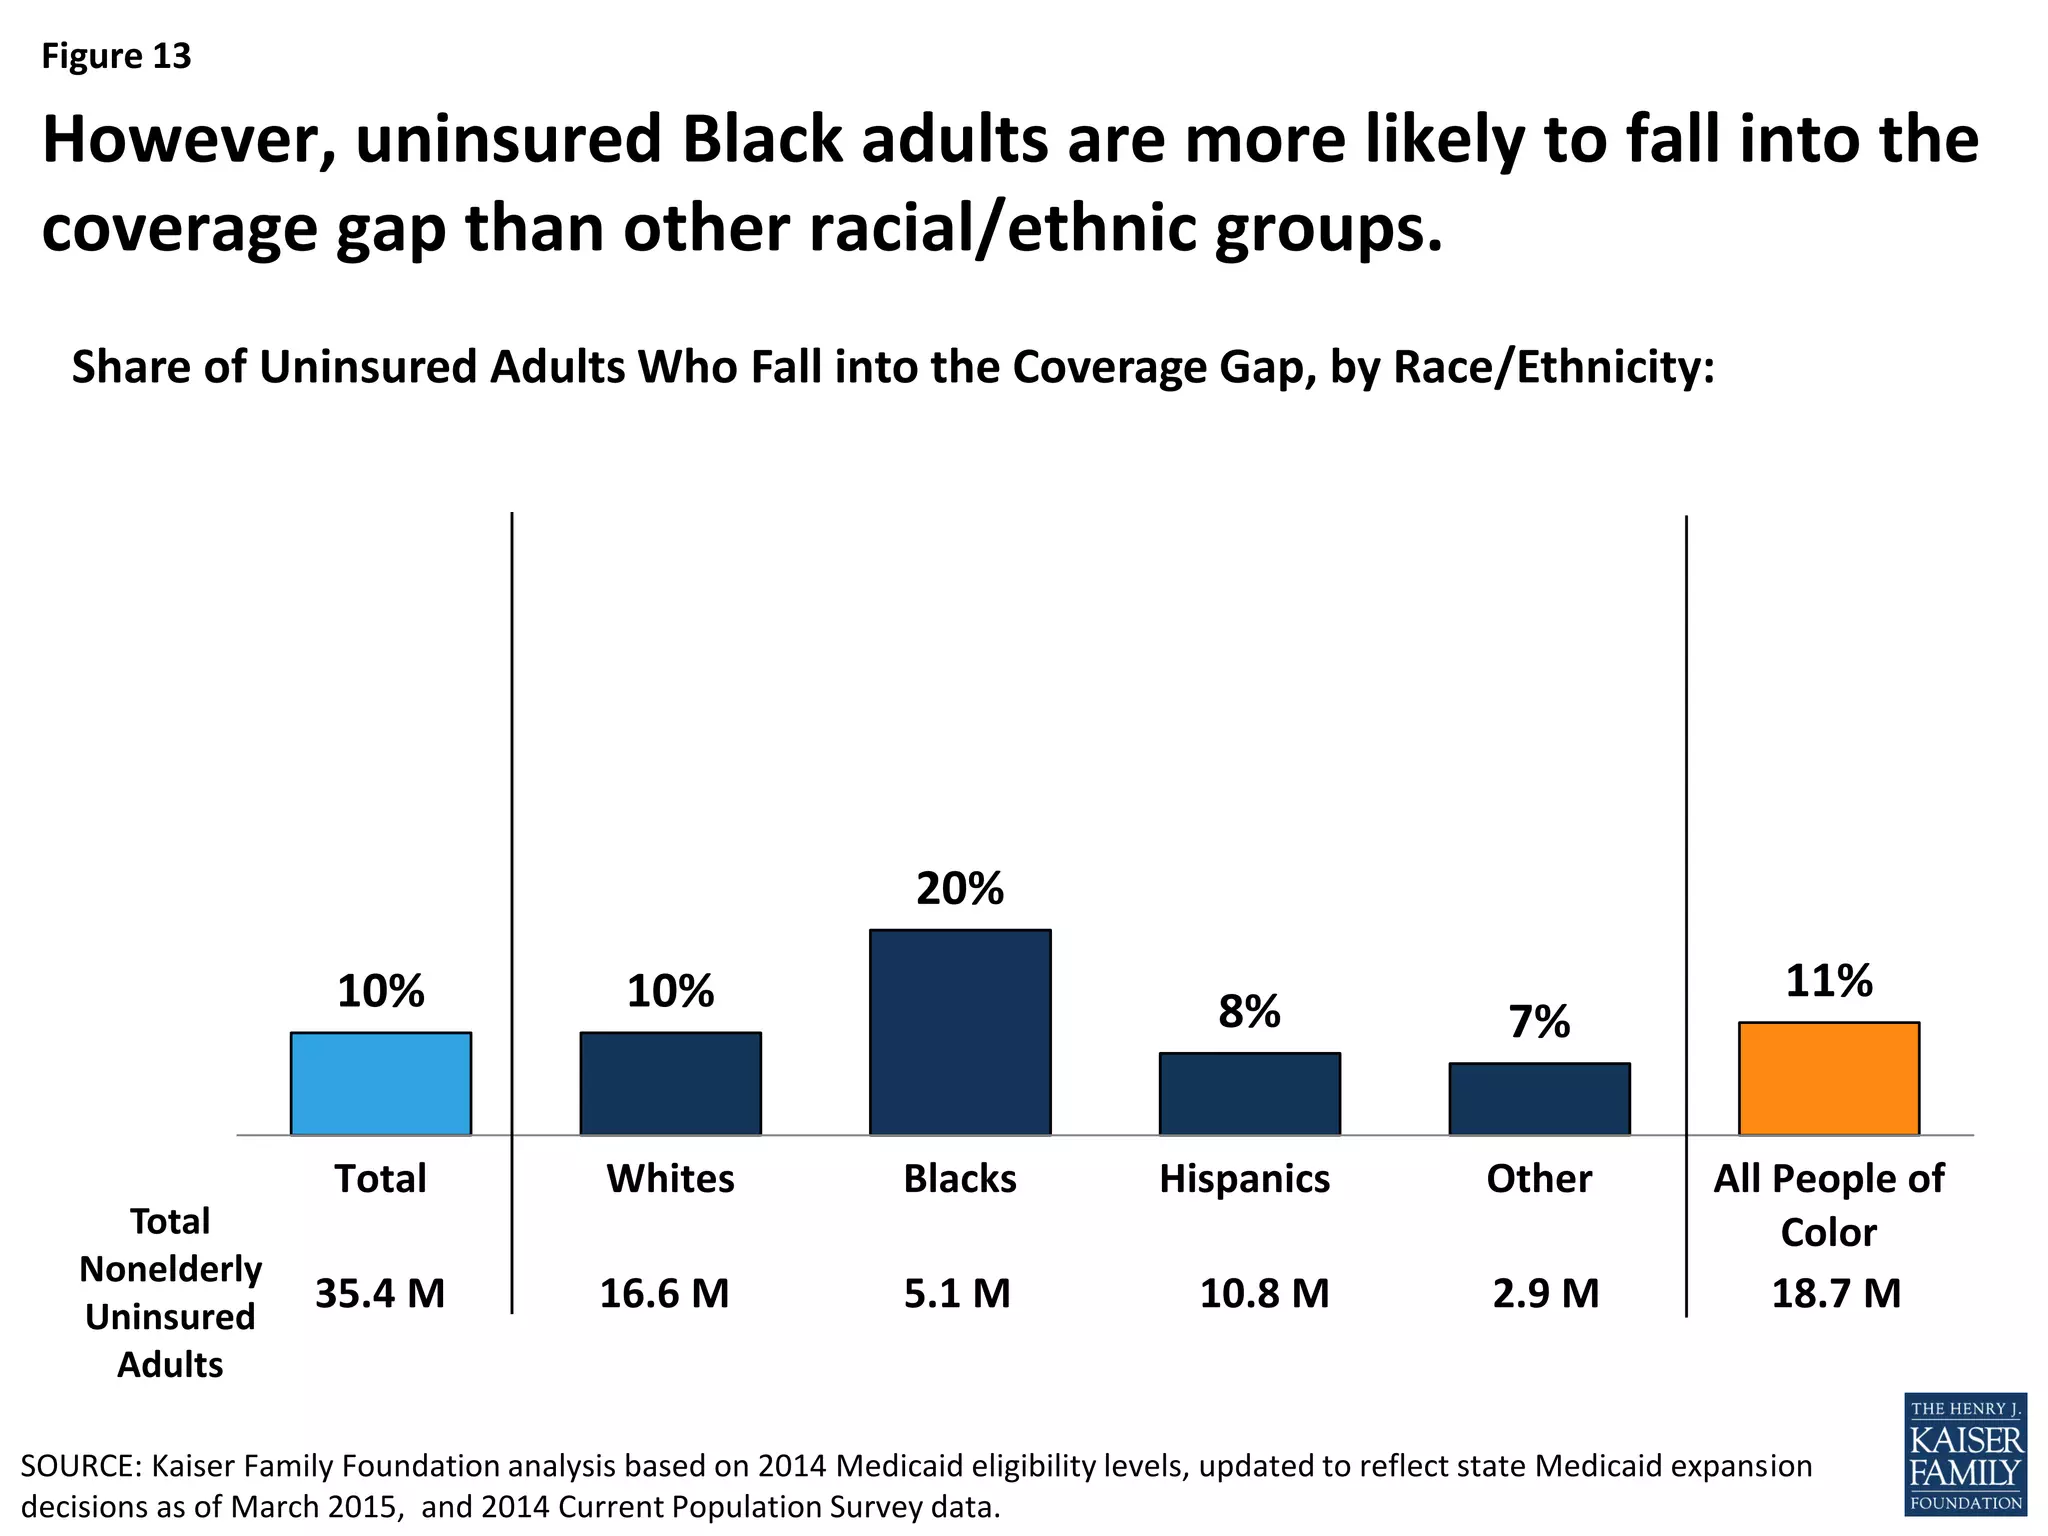
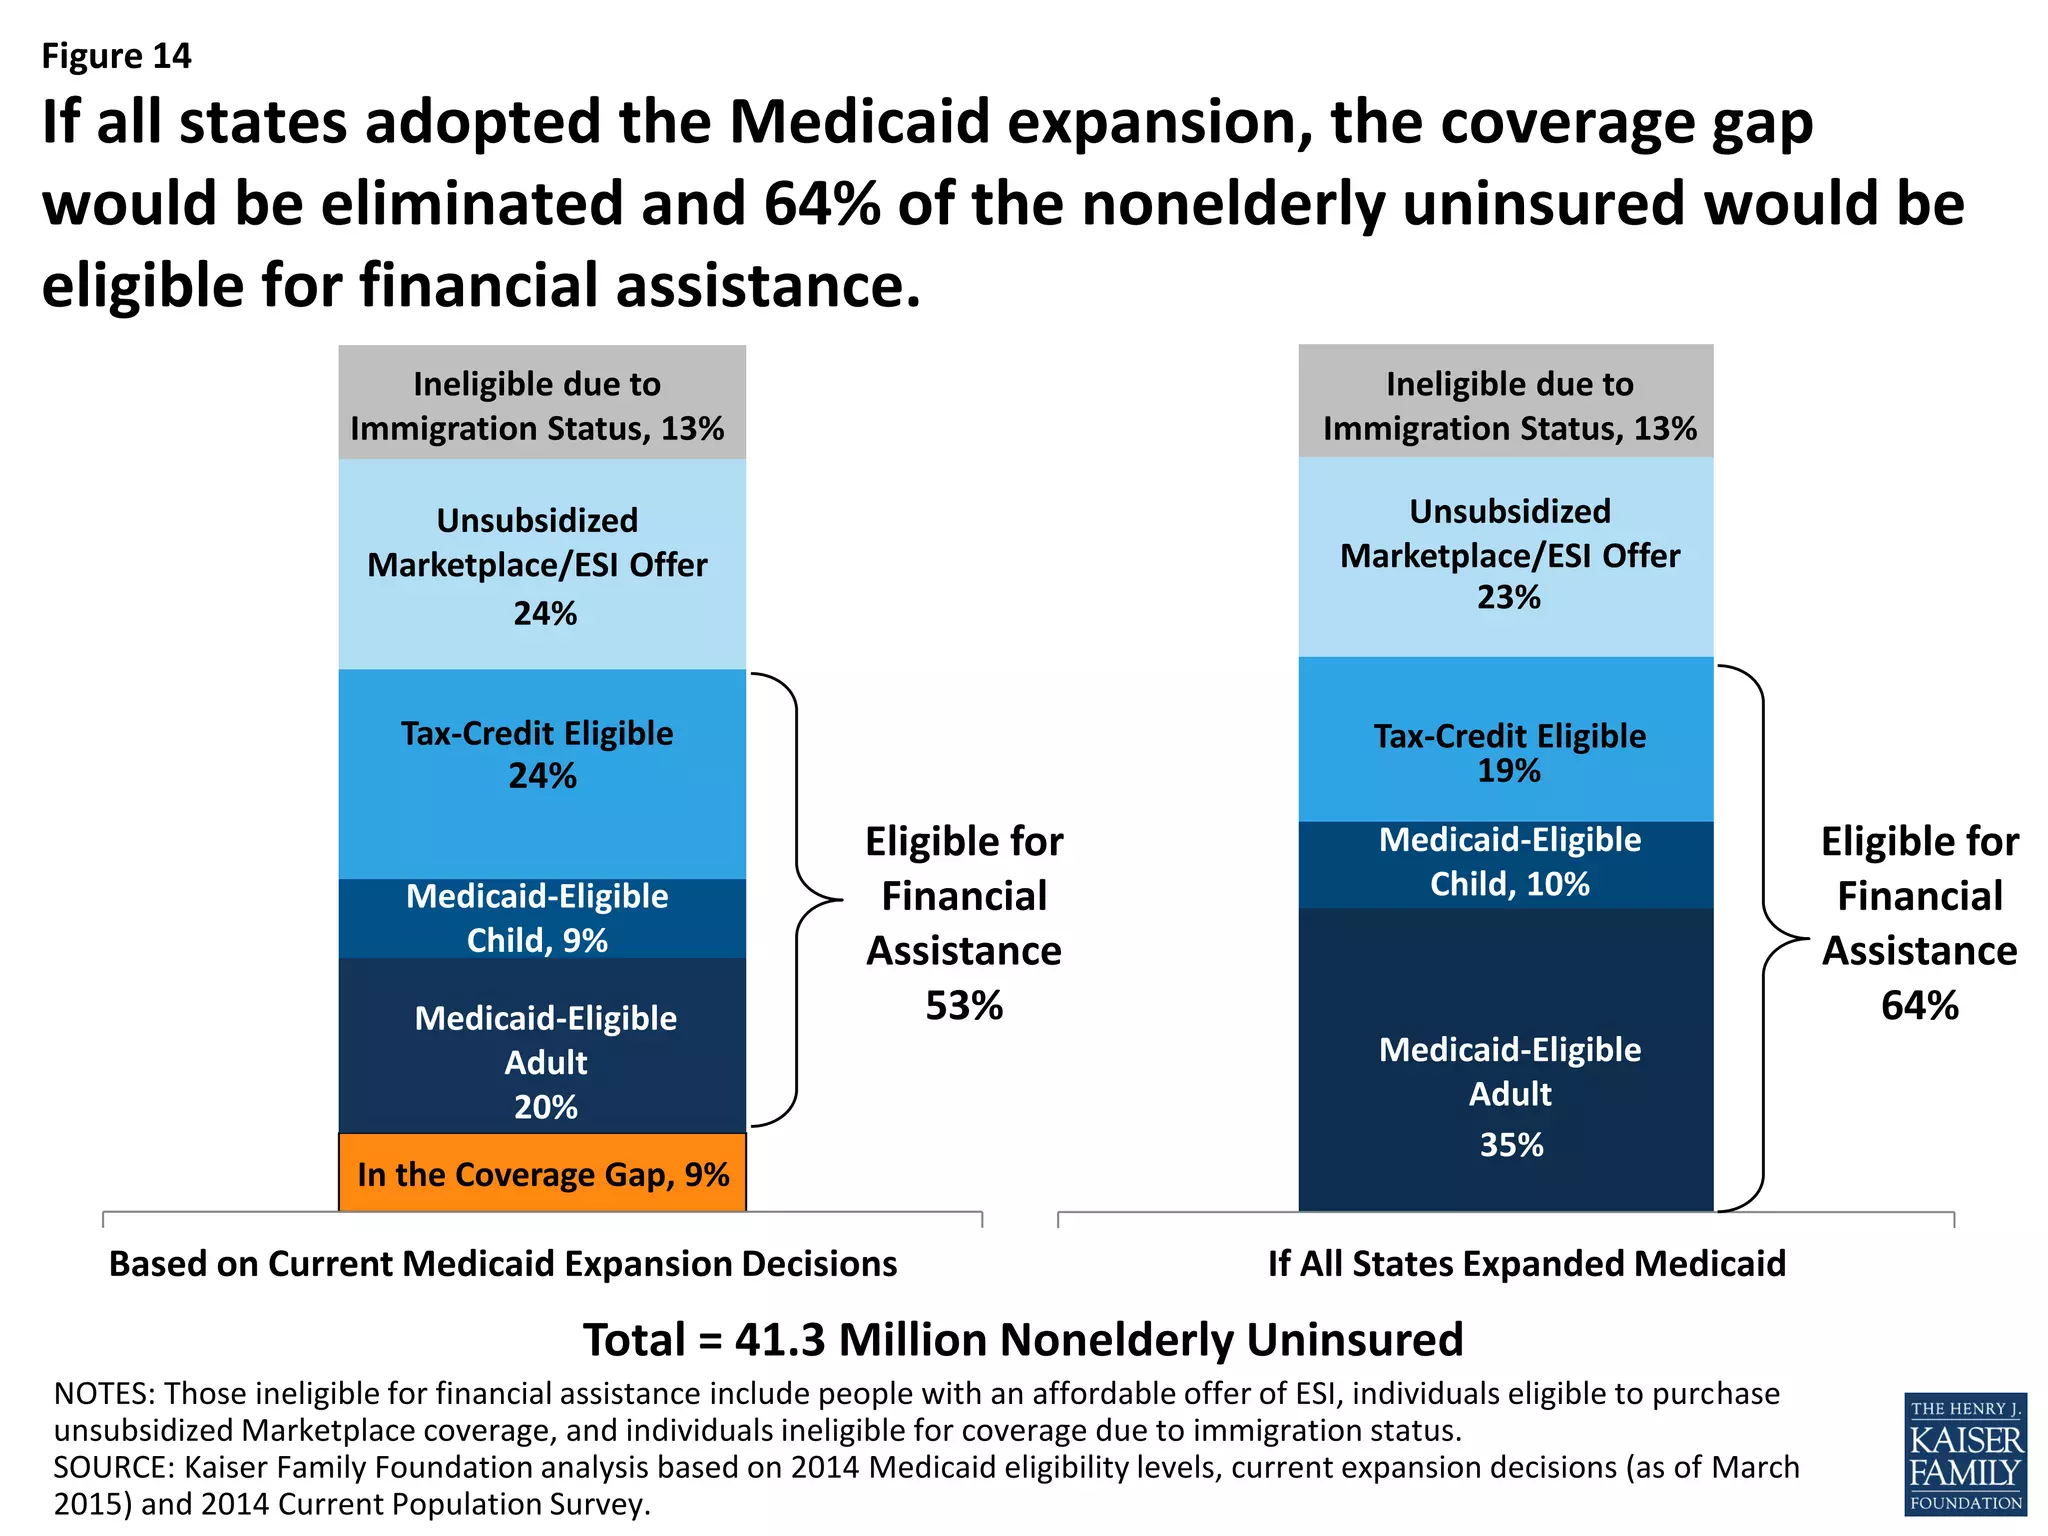

- An estimated 3.7 million nonelderly adults fall into the coverage gap where they earn too much to qualify for Medicaid in states that did not expand Medicaid under the ACA, but too little to qualify for subsidies to purchase insurance through the Marketplaces. - Over half of the adults in the coverage gap are people of color, especially Black adults who are more likely to fall into the coverage gap than other racial/ethnic groups. - If all states adopted the Medicaid expansion, the coverage gap would be eliminated and 64% of the nonelderly uninsured would be eligible for financial assistance to obtain health insurance.