SlideShare a Scribd company logo
1 of 3
Download to read offline
To: Southwestern Financial Analyst Program
From: Egan Cornachione
Date: July 9, 2015
Subject: Dorsey Wright Market Technical Indicators Report
This memo contains a summary of the market indicators that are relevant to the FAP portfolio.
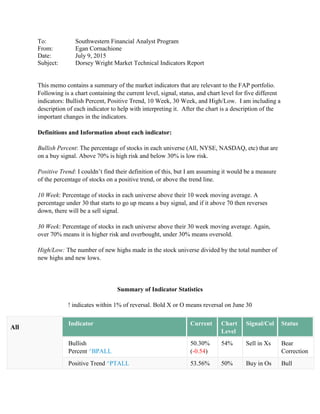
Following is a chart containing the current level, signal, status, and chart level for five different
indicators: Bullish Percent, Positive Trend, 10 Week, 30 Week, and High/Low. I am including a
description of each indicator to help with interpreting it. After the chart is a description of the
important changes in the indicators.
Definitions and Information about each indicator:
Bullish Percent: The percentage of stocks in each universe (All, NYSE, NASDAQ, etc) that are
on a buy signal. Above 70% is high risk and below 30% is low risk.
Positive Trend: I couldn’t find their definition of this, but I am assuming it would be a measure
of the percentage of stocks on a positive trend, or above the trend line.
10 Week: Percentage of stocks in each universe above their 10 week moving average. A
percentage under 30 that starts to go up means a buy signal, and if it above 70 then reverses
down, there will be a sell signal.
30 Week: Percentage of stocks in each universe above their 30 week moving average. Again,
over 70% means it is higher risk and overbought, under 30% means oversold.
High/Low: The number of new highs made in the stock universe divided by the total number of
new highs and new lows.
Summary of Indicator Statistics
! indicates within 1% of reversal. Bold X or O means reversal on June 30
All
Indicator Current Chart
Level
Signal/Col Status
Bullish
Percent ^BPALL
50.30%
(-0.54)
54% Sell in Xs Bear
Correction
Positive Trend ^PTALL 53.56% 50% Buy in Os Bull
(-0.24) Correction
10 Week ^TWALL 36.13%
(+2.25)
34% Sell in Os Bear
Confirmed
30 Week ^30ALL 44.87%
(+0.66)
46% Sell in Os Bear
Confirmed
High/Low ^ALLHILO 56.44%
(-4.58)
58% Sell in Os Bear
Confirmed
New York Stock
Exchange
Indicator Current Chart
Level
Signal/Col Status
Bullish
Percent ^BPNYSE
52.19%
(-0.72)
54% Sell in Os Bear
Confirmed
Positive
Trend ^PTNYSE
59.36%
(-0.24)
62% Buy in Xs Bull
Confirmed
10 Week ^TWNYSE 29.61%
(+2.52)
28% Sell in Os Bear
Confirmed
30 Week ^30NYSE 40.92%
(+0.66)
42% Sell in Os Bear
Confirmed
High/Low ^NYSEHILO 49.05%
(-3.64)
50% Sell in Os Bear
Confirmed
NASDAQ/OTC
Indicator Current Chart
Level
Signal/Col Status
Bullish
Percent ^BPOTC
50.57%
(-0.40)
52% Sell in Xs Bear
Correction
Positive Trend ^PTOTC 51.82%
(-0.20)
52% Buy in Xs Bull
Confirmed
10 Week ^TWOTC 40.79%
(+2.12)
40% Sell in Os Bear
Confirmed
30 Week ^30OTC 48.39%
(+0.75)
48% Buy in Os Bull
Correction
High/Low ^OTCHILO 68.04%
(-5.04)
70% Sell in Os Bear
Confirmed
World
Indicator Current Chart
Level
Signal/Col Status
Indicators Bullish
Percent ^BPWORLD
44.05%
(-0.62)
46% Buy in Os Bull
Correction
! Positive
Trend ^PTWORLD
50.33%
(-0.57)
56% Buy in Xs Bull
Confirmed
10 Week ^TWWORLD 34.15%
(+2.32)
32% Sell in Os Bear
Confirmed
30 Week ^30WORLD 47.48%
(+0.98)
48% Buy in Os Bull
Correction
High/Low
^WORLDHILO
No data available
Several changes occurred over the month of June
 All Stocks
o Went from a Bull Correction to Bear Confirmed on the 30-week, and now have a
sell in O’s signal, with a chart level at 46%, down from 52% at the beginning of
the month
o The 10 week chart level went down from 44% to 34% and is now a sell in O’s
 NYSE
o Bullish Percent, 30 Week, and HiLo are all now Bear Confirmed and Sell in O’s
 NASDAQ/OTC
o HiLo is at 70% of chart level and is Bear Confirmed with a Sell in O’s signal
(seems like it is more bullish than NYSE)
 World Indicators
o 10 week is Bear Confirmed while the 30 week is Bull Corrected, so still bullish
and a Buy in O’s signal
o Looking into the first week of July, World indicators have significantly dropped
and are Bear Confirmed for 10 and 30 weeks and Bull Corrected for Bullish
Percent and Positive Trend
Overall, it seems as though the market is turning bearish, with most indicators dropping and
switching to sell signals over the month.

More Related Content

What's hot

March 15, 2015 with charts
March 15, 2015 with chartsMarch 15, 2015 with charts
March 15, 2015 with chartsScutify
 
December 14, 2015.docx with charts
December 14, 2015.docx with chartsDecember 14, 2015.docx with charts
December 14, 2015.docx with chartsScutify
 
March 27, 2016.docx with charts
March 27, 2016.docx with chartsMarch 27, 2016.docx with charts
March 27, 2016.docx with chartsScutify
 
Strategy - SPX Rollover Performance - July 2016
Strategy - SPX Rollover Performance - July 2016Strategy - SPX Rollover Performance - July 2016
Strategy - SPX Rollover Performance - July 2016Daniel Mancia Nunes
 
October 18, 2015 with charts
October 18, 2015 with chartsOctober 18, 2015 with charts
October 18, 2015 with chartsScutify
 
April 17, 2016.docx with charts jcy edits
April 17, 2016.docx with charts jcy editsApril 17, 2016.docx with charts jcy edits
April 17, 2016.docx with charts jcy editsScutify
 
July 31, 2016.docx with charts
July 31, 2016.docx with chartsJuly 31, 2016.docx with charts
July 31, 2016.docx with chartsScutify
 
May 1, 2016.docx with charts
May 1, 2016.docx with chartsMay 1, 2016.docx with charts
May 1, 2016.docx with chartsScutify
 
September 14, 2014 with charts
September 14, 2014 with chartsSeptember 14, 2014 with charts
September 14, 2014 with chartsScutify
 
November 22, 2015 with charts
November 22, 2015 with chartsNovember 22, 2015 with charts
November 22, 2015 with chartsScutify
 
September 4, 2016.docx with charts
September 4, 2016.docx with chartsSeptember 4, 2016.docx with charts
September 4, 2016.docx with chartsScutify
 
July 10, 2016.docx with charts
July 10, 2016.docx with chartsJuly 10, 2016.docx with charts
July 10, 2016.docx with chartsScutify
 
April 5, 2015 with charts
April 5, 2015 with chartsApril 5, 2015 with charts
April 5, 2015 with chartsScutify
 
June 19, 2016.docx with charts
June 19, 2016.docx with chartsJune 19, 2016.docx with charts
June 19, 2016.docx with chartsScutify
 
Are markets setting up for a dollar rally this week?
Are markets setting up for a dollar rally this week?Are markets setting up for a dollar rally this week?
Are markets setting up for a dollar rally this week?Richard Perry
 
June 26, 2016 edited.docx with charts
June 26, 2016 edited.docx with chartsJune 26, 2016 edited.docx with charts
June 26, 2016 edited.docx with chartsScutify
 
April 10, 2016
April 10, 2016April 10, 2016
April 10, 2016Scutify
 
Deceember 28,2015 with charts
Deceember 28,2015 with chartsDeceember 28,2015 with charts
Deceember 28,2015 with chartsScutify
 
Market behavior research @ bec doms
Market behavior research @ bec domsMarket behavior research @ bec doms
Market behavior research @ bec domsBabasab Patil
 

What's hot (20)

March 15, 2015 with charts
March 15, 2015 with chartsMarch 15, 2015 with charts
March 15, 2015 with charts
 
December 14, 2015.docx with charts
December 14, 2015.docx with chartsDecember 14, 2015.docx with charts
December 14, 2015.docx with charts
 
March 27, 2016.docx with charts
March 27, 2016.docx with chartsMarch 27, 2016.docx with charts
March 27, 2016.docx with charts
 
Strategy - SPX Rollover Performance - July 2016
Strategy - SPX Rollover Performance - July 2016Strategy - SPX Rollover Performance - July 2016
Strategy - SPX Rollover Performance - July 2016
 
Base effect
Base effectBase effect
Base effect
 
October 18, 2015 with charts
October 18, 2015 with chartsOctober 18, 2015 with charts
October 18, 2015 with charts
 
April 17, 2016.docx with charts jcy edits
April 17, 2016.docx with charts jcy editsApril 17, 2016.docx with charts jcy edits
April 17, 2016.docx with charts jcy edits
 
July 31, 2016.docx with charts
July 31, 2016.docx with chartsJuly 31, 2016.docx with charts
July 31, 2016.docx with charts
 
May 1, 2016.docx with charts
May 1, 2016.docx with chartsMay 1, 2016.docx with charts
May 1, 2016.docx with charts
 
September 14, 2014 with charts
September 14, 2014 with chartsSeptember 14, 2014 with charts
September 14, 2014 with charts
 
November 22, 2015 with charts
November 22, 2015 with chartsNovember 22, 2015 with charts
November 22, 2015 with charts
 
September 4, 2016.docx with charts
September 4, 2016.docx with chartsSeptember 4, 2016.docx with charts
September 4, 2016.docx with charts
 
July 10, 2016.docx with charts
July 10, 2016.docx with chartsJuly 10, 2016.docx with charts
July 10, 2016.docx with charts
 
April 5, 2015 with charts
April 5, 2015 with chartsApril 5, 2015 with charts
April 5, 2015 with charts
 
June 19, 2016.docx with charts
June 19, 2016.docx with chartsJune 19, 2016.docx with charts
June 19, 2016.docx with charts
 
Are markets setting up for a dollar rally this week?
Are markets setting up for a dollar rally this week?Are markets setting up for a dollar rally this week?
Are markets setting up for a dollar rally this week?
 
June 26, 2016 edited.docx with charts
June 26, 2016 edited.docx with chartsJune 26, 2016 edited.docx with charts
June 26, 2016 edited.docx with charts
 
April 10, 2016
April 10, 2016April 10, 2016
April 10, 2016
 
Deceember 28,2015 with charts
Deceember 28,2015 with chartsDeceember 28,2015 with charts
Deceember 28,2015 with charts
 
Market behavior research @ bec doms
Market behavior research @ bec domsMarket behavior research @ bec doms
Market behavior research @ bec doms
 

Viewers also liked (9)

certificate
certificatecertificate
certificate
 
Oportunitats de negoci al Regne Unit
Oportunitats de negoci al Regne UnitOportunitats de negoci al Regne Unit
Oportunitats de negoci al Regne Unit
 
Toekomst Van Vastgoedmarketing
Toekomst Van VastgoedmarketingToekomst Van Vastgoedmarketing
Toekomst Van Vastgoedmarketing
 
About Solvis
About SolvisAbout Solvis
About Solvis
 
Webinar Identity management Solvis Consulting - Gigya
Webinar Identity management Solvis Consulting - GigyaWebinar Identity management Solvis Consulting - Gigya
Webinar Identity management Solvis Consulting - Gigya
 
Medteq Industrial R&D and Innovation Consortium
Medteq Industrial R&D and Innovation ConsortiumMedteq Industrial R&D and Innovation Consortium
Medteq Industrial R&D and Innovation Consortium
 
Argentina, oportunitats de negoci (2)
Argentina, oportunitats de negoci (2)Argentina, oportunitats de negoci (2)
Argentina, oportunitats de negoci (2)
 
whitepaper_workday_technology_platform_devt_process
whitepaper_workday_technology_platform_devt_processwhitepaper_workday_technology_platform_devt_process
whitepaper_workday_technology_platform_devt_process
 
Oportunitats internacionals en el sector tèxtil i moda
Oportunitats internacionals en el sector tèxtil i modaOportunitats internacionals en el sector tèxtil i moda
Oportunitats internacionals en el sector tèxtil i moda
 

Similar to June Market Technician Report

Growth data to drive markets this week
Growth data to drive markets this weekGrowth data to drive markets this week
Growth data to drive markets this weekHantec Markets
 
Nepse Technical Analysis December 20 - December 24, 2015
Nepse Technical Analysis December 20 - December 24, 2015Nepse Technical Analysis December 20 - December 24, 2015
Nepse Technical Analysis December 20 - December 24, 2015Prajwal Tuladhar
 
US inflation and new Fed chair in focus this week
US inflation and new Fed chair in focus this weekUS inflation and new Fed chair in focus this week
US inflation and new Fed chair in focus this weekRichard Perry
 

Similar to June Market Technician Report (20)

Nepse Technical Analysis August 2 - August 7, 2015
Nepse Technical Analysis August 2 - August 7, 2015Nepse Technical Analysis August 2 - August 7, 2015
Nepse Technical Analysis August 2 - August 7, 2015
 
Nepse Technical Analysis March 20, 2016 - March 24, 2016
Nepse Technical Analysis March 20, 2016 - March  24, 2016Nepse Technical Analysis March 20, 2016 - March  24, 2016
Nepse Technical Analysis March 20, 2016 - March 24, 2016
 
Nepse Technical Analysis July 19 - July 23, 2015
Nepse Technical Analysis July 19 - July 23, 2015Nepse Technical Analysis July 19 - July 23, 2015
Nepse Technical Analysis July 19 - July 23, 2015
 
Growth data to drive markets this week
Growth data to drive markets this weekGrowth data to drive markets this week
Growth data to drive markets this week
 
Nepse Technical Analysis December 20 - December 24, 2015
Nepse Technical Analysis December 20 - December 24, 2015Nepse Technical Analysis December 20 - December 24, 2015
Nepse Technical Analysis December 20 - December 24, 2015
 
Nepse Technical Analysis December 27 - December 31, 2015
Nepse Technical Analysis December 27 - December 31, 2015Nepse Technical Analysis December 27 - December 31, 2015
Nepse Technical Analysis December 27 - December 31, 2015
 
Nepse Technical Analysis 26 July - 30 July, 2015
Nepse Technical Analysis 26 July - 30 July, 2015Nepse Technical Analysis 26 July - 30 July, 2015
Nepse Technical Analysis 26 July - 30 July, 2015
 
Nepse Technical Analysis April 24 - April 28, 2016
Nepse Technical Analysis April 24 - April 28, 2016Nepse Technical Analysis April 24 - April 28, 2016
Nepse Technical Analysis April 24 - April 28, 2016
 
Nepse Technical Analysis June 19 - June 23, 2016
Nepse Technical Analysis June 19 - June 23, 2016Nepse Technical Analysis June 19 - June 23, 2016
Nepse Technical Analysis June 19 - June 23, 2016
 
Nepse Technical Analysis March 13 - March 17, 2016
Nepse Technical Analysis March 13 - March 17, 2016Nepse Technical Analysis March 13 - March 17, 2016
Nepse Technical Analysis March 13 - March 17, 2016
 
Market Outlook
Market OutlookMarket Outlook
Market Outlook
 
Nepse Technical Analysis December 13 - December 17, 2015
Nepse Technical Analysis December 13 - December 17, 2015Nepse Technical Analysis December 13 - December 17, 2015
Nepse Technical Analysis December 13 - December 17, 2015
 
US inflation and new Fed chair in focus this week
US inflation and new Fed chair in focus this weekUS inflation and new Fed chair in focus this week
US inflation and new Fed chair in focus this week
 
Nepse Technical Analysis July 12 - July 16, 2015
Nepse Technical Analysis July 12 - July 16, 2015Nepse Technical Analysis July 12 - July 16, 2015
Nepse Technical Analysis July 12 - July 16, 2015
 
Nepse Technical Analysis January 31 - February 4, 2016
Nepse Technical Analysis January 31 - February 4, 2016Nepse Technical Analysis January 31 - February 4, 2016
Nepse Technical Analysis January 31 - February 4, 2016
 
2017 TechnicalAnalysisStrategy
2017 TechnicalAnalysisStrategy2017 TechnicalAnalysisStrategy
2017 TechnicalAnalysisStrategy
 
Nepse Technical Analysis July 05 - July 09, 2015
Nepse Technical Analysis July 05 - July 09, 2015Nepse Technical Analysis July 05 - July 09, 2015
Nepse Technical Analysis July 05 - July 09, 2015
 
Techview June
Techview JuneTechview June
Techview June
 
Nepse Technical Analysis January 10 - January 14, 2016
Nepse Technical Analysis January 10 - January 14, 2016Nepse Technical Analysis January 10 - January 14, 2016
Nepse Technical Analysis January 10 - January 14, 2016
 
Nepse Technical Analysis August 30 - September 3, 2015
Nepse Technical Analysis August 30 - September 3, 2015Nepse Technical Analysis August 30 - September 3, 2015
Nepse Technical Analysis August 30 - September 3, 2015
 

June Market Technician Report

  • 1. To: Southwestern Financial Analyst Program From: Egan Cornachione Date: July 9, 2015 Subject: Dorsey Wright Market Technical Indicators Report This memo contains a summary of the market indicators that are relevant to the FAP portfolio. Following is a chart containing the current level, signal, status, and chart level for five different indicators: Bullish Percent, Positive Trend, 10 Week, 30 Week, and High/Low. I am including a description of each indicator to help with interpreting it. After the chart is a description of the important changes in the indicators. Definitions and Information about each indicator: Bullish Percent: The percentage of stocks in each universe (All, NYSE, NASDAQ, etc) that are on a buy signal. Above 70% is high risk and below 30% is low risk. Positive Trend: I couldn’t find their definition of this, but I am assuming it would be a measure of the percentage of stocks on a positive trend, or above the trend line. 10 Week: Percentage of stocks in each universe above their 10 week moving average. A percentage under 30 that starts to go up means a buy signal, and if it above 70 then reverses down, there will be a sell signal. 30 Week: Percentage of stocks in each universe above their 30 week moving average. Again, over 70% means it is higher risk and overbought, under 30% means oversold. High/Low: The number of new highs made in the stock universe divided by the total number of new highs and new lows. Summary of Indicator Statistics ! indicates within 1% of reversal. Bold X or O means reversal on June 30 All Indicator Current Chart Level Signal/Col Status Bullish Percent ^BPALL 50.30% (-0.54) 54% Sell in Xs Bear Correction Positive Trend ^PTALL 53.56% 50% Buy in Os Bull
  • 2. (-0.24) Correction 10 Week ^TWALL 36.13% (+2.25) 34% Sell in Os Bear Confirmed 30 Week ^30ALL 44.87% (+0.66) 46% Sell in Os Bear Confirmed High/Low ^ALLHILO 56.44% (-4.58) 58% Sell in Os Bear Confirmed New York Stock Exchange Indicator Current Chart Level Signal/Col Status Bullish Percent ^BPNYSE 52.19% (-0.72) 54% Sell in Os Bear Confirmed Positive Trend ^PTNYSE 59.36% (-0.24) 62% Buy in Xs Bull Confirmed 10 Week ^TWNYSE 29.61% (+2.52) 28% Sell in Os Bear Confirmed 30 Week ^30NYSE 40.92% (+0.66) 42% Sell in Os Bear Confirmed High/Low ^NYSEHILO 49.05% (-3.64) 50% Sell in Os Bear Confirmed NASDAQ/OTC Indicator Current Chart Level Signal/Col Status Bullish Percent ^BPOTC 50.57% (-0.40) 52% Sell in Xs Bear Correction Positive Trend ^PTOTC 51.82% (-0.20) 52% Buy in Xs Bull Confirmed 10 Week ^TWOTC 40.79% (+2.12) 40% Sell in Os Bear Confirmed 30 Week ^30OTC 48.39% (+0.75) 48% Buy in Os Bull Correction High/Low ^OTCHILO 68.04% (-5.04) 70% Sell in Os Bear Confirmed World Indicator Current Chart Level Signal/Col Status
  • 3. Indicators Bullish Percent ^BPWORLD 44.05% (-0.62) 46% Buy in Os Bull Correction ! Positive Trend ^PTWORLD 50.33% (-0.57) 56% Buy in Xs Bull Confirmed 10 Week ^TWWORLD 34.15% (+2.32) 32% Sell in Os Bear Confirmed 30 Week ^30WORLD 47.48% (+0.98) 48% Buy in Os Bull Correction High/Low ^WORLDHILO No data available Several changes occurred over the month of June  All Stocks o Went from a Bull Correction to Bear Confirmed on the 30-week, and now have a sell in O’s signal, with a chart level at 46%, down from 52% at the beginning of the month o The 10 week chart level went down from 44% to 34% and is now a sell in O’s  NYSE o Bullish Percent, 30 Week, and HiLo are all now Bear Confirmed and Sell in O’s  NASDAQ/OTC o HiLo is at 70% of chart level and is Bear Confirmed with a Sell in O’s signal (seems like it is more bullish than NYSE)  World Indicators o 10 week is Bear Confirmed while the 30 week is Bull Corrected, so still bullish and a Buy in O’s signal o Looking into the first week of July, World indicators have significantly dropped and are Bear Confirmed for 10 and 30 weeks and Bull Corrected for Bullish Percent and Positive Trend Overall, it seems as though the market is turning bearish, with most indicators dropping and switching to sell signals over the month.