Download to read offline
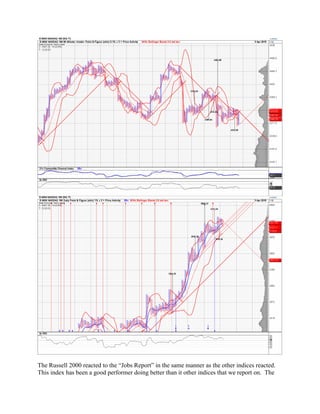
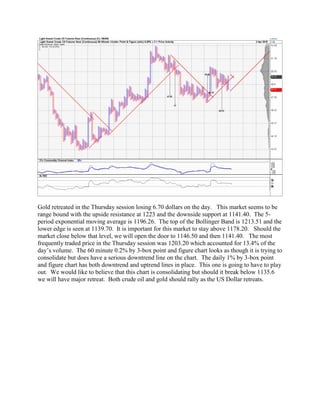
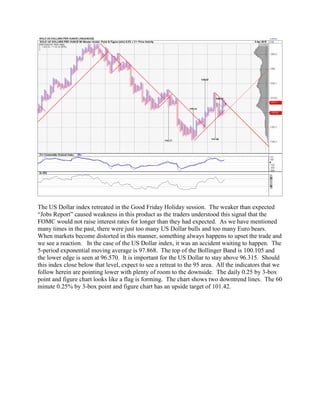

The document discusses current market conditions, emphasizing the upcoming earnings season and the impact of the strong US dollar on investments. It also highlights a softer employment report and its implications for interest rate hikes, suggesting that the real estate market may see slower deals as urgency decreases. Concerns about market corrections persist, particularly in light of recent index performances and commodity trading fluctuations.


