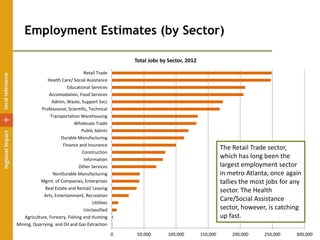
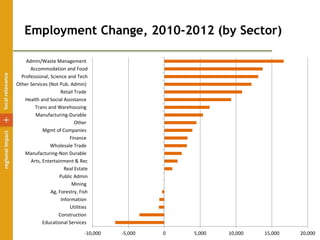
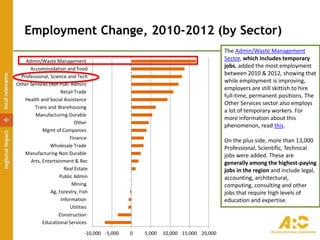
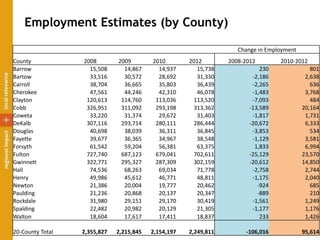
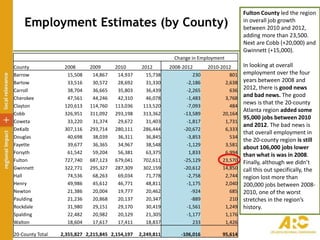
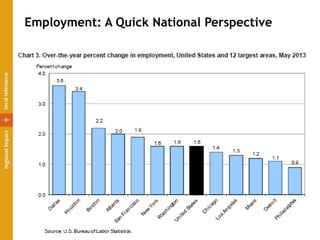
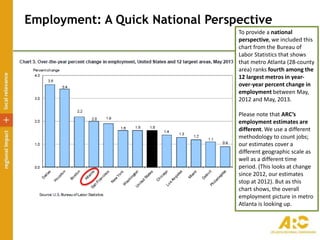
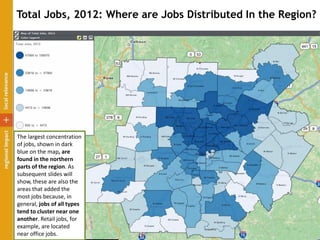
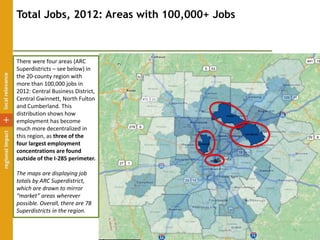
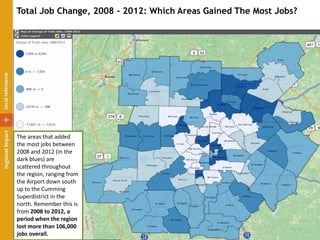
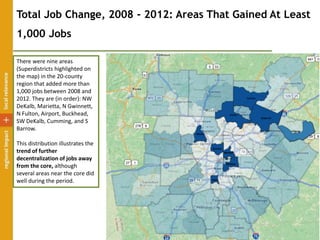
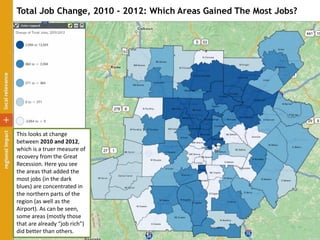
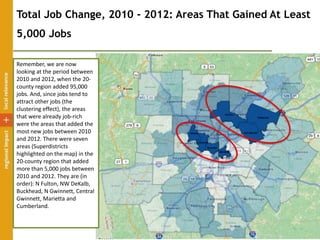
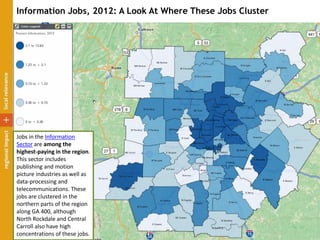
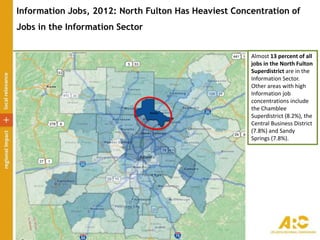
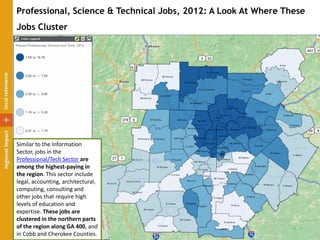
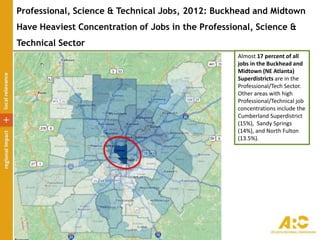
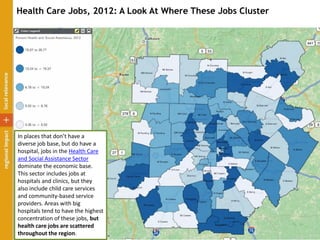
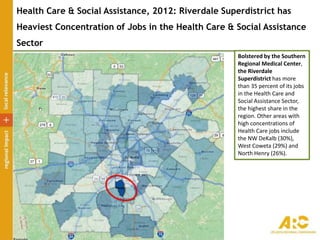
ARC's employment estimates are for 2012, and they include jobs-in-place, meaning we locate the jobs at the small-area, which provides more spatial detail and accuracy than other employment products.
Philip McCann - Cities, Regions & ProductivityOECD CFE
Presentation by Philip McCann, University of Sheffield, UK at the OECD Workshop on Spatial Dimensions of Productivity, 28-29 March 2019, Bolzano.
More info: https://oe.cd/GFPBolzano2019
Glasgow City Region - Enhancing ProductivityMartin Jack
Executive Summary
From the waterfront in Greenock to the farmlands of Lanarkshire, Glasgow City Region is the largest
metropolitan area in Scotland. Whilst there is still much to do, the Region is beginning to blossom as
it transforms from its industrial past. In doing so, it is benefitting from taking a regional approach to
addressing its challenges and taking advantage of economic opportunities.
Glasgow City Region is:
• Key to the success of the Scottish Economy – it provides 34% of the country’s jobs.
• Growing – it is expected to add another 30,000 jobs from 2017 to 2021. The largest growth rates are seen in the ICT, Engineering, Tourism, and Legal industries.
• Providing Quality Jobs – recent analysis by the Office of National Statistics shows that the region has the second highest proportion of ‘residents in quality work’, just behind the West of England Combined Authority.
• Increasingly Competitive – its productivity levels have grown by 30% in the last decade. It is currently projected to have higher productivity levels than other post -industrial regions in the UK such as Manchester, Liverpool, Cardiff and West Yorkshire in the next few years.
• Prosperous – the Region’s residents have the highest weekly income amongst the
• UK’s Core Cities.
• Educated – it has the 2nd highest rate of residents (16-64) educated to degree level amongst Core City Regions.
Alexander Lembcke - Roads, market access and regional economic development OECD CFE
Presentation by Alexander Lembcke, OECD at the OECD Workshop on Spatial Dimensions of Productivity, 28-29 March 2019, Bolzano.
More info: https://oe.cd/GFPBolzano2019
Alexandert Himbert - Trade facilitation and spatial patterns of economic acti...OECD CFE
Presentation by Alexandert Himbert, OECD at the OECD Workshop on Spatial Dimensions of Productivity, 28-29 March 2019, Bolzano.
More info: https://oe.cd/GFPBolzano2019
Mauro Pisu - The effect of public sector efficiency on firm-level productivit...OECD CFE
Presentation by Mauro Pisu, OECD at the OECD Workshop on Spatial Dimensions of Productivity, 28-29 March 2019, Bolzano.
More info: https://oe.cd/GFPBolzano2019
OECD productivity and jobs in a globalised worldJeanette Duboys
Presentation made at the Workshop of the Commission for Economic Policy on International trade and globalisation – Implications for regional growth, employment and industrial renewal in Brussels, Belgium on 22 January 2018, by Alexander Lembcke, OECD Centre for Entrepreneurship, SMEs, Regions and Cities.
Employment structures and working practices.
www.its.leeds.ac.uk/research/mobility-energy-futures-series
The travel pattern in the UK has changed substantially in the last decade. Given the importance of the commute to
overall distance travelled and therefore energy consumed, understanding how and why this has changed and how it might change in the future is key to address the energy trilemma challenges in the transport sector.
Claire Lelarge - What productivity impact to expect from high-speed rail infr...OECD CFE
Presentation by Claire Lelarge, RITM Université Paris-Sud, Paris, France at the OECD Workshop on Spatial Dimensions of Productivity, 28.28 March 2019, Bolzano.
More info: https://oe.cd/GFPBolzano2019
Presentation made at the ESPON Targeted Analysis SPIMA final conference - Planning for a Metropolitan Future, Brussels, Belgium on 6 February 2018, by Soo-jin Kim, OECD Centre for Entrepreneurship, SMEs, Regions and Cities.
Presented at the Integrated Governance Forum on 30-31 January 2018 in Lisbon, Portugal. Presentation by Dorothee Allain-Dupré, OECD Centre for Entrepreneurship, SMEs, Regions and Cities.
More information: http://www.oecd.org/regional/regional-policy/multi-level-governance.htm
Strikes in Europe (version 2.1., January 2015)Irmgard Pas
STRIKES IN EUROPE (VERSION 2.1, JANUARY 2015). This visual presentation shows the development of days not worked due to industrial action per 1,000 employees and the participation in industrial action per 1,000 employees in most European countries since the year 2000.
Carlo Lavalle - From place of residence to place of activity: Emerging data a...OECD CFE
Presentation by Carlo Lavalle, Joint Research Centre, European Commission at the OECD Workshop on Spatial Dimensions of Productivity, 28-29 March 2019, Bolzano.
More info: https://oe.cd/GFPBolzano2019
Presentation made at WHO European Healthy Cities Network Summit of Mayors on 13 February 2013 in Copenhagen, Denmark. Presentation by Paolo Veneri, OECD Centre for Entrepreneurship, SMEs, Regions and Cities.
More information: http://www.oecd.org/cfe/regional-policy/
Presentation by Clément Mazet-Sonilhac, Banque de France at the OECD Workshop on Spatial Dimensions of Productivity, 28-29 March 2019, Bolzano.
More info: https://oe.cd/GFPBolzano2019
Columbus MSA employment was up 8,200 (0.8 percent) from March to June, ahead of Ohio’s increase of 0.4 percent and the U.S. increase of 0.6 percent, according to the Q2 economic update report produced by Columbus 2020. Going into the second half of the year, unemployment in the Columbus Region continued to decline at 4.6 percent, compared to June state and national rates of 5.5 and 6.1, respectively.
The Graying Job Market in the Atlanta Region & The Economic Impact This PortendsARCResearch
Not only is the population growing older, so is the workforce. This simple fact has vast ramifications for the region as the 65 and older age cohort is increasing its economic strength by staying in the workforce longer and earning more while doing it.
U.S. employment update and outlook: October 2014JLL
Unemployment dips to 5.9 percent in September—its first time below 6.0 percent during the recovery.
The U.S. economy got back on track in September, bouncing back from a sluggish August with 248,000 net new jobs. Growth occurred across sectors and geographies, with office-using industries in particular benefiting from improved corporate confidence leading to permanent hiring.
Total unemployment, which includes discouraged and marginally detached workers, also declined slightly to 11.8 percent, bringing it below the 10-year average.
With numerous other employment metrics all pointing up—including job openings, voluntary quits and CEO confidence—sentiment will only become more optimistic over the coming months.
See more real estate and economic research at: http://bit.ly/1vIGt6m
MC_forecasts_finals series 17_feb2024.pdfARCResearch
Final summary slide deck for Series 17 population, employment by sector, age group forecasts for MPO region, counties, and smaller areas...February 2024
33N Blog Housing MAS 2023 Slide DeckpdfARCResearch
Results of housing-related questions from the 2023 Metro Atlanta Speaks survey--focus on affordability locally and regionally, as well as on policy perceptions
The Roman Empire A Historical Colossus.pdfkaushalkr1407
The Roman Empire, a vast and enduring power, stands as one of history's most remarkable civilizations, leaving an indelible imprint on the world. It emerged from the Roman Republic, transitioning into an imperial powerhouse under the leadership of Augustus Caesar in 27 BCE. This transformation marked the beginning of an era defined by unprecedented territorial expansion, architectural marvels, and profound cultural influence.
The empire's roots lie in the city of Rome, founded, according to legend, by Romulus in 753 BCE. Over centuries, Rome evolved from a small settlement to a formidable republic, characterized by a complex political system with elected officials and checks on power. However, internal strife, class conflicts, and military ambitions paved the way for the end of the Republic. Julius Caesar’s dictatorship and subsequent assassination in 44 BCE created a power vacuum, leading to a civil war. Octavian, later Augustus, emerged victorious, heralding the Roman Empire’s birth.
Under Augustus, the empire experienced the Pax Romana, a 200-year period of relative peace and stability. Augustus reformed the military, established efficient administrative systems, and initiated grand construction projects. The empire's borders expanded, encompassing territories from Britain to Egypt and from Spain to the Euphrates. Roman legions, renowned for their discipline and engineering prowess, secured and maintained these vast territories, building roads, fortifications, and cities that facilitated control and integration.
The Roman Empire’s society was hierarchical, with a rigid class system. At the top were the patricians, wealthy elites who held significant political power. Below them were the plebeians, free citizens with limited political influence, and the vast numbers of slaves who formed the backbone of the economy. The family unit was central, governed by the paterfamilias, the male head who held absolute authority.
Culturally, the Romans were eclectic, absorbing and adapting elements from the civilizations they encountered, particularly the Greeks. Roman art, literature, and philosophy reflected this synthesis, creating a rich cultural tapestry. Latin, the Roman language, became the lingua franca of the Western world, influencing numerous modern languages.
Roman architecture and engineering achievements were monumental. They perfected the arch, vault, and dome, constructing enduring structures like the Colosseum, Pantheon, and aqueducts. These engineering marvels not only showcased Roman ingenuity but also served practical purposes, from public entertainment to water supply.
How to Make a Field invisible in Odoo 17Celine George
It is possible to hide or invisible some fields in odoo. Commonly using “invisible” attribute in the field definition to invisible the fields. This slide will show how to make a field invisible in odoo 17.
Model Attribute Check Company Auto PropertyCeline George
In Odoo, the multi-company feature allows you to manage multiple companies within a single Odoo database instance. Each company can have its own configurations while still sharing common resources such as products, customers, and suppliers.
Palestine last event orientationfvgnh .pptxRaedMohamed3
An EFL lesson about the current events in Palestine. It is intended to be for intermediate students who wish to increase their listening skills through a short lesson in power point.
Synthetic Fiber Construction in lab .pptxPavel ( NSTU)
Synthetic fiber production is a fascinating and complex field that blends chemistry, engineering, and environmental science. By understanding these aspects, students can gain a comprehensive view of synthetic fiber production, its impact on society and the environment, and the potential for future innovations. Synthetic fibers play a crucial role in modern society, impacting various aspects of daily life, industry, and the environment. ynthetic fibers are integral to modern life, offering a range of benefits from cost-effectiveness and versatility to innovative applications and performance characteristics. While they pose environmental challenges, ongoing research and development aim to create more sustainable and eco-friendly alternatives. Understanding the importance of synthetic fibers helps in appreciating their role in the economy, industry, and daily life, while also emphasizing the need for sustainable practices and innovation.
June 3, 2024 Anti-Semitism Letter Sent to MIT President Kornbluth and MIT Cor...Levi Shapiro
Letter from the Congress of the United States regarding Anti-Semitism sent June 3rd to MIT President Sally Kornbluth, MIT Corp Chair, Mark Gorenberg
Dear Dr. Kornbluth and Mr. Gorenberg,
The US House of Representatives is deeply concerned by ongoing and pervasive acts of antisemitic
harassment and intimidation at the Massachusetts Institute of Technology (MIT). Failing to act decisively to ensure a safe learning environment for all students would be a grave dereliction of your responsibilities as President of MIT and Chair of the MIT Corporation.
This Congress will not stand idly by and allow an environment hostile to Jewish students to persist. The House believes that your institution is in violation of Title VI of the Civil Rights Act, and the inability or
unwillingness to rectify this violation through action requires accountability.
Postsecondary education is a unique opportunity for students to learn and have their ideas and beliefs challenged. However, universities receiving hundreds of millions of federal funds annually have denied
students that opportunity and have been hijacked to become venues for the promotion of terrorism, antisemitic harassment and intimidation, unlawful encampments, and in some cases, assaults and riots.
The House of Representatives will not countenance the use of federal funds to indoctrinate students into hateful, antisemitic, anti-American supporters of terrorism. Investigations into campus antisemitism by the Committee on Education and the Workforce and the Committee on Ways and Means have been expanded into a Congress-wide probe across all relevant jurisdictions to address this national crisis. The undersigned Committees will conduct oversight into the use of federal funds at MIT and its learning environment under authorities granted to each Committee.
• The Committee on Education and the Workforce has been investigating your institution since December 7, 2023. The Committee has broad jurisdiction over postsecondary education, including its compliance with Title VI of the Civil Rights Act, campus safety concerns over disruptions to the learning environment, and the awarding of federal student aid under the Higher Education Act.
• The Committee on Oversight and Accountability is investigating the sources of funding and other support flowing to groups espousing pro-Hamas propaganda and engaged in antisemitic harassment and intimidation of students. The Committee on Oversight and Accountability is the principal oversight committee of the US House of Representatives and has broad authority to investigate “any matter” at “any time” under House Rule X.
• The Committee on Ways and Means has been investigating several universities since November 15, 2023, when the Committee held a hearing entitled From Ivory Towers to Dark Corners: Investigating the Nexus Between Antisemitism, Tax-Exempt Universities, and Terror Financing. The Committee followed the hearing with letters to those institutions on January 10, 202
Welcome to TechSoup New Member Orientation and Q&A (May 2024).pdfTechSoup
In this webinar you will learn how your organization can access TechSoup's wide variety of product discount and donation programs. From hardware to software, we'll give you a tour of the tools available to help your nonprofit with productivity, collaboration, financial management, donor tracking, security, and more.
Digital Tools and AI for Teaching Learning and Research
ARC's Small-Area Employment Estimates
1. ARC’s 2012 Small –Area
Employment Estimates
Atlanta Regional Commission
Regional Snapshot: September 2013
For more information contact:
mcarnathan@atlantaregional.com
2. Employment Estimates (by Sector)
0 50,000 100,000 150,000 200,000 250,000 300,000
Mining, Quarrying, and Oil and Gas Extraction
Agriculture, Forestry, Fishing and Hunting
Unclassified
Utilities
Arts, Entertainment, Recreation
Real Estate and Rental/ Leasing
Mgmt. of Companies, Enterprises
NonDurable Manufacturing
Other Services
Information
Construction
Finance and Insurance
Durable Manufacturing
Public Admin
Wholesale Trade
Transportation Warehousing
Professional, Scientific, Technical
Admin, Waste, Support Svcs
Accomodation, Food Services
Educational Services
Health Care/ Social Assistance
Retail Trade
Total Jobs by Sector, 2012
The Retail Trade sector,
which has long been the
largest employment sector
in metro Atlanta, once again
tallies the most jobs for any
sector. The Health
Care/Social Assistance
sector, however, is catching
up fast.
3. Employment Change, 2010-2012 (by Sector)
-10,000 -5,000 0 5,000 10,000 15,000 20,000
Educational Services
Construction
Utilities
Information
Ag, Forestry, Fish
Mining
Public Admin
Real Estate
Arts, Entertainment & Rec
Manufacturing-Non Durable
Wholesale Trade
Finance
Mgmt of Companies
Other
Manufacturing-Durable
Trans and Warehousing
Health and Social Assistance
Retail Trade
Other Services (Not Pub. Admin)
Professional, Science and Tech
Accommodation and Food
Admin/Waste Management
4. -10,000 -5,000 0 5,000 10,000 15,000 20,000
Educational Services
Construction
Utilities
Information
Ag, Forestry, Fish
Mining
Public Admin
Real Estate
Arts, Entertainment & Rec
Manufacturing-Non Durable
Wholesale Trade
Finance
Mgmt of Companies
Other
Manufacturing-Durable
Trans and Warehousing
Health and Social Assistance
Retail Trade
Other Services (Not Pub. Admin)
Professional, Science and Tech
Accommodation and Food
Admin/Waste Management
Employment Change, 2010-2012 (by Sector)
The Admin/Waste Management
Sector, which includes temporary
jobs, added the most employment
between 2010 & 2012, showing that
while employment is improving,
employers are still skittish to hire
full-time, permanent positions. The
Other Services sector also employs
a lot of temporary workers. For
more information about this
phenomenon, read this.
On the plus side, more than 13,000
Professional, Scientific, Technical
jobs were added. These are
generally among the highest-paying
jobs in the region and include legal,
accounting, architectural,
computing, consulting and other
jobs that require high levels of
education and expertise.
6. Employment Estimates (by County)
Change in Employment
County 2008 2009 2010 2012 2008-2012 2010-2012
Barrow 15,508 14,867 14,937 15,738 230 801
Bartow 33,516 30,572 28,692 31,330 -2,186 2,638
Carroll 38,704 36,665 35,803 36,439 -2,265 636
Cherokee 47,561 44,246 42,310 46,078 -1,483 3,768
Clayton 120,613 114,760 113,036 113,520 -7,093 484
Cobb 326,951 311,092 293,198 313,362 -13,589 20,164
Coweta 33,220 31,374 29,672 31,403 -1,817 1,731
DeKalb 307,116 293,714 280,111 286,444 -20,672 6,333
Douglas 40,698 38,039 36,311 36,845 -3,853 534
Fayette 39,677 36,365 34,967 38,548 -1,129 3,581
Forsyth 61,542 59,204 56,381 63,375 1,833 6,994
Fulton 727,740 687,123 679,041 702,611 -25,129 23,570
Gwinnett 322,771 295,327 287,309 302,159 -20,612 14,850
Hall 74,536 68,263 69,034 71,778 -2,758 2,744
Henry 49,986 45,612 46,771 48,811 -1,175 2,040
Newton 21,386 20,004 19,777 20,462 -924 685
Paulding 21,236 20,868 20,137 20,347 -889 210
Rockdale 31,980 29,151 29,170 30,419 -1,561 1,249
Spalding 22,482 20,982 20,129 21,305 -1,177 1,176
Walton 18,604 17,617 17,411 18,837 233 1,426
20-County Total 2,355,827 2,215,845 2,154,197 2,249,811 -106,016 95,614
Fulton County led the region
in overall job growth
between 2010 and 2012,
adding more than 23,500.
Next are Cobb (+20,000) and
Gwinnett (+15,000).
In looking at overall
employment over the four
years between 2008 and
2012, there is good news
and bad news. The good
news is that the 20-county
Atlanta region added some
95,000 jobs between 2010
and 2012. The bad news is
that overall employment in
the 20-county region is still
about 106,000 jobs lower
than what is was in 2008.
Finally, although we didn’t
call this out specifically, the
region lost more than
200,000 jobs between 2008-
2010, one of the worst
stretches in the region’s
history.
8. Employment: A Quick National Perspective
To provide a national
perspective, we included this
chart from the Bureau of
Labor Statistics that shows
that metro Atlanta (28-county
area) ranks fourth among the
12 largest metros in year-
over-year percent change in
employment between May,
2012 and May, 2013.
Please note that ARC’s
employment estimates are
different. We use a different
methodology to count jobs;
our estimates cover a
different geographic scale as
well as a different time
period. (This looks at change
since 2012, our estimates
stop at 2012). But as this
chart shows, the overall
employment picture in metro
Atlanta is looking up.
9. Total Jobs, 2012: Where are Jobs Distributed In the Region?
The largest concentration
of jobs, shown in dark
blue on the map, are
found in the northern
parts of the region. As
subsequent slides will
show, these are also the
areas that added the
most jobs because, in
general, jobs of all types
tend to cluster near one
another. Retail jobs, for
example, are located
near office jobs.
10. Total Jobs, 2012: Areas with 100,000+ Jobs
There were four areas (ARC
Superdistricts – see below) in
the 20-county region with
more than 100,000 jobs in
2012: Central Business District,
Central Gwinnett, North Fulton
and Cumberland. This
distribution shows how
employment has become
much more decentralized in
this region, as three of the
four largest employment
concentrations are found
outside of the I-285 perimeter.
The maps are displaying job
totals by ARC Superdistrict,
which are drawn to mirror
“market” areas wherever
possible. Overall, there are 78
Superdistricts in the region.
11. Total Job Change, 2008 - 2012: Which Areas Gained The Most Jobs?
The areas that added
the most jobs between
2008 and 2012 (in the
dark blues) are
scattered throughout
the region, ranging from
the Airport down south
up to the Cumming
Superdistrict in the
north. Remember this is
from 2008 to 2012, a
period when the region
lost more than 106,000
jobs overall.
12. Total Job Change, 2008 - 2012: Areas That Gained At Least
1,000 Jobs
There were nine areas
(Superdistricts highlighted on
the map) in the 20-county
region that added more than
1,000 jobs between 2008 and
2012. They are (in order): NW
DeKalb, Marietta, N Gwinnett,
N Fulton, Airport, Buckhead,
SW DeKalb, Cumming, and S
Barrow.
This distribution illustrates the
trend of further
decentralization of jobs away
from the core, although
several areas near the core did
well during the period.
13. Total Job Change, 2010 - 2012: Which Areas Gained The Most Jobs?
This looks at change
between 2010 and 2012,
which is a truer measure of
recovery from the Great
Recession. Here you see
the areas that added the
most jobs (in the dark
blues) are concentrated in
the northern parts of the
region (as well as the
Airport). As can be seen,
some areas (mostly those
that are already “job rich”)
did better than others.
14. Total Job Change, 2010 - 2012: Areas That Gained At Least
5,000 Jobs
Remember, we are now
looking at the period between
2010 and 2012, when the 20-
county region added 95,000
jobs. And, since jobs tend to
attract other jobs (the
clustering effect), the areas
that were already job-rich
were the areas that added the
most new jobs between 2010
and 2012. There were seven
areas (Superdistricts
highlighted on the map) in the
20-county region that added
more than 5,000 jobs between
2010 and 2012. They are (in
order): N Fulton, NW DeKalb,
Buckhead, N Gwinnett, Central
Gwinnett, Marietta and
Cumberland.
15. Information Jobs, 2012: A Look At Where These Jobs Cluster
Jobs in the Information
Sector are among the
highest-paying in the region.
This sector includes
publishing and motion
picture industries as well as
data-processing and
telecommunications. These
jobs are clustered in the
northern parts of the region
along GA 400, although
North Rockdale and Central
Carroll also have high
concentrations of these jobs.
16. Information Jobs, 2012: North Fulton Has Heaviest Concentration of
Jobs in the Information Sector
Almost 13 percent of all
jobs in the North Fulton
Superdistrict are in the
Information Sector.
Other areas with high
Information job
concentrations include
the Chamblee
Superdistrict (8.2%), the
Central Business District
(7.8%) and Sandy
Springs (7.8%).
17. Professional, Science & Technical Jobs, 2012: A Look At Where These
Jobs Cluster
Similar to the Information
Sector, jobs in the
Professional/Tech Sector are
among the highest-paying in
the region. This sector include
legal, accounting, architectural,
computing, consulting and
other jobs that require high
levels of education and
expertise. These jobs are
clustered in the northern parts
of the region along GA 400, and
in Cobb and Cherokee Counties.
18. Professional, Science & Technical Jobs, 2012: Buckhead and Midtown
Have Heaviest Concentration of Jobs in the Professional, Science &
Technical Sector
Almost 17 percent of all
jobs in the Buckhead and
Midtown (NE Atlanta)
Superdistricts are in the
Professional/Tech Sector.
Other areas with high
Professional/Technical job
concentrations include the
Cumberland Superdistrict
(15%), Sandy Springs
(14%), and North Fulton
(13.5%).
19. Health Care Jobs, 2012: A Look At Where These Jobs Cluster
In places that don’t have a
diverse job base, but do have a
hospital, jobs in the Health Care
and Social Assistance Sector
dominate the economic base.
This sector includes jobs at
hospitals and clinics, but they
also include child care services
and community-based service
providers. Areas with big
hospitals tend to have the highest
concentration of these jobs, but
health care jobs are scattered
throughout the region.
20. Health Care & Social Assistance, 2012: Riverdale Superdistrict has
Heaviest Concentration of Jobs in the Health Care & Social Assistance
Sector
Bolstered by the Southern
Regional Medical Center,
the Riverdale
Superdistrict has more
than 35 percent of its jobs
in the Health Care and
Social Assistance Sector,
the highest share in the
region. Other areas with
high concentrations of
Health Care jobs include
the NW DeKalb (30%),
West Coweta (29%) and
North Henry (26%).