Download to read offline


![index<‐1
ggplot(happy2015, aes(x, y, alpha = z, color=z)) +
geom_point(alpha=0.2) + labs(title="", x="", y="") +
theme.both +
scale_colour_gradient(low = "white", high="lightblue")+
annotate("text", x=xcoord[index], y=ycoord[index], size=15, label=sign[index], color=colors[index])
draw.a.plot<‐ function(index){
#make up a new dataframe
bas<‐data.frame(x=rnorm(500, 0, 1.5), y=rnorm(500, 0, 1.5), z=rnorm(500,0,1.5))
#plot according to the index passed
g<‐ggplot(happy2015, aes(x, y, alpha = z, color=z)) +
geom_point(alpha=0.2) + labs(title="", x="", y="") +
theme.both +
scale_colour_gradient(low = "white", high="lightblue")+
annotate("text", x=xcoord[index], y=ycoord[index], size=15, label=sign[index], color=colors[index])
#print out the plot
print(g)
}](https://image.slidesharecdn.com/aninmat1-160728190353/85/Animaton-Package-in-R-An-Example-4-320.jpg)
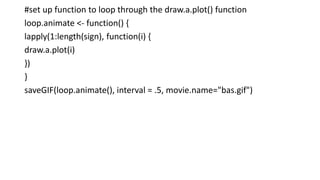

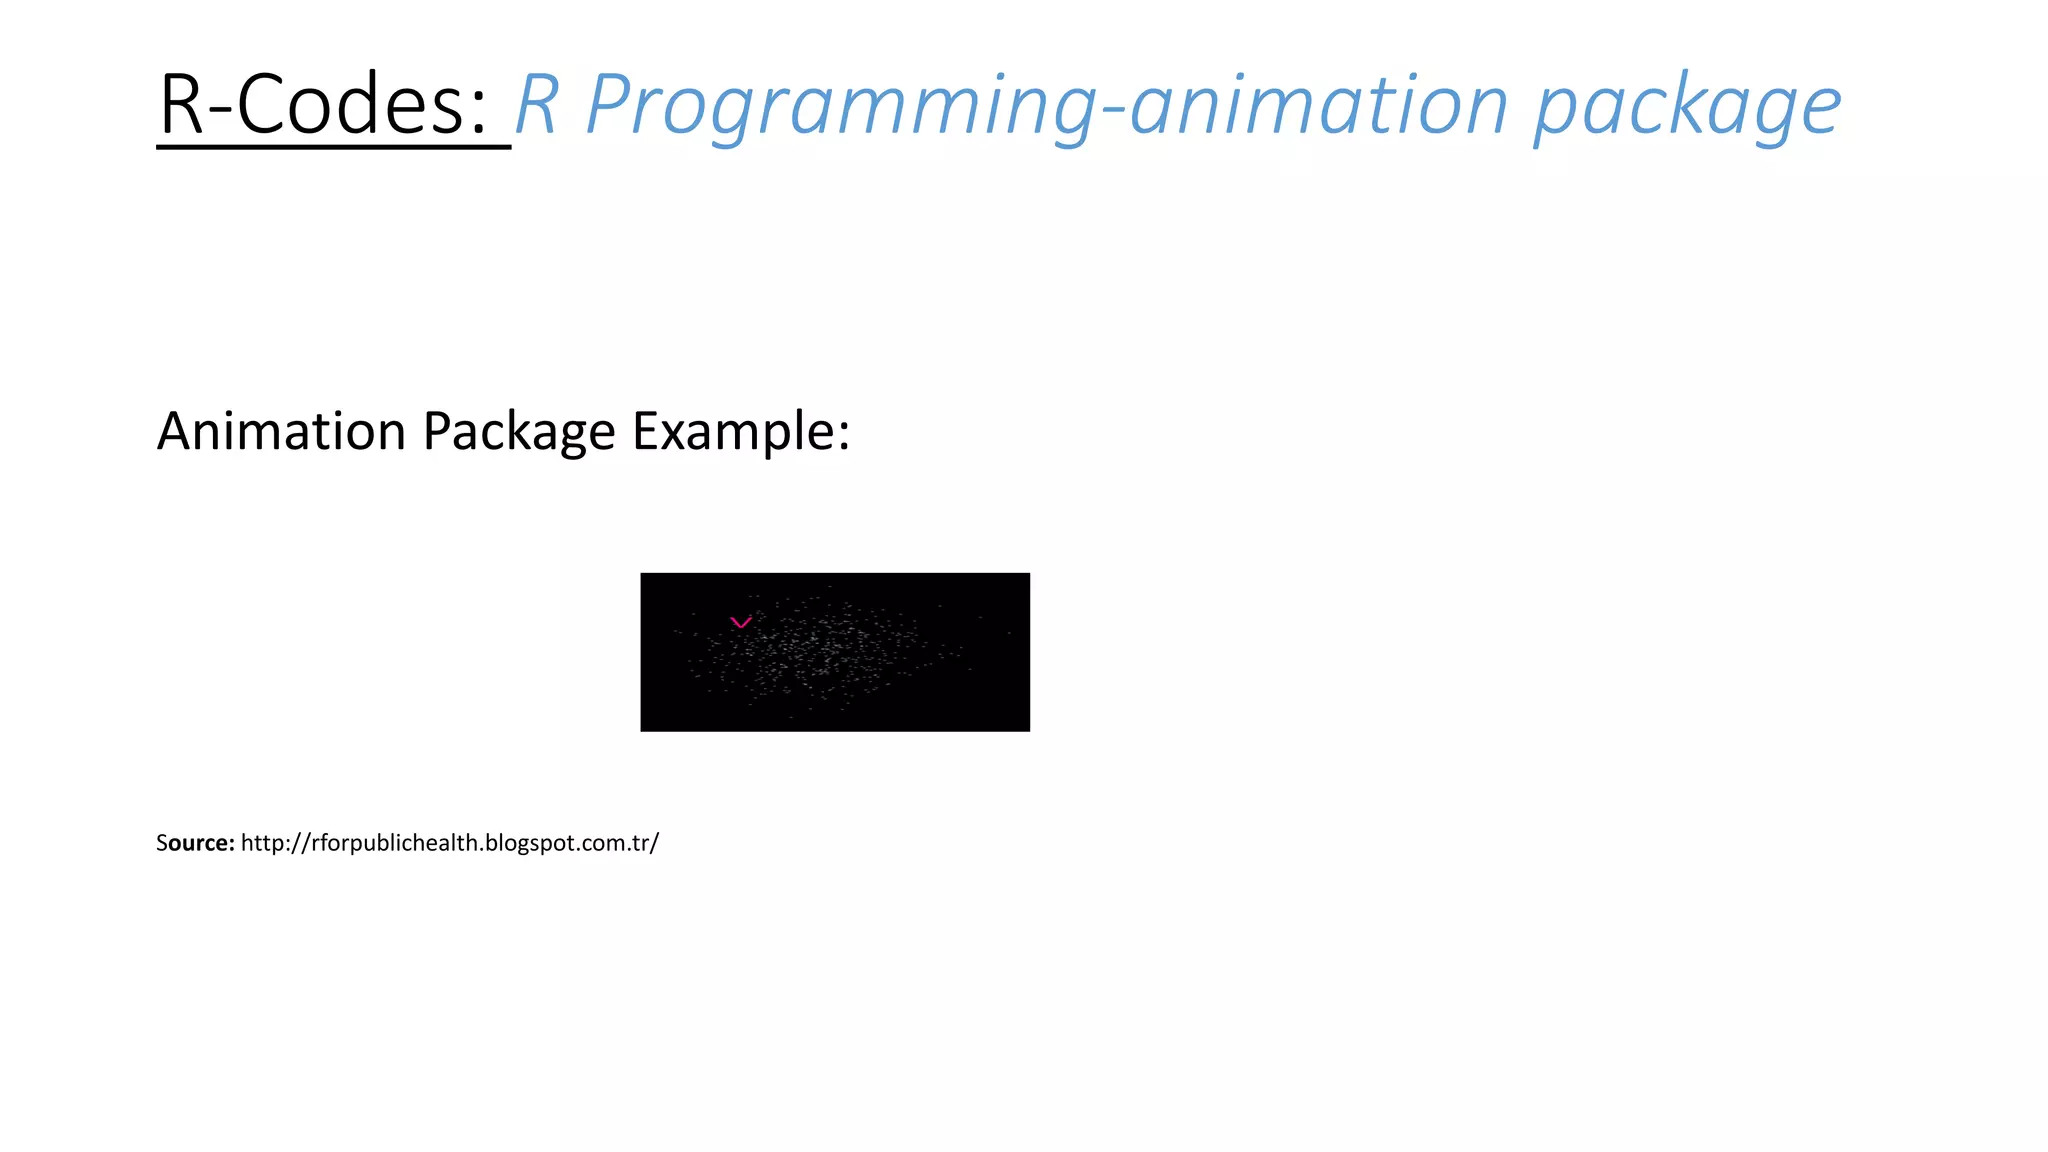
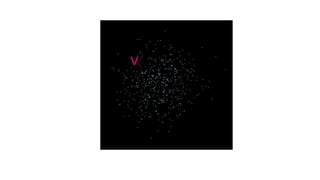
This document describes how to create an animation in R using the animation package. It generates random data points and plots them, adding one letter of the word "VOLCANO" in each frame. It creates a function that redraws the plot, changing the index each time to display a different letter. This function is run in a loop and saved as a GIF to produce an animated output displaying the letters over successive frames.


![Some R Examples[R table and Graphics] -Advanced Data Visualization in R (Some...](https://cdn.slidesharecdn.com/ss_thumbnails/exampless-160922204223-thumbnail.jpg?width=640&height=640&fit=bounds)