Download to read offline
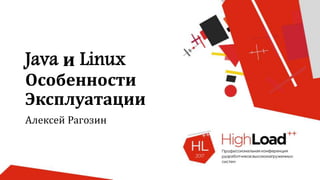


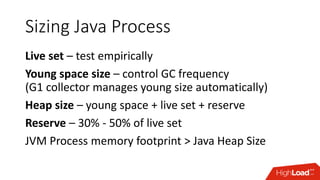
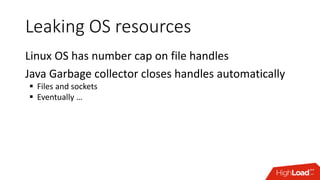
![Out of Memory in Java
public void doWork() {
Object[] hugeArray = new Object[HUGE_SIZE];
for(int i = 0; i != hugeArray.length; ++i) {
hugeArray[i] = calc(i);
}
}](https://image.slidesharecdn.com/2-171116105519/85/Java-Linux-12-320.jpg)
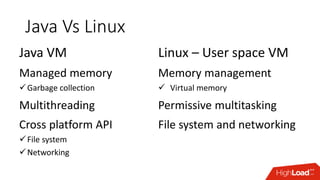
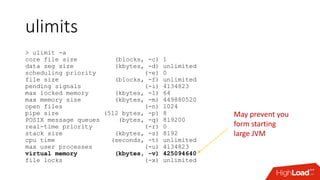
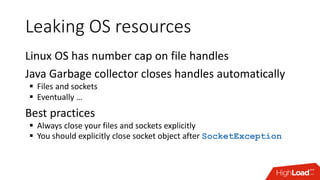
![Out of Memory in Linux
public void doWork() {
Object[] hugeArray = new Object[HUGE_SIZE];
for(int i = 0; i != hugeArray.length; ++i) {
hugeArray[i] = calc(i);
}
}](https://image.slidesharecdn.com/2-171116105519/85/Java-Linux-13-320.jpg)
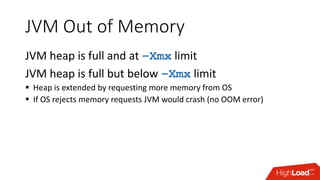
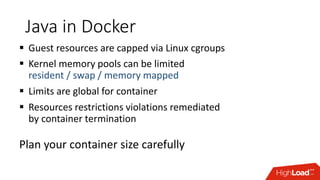

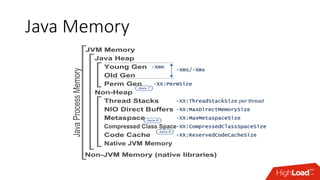
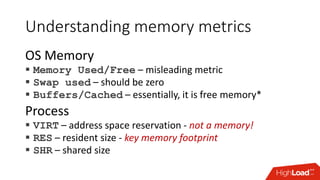
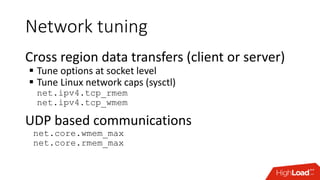
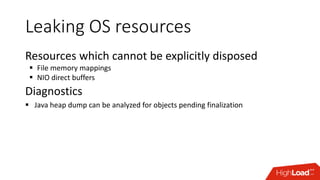
![Java Thread in jstack
jstack (JDK tool)Full thread dump Java HotSpot(TM) 64-Bit Server VM (25.60-b23 mixed mode):
"Attach Listener" #65 daemon prio=9 os_prio=0 tid=0x0000000000cbc800 nid=0x1f0 waiting on condition [0x0000000000000000]
java.lang.Thread.State: RUNNABLE
"pool-1-thread-20" #64 prio=5 os_prio=0 tid=0x00000000009d5000 nid=0x1c04 waiting on condition [0x00007fa109e55000]
java.lang.Thread.State: WAITING (parking)
at sun.misc.Unsafe.park(Native Method)
- parking to wait for <0x00000000d3ab9e50> (a java.util.concurrent.locks.AbstractQueuedSynchronizer$ConditionObject)
at java.util.concurrent.locks.LockSupport.park(LockSupport.java:175)
at java.util.concurrent.locks.AbstractQueuedSynchronizer$ConditionObject.await(AbstractQueuedSynchronizer.java:2039)
at java.util.concurrent.ScheduledThreadPoolExecutor$DelayedWorkQueue.take(ScheduledThreadPoolExecutor.java:1088)
at java.util.concurrent.ScheduledThreadPoolExecutor$DelayedWorkQueue.take(ScheduledThreadPoolExecutor.java:809)
at java.util.concurrent.ThreadPoolExecutor.getTask(ThreadPoolExecutor.java:1067)
at java.util.concurrent.ThreadPoolExecutor.runWorker(ThreadPoolExecutor.java:1127)
at java.util.concurrent.ThreadPoolExecutor$Worker.run(ThreadPoolExecutor.java:617)
at java.lang.Thread.run(Thread.java:745)
"pool-1-thread-19" #63 prio=5 os_prio=0 tid=0x0000000000a1e800 nid=0x1bff waiting on condition [0x00007fa109f56000]
java.lang.Thread.State: WAITING (parking)
at sun.misc.Unsafe.park(Native Method)
- parking to wait for <0x00000000d3ab9e50> (a java.util.concurrent.locks.AbstractQueuedSynchronizer$ConditionObject)
at java.util.concurrent.locks.LockSupport.park(LockSupport.java:175)
at java.util.concurrent.locks.AbstractQueuedSynchronizer$ConditionObject.await(AbstractQueuedSynchronizer.java:2039)
...
Linux thread ID in hex
jstack forces STW pause in target JVM!](https://image.slidesharecdn.com/2-171116105519/85/Java-Linux-23-320.jpg)
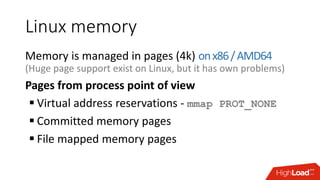
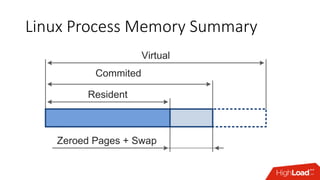
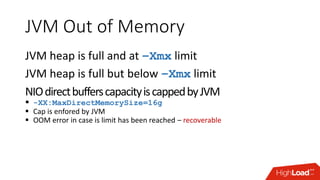
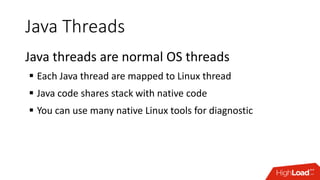
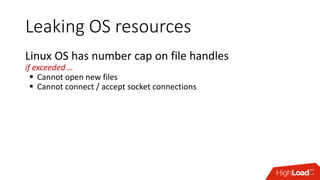
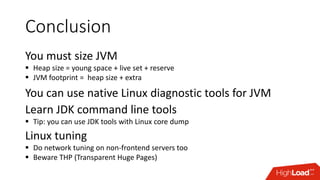
![Thread CPU usage in JVM
sjk ttop command - https://github.com/aragozin/jvm-tools
2016-07-27T07:47:20.674-0400 Process summary
process cpu=8.11%
application cpu=2.17% (user=1.52% sys=0.65%)
other: cpu=5.95%
GC cpu=0.00% (young=0.00%, old=0.00%)
heap allocation rate 1842kb/s
safe point rate: 1.1 (events/s) avg. safe point pause: 0.43ms
safe point sync time: 0.01% processing time: 0.04% (wallclock time)
[003120] user= 1.12% sys= 0.24% alloc= 983kb/s - RMI TCP Connection(1)-172.17.168.11
[000039] user= 0.30% sys= 0.26% alloc= 701kb/s - DB feed - UserPermission.DBWatcher
[000053] user= 0.00% sys= 0.05% alloc= 50kb/s - Statistics
[000038] user= 0.00% sys= 0.05% alloc= 4584b/s – Reactor-0
[000049] user= 0.00% sys= 0.03% alloc= 38kb/s - DB feed - UserInfo.DBWatcher
[000036] user= 0.00% sys= 0.03% alloc= 0b/s - Abandoned connection cleanup thread
[003122] user= 0.00% sys= 0.03% alloc= 4915b/s - JMX server connection timeout 3122
[000040] user= 0.10% sys=-0.09% alloc= 8321b/s - DB feed - Report.DBWatcher
[000050] user= 0.00% sys= 0.01% alloc= 24kb/s - DB feed - Rule.DBWatcher
[000051] user= 0.00% sys= 0.01% alloc= 9034b/s - DB feed - EmailAccount.DBWatcher
[000044] user= 0.00% sys= 0.01% alloc= 4840b/s - DB feed - Analytics.DBWatcher
[000041] user= 0.00% sys= 0.01% alloc= 9999b/s - DB feed - Contact.DBWatcher
[000054] user= 0.00% sys= 0.01% alloc= 3481b/s – Statistics
[000001] user= 0.00% sys= 0.00% alloc= 0b/s - main
[000002] user= 0.00% sys= 0.00% alloc= 0b/s - Reference Handler
[000003] user= 0.00% sys= 0.00% alloc= 0b/s – Finalizer
Does not infer STW pauses on target process](https://image.slidesharecdn.com/2-171116105519/85/Java-Linux-24-320.jpg)


The document discusses the relationship between Java and Linux, focusing on JVM memory management, garbage collection, and performance tuning. It covers various aspects such as the differences in memory metrics for Java and Linux, thread management, and best practices for resource usage. Additionally, it highlights tools for diagnostics and performance monitoring in a Java environment running on Linux.


![[Deck] What's New in Spark-Iceberg Integration via DSV2.pptx](https://cdn.slidesharecdn.com/ss_thumbnails/deckwhatsnewinspark-icebergintegrationviadsv2-260210005337-25955b12-thumbnail.jpg?width=640&height=640&fit=bounds)


