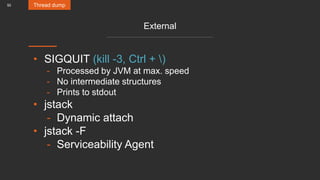
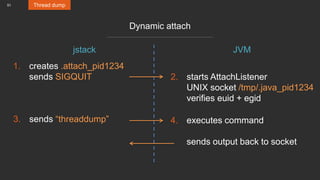
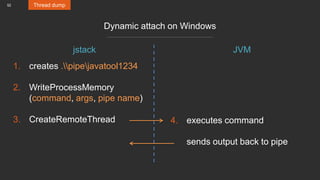
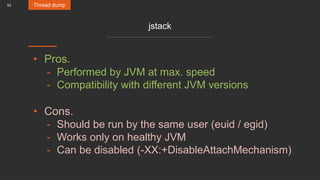
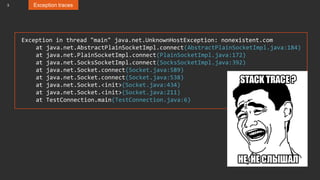
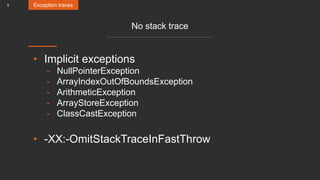
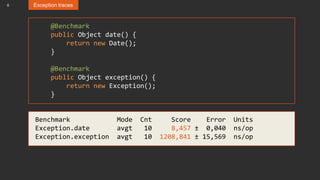
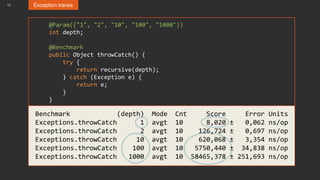
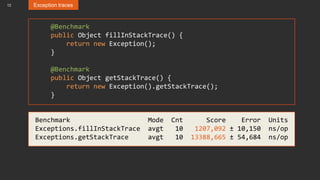
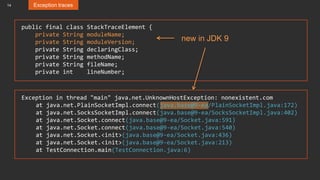
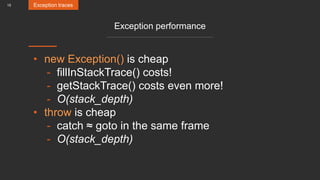
The document discusses stack traces and heap dumps in Java, detailing performance implications, exception handling, and use cases. It references various StackOverflow questions and provides example code snippets and benchmarking results related to the creation and management of exceptions and thread states. Additionally, it covers the use of the Stack Walking API and profiling techniques for analyzing thread behavior in Java applications.


![13 Exception traces
int depth = getStackTraceDepth();
stackTrace = new StackTraceElement[depth];
for (int i = 0; i < depth; i++)
stackTrace[i] = getStackTraceElement(i);
native calls
public final class StackTraceElement {
private String declaringClass;
private String methodName;
private String fileName;
private int lineNumber;
...
}](https://image.slidesharecdn.com/stacktraces-jugru-160526232904/85/Everything-you-wanted-to-know-about-Stack-Traces-and-Heap-Dumps-13-320.jpg)

![18 Use cases
"Thread-1" #18 prio=5 os_prio=0 tid=0x1923a800 nid=0xdf8 waiting on condition [0x19faf000]
java.lang.Thread.State: WAITING (parking)
at sun.misc.Unsafe.park(Native Method)
- parking to wait for <0xd94cec48> (a java.util.concurrent.locks.ReentrantLock$NonfairSync)
at java.util.concurrent.locks.ReentrantLock.lock(ReentrantLock.java:285)
at RpcTest.clientLoop(RpcTest.java:34)
at java.lang.Thread.run(Thread.java:745)
"Thread-2" #19 prio=5 os_prio=0 tid=0x19243800 nid=0x3d40 runnable [0x1a0af000]
java.lang.Thread.State: RUNNABLE
at one.nio.net.NativeSocket.readFully(Native Method)
at one.nio.rpc.RpcClient.invoke(RpcClient.java:76)
at RpcTest.clientLoop(RpcTest.java:36)
at java.lang.Thread.run(Thread.java:745)](https://image.slidesharecdn.com/stacktraces-jugru-160526232904/85/Everything-you-wanted-to-know-about-Stack-Traces-and-Heap-Dumps-18-320.jpg)
![19 Use cases
"Thread-1" #18 prio=5 os_prio=0 tid=0x1923a800 nid=0xdf8 waiting on condition [0x19faf000]
java.lang.Thread.State: WAITING (parking)
at sun.misc.Unsafe.park(Native Method)
- parking to wait for <0xd94cec48> (a java.util.concurrent.locks.ReentrantLock$NonfairSync)
at java.util.concurrent.locks.ReentrantLock.lock(ReentrantLock.java:285)
at RpcTest.clientLoop(RpcTest.java:34)
at java.lang.Thread.run(Thread.java:745)
Locked ownable synchronizers:
- None
"Thread-2" #19 prio=5 os_prio=0 tid=0x19243800 nid=0x3d40 runnable [0x1a0af000]
java.lang.Thread.State: RUNNABLE
at one.nio.net.NativeSocket.readFully(Native Method)
at one.nio.rpc.RpcClient.invoke(RpcClient.java:76)
at RpcTest.clientLoop(RpcTest.java:36)
at java.lang.Thread.run(Thread.java:745)
Locked ownable synchronizers:
- <0xd94cec48> (a java.util.concurrent.locks.ReentrantLock$NonfairSync)
-XX:+PrintConcurrentLocks](https://image.slidesharecdn.com/stacktraces-jugru-160526232904/85/Everything-you-wanted-to-know-about-Stack-Traces-and-Heap-Dumps-19-320.jpg)
![20 Use cases
"RPC Client 192.168.0.11" #19 prio=5 os_prio=0 tid=0x19243800 nid=0x3d40 runnable [0x1a0af000]
java.lang.Thread.State: RUNNABLE
at one.nio.net.NativeSocket.readFully(Native Method)
at one.nio.rpc.RpcClient.invoke(RpcClient.java:76)
at RpcTest.clientLoop(RpcTest.java:36)
at java.lang.Thread.run(Thread.java:745)
Use Thread.currentThread().setName()](https://image.slidesharecdn.com/stacktraces-jugru-160526232904/85/Everything-you-wanted-to-know-about-Stack-Traces-and-Heap-Dumps-20-320.jpg)

![22 Use cases
Logging
logger.warning("Operation timed out");
[Controller.java:123] WARNING: Operation timed out
public static String getLocation() {
StackTraceElement s = new Exception().getStackTrace()[2];
return s.getFileName() + ':' + s.getLineNumber();
}](https://image.slidesharecdn.com/stacktraces-jugru-160526232904/85/Everything-you-wanted-to-know-about-Stack-Traces-and-Heap-Dumps-22-320.jpg)
![23 Use cases
A better way?
Thread.current().getStackTrace()
public StackTraceElement[] getStackTrace() {
if (this != Thread.currentThread()) {
// ... some magic ...
} else {
// Don't need JVM help for current thread
return (new Exception()).getStackTrace();
}
}](https://image.slidesharecdn.com/stacktraces-jugru-160526232904/85/Everything-you-wanted-to-know-about-Stack-Traces-and-Heap-Dumps-23-320.jpg)


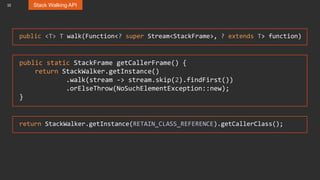
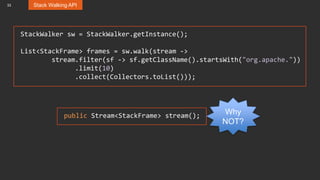
![34 Stack Walking API
/* package-private */
interface LiveStackFrame extends StackFrame {
public Object[] getMonitors();
public Object[] getLocals();
public Object[] getStack();
public static StackWalker getStackWalker();
}](https://image.slidesharecdn.com/stacktraces-jugru-160526232904/85/Everything-you-wanted-to-know-about-Stack-Traces-and-Heap-Dumps-34-320.jpg)
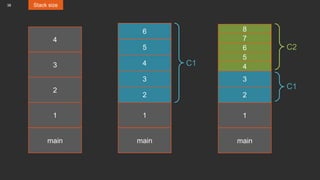
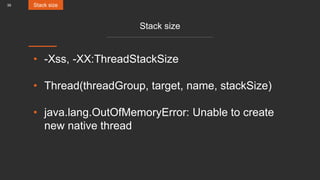
![36 Stack size
Fun with recursion
static int depth;
static void recursion() {
depth++;
recursion();
}
public static void main(String[] args) {
recursion();
}](https://image.slidesharecdn.com/stacktraces-jugru-160526232904/85/Everything-you-wanted-to-know-about-Stack-Traces-and-Heap-Dumps-36-320.jpg)


![47 Profiling
AsyncGetCallTrace
ASGCT_CallFrame frames[MAX_FRAMES];
ASGCT_CallTrace trace = {env, MAX_FRAMES, frames};
AsyncGetCallTrace(&trace, trace.num_frames, ucontext);
from signal handler
https://github.com/apangin/async-profiler](https://image.slidesharecdn.com/stacktraces-jugru-160526232904/85/Everything-you-wanted-to-know-about-Stack-Traces-and-Heap-Dumps-47-320.jpg)

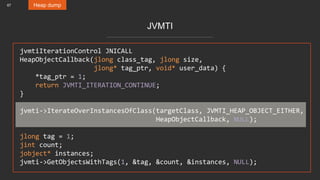
![49
In-process
• Java
- Thread.getAllStackTraces
- ThreadMXBean.getThreadInfo
• JVMTI
- GetAllStackTraces
- Compact representation (jmethodID)
- Used by profilers
Thread dump
StackTraceElement[]
+ locked monitors](https://image.slidesharecdn.com/stacktraces-jugru-160526232904/85/Everything-you-wanted-to-know-about-Stack-Traces-and-Heap-Dumps-49-320.jpg)