Downloaded 13 times


![Vanilla format
2016-08-31T01:09:19.397+0000: 1.606: [GC (Metadata GC Threshold) [PSYoungGen: 545393K->18495K(2446848K)] 545393K->18519K(8039424K),
0.0189376 secs] [Times: user=0.15 sys=0.01, real=0.02 secs]
2016-08-31T01:09:19.416+0000: 1.625: [Full GC (Metadata GC Threshold) [PSYoungGen: 18495K->0K(2446848K)] [ParOldGen: 24K->17366K(5592576K)]
18519K->17366K(8039424K), [Metaspace: 20781K->20781K(1067008K)], 0.0416162 secs] [Times: user=0.38 sys=0.03, real=0.04 secs]
2016-08-31T01:18:19.288+0000: 541.497: [GC (Metadata GC Threshold) [PSYoungGen: 1391495K->18847K(2446848K)] 1408861K->36230K(8039424K),
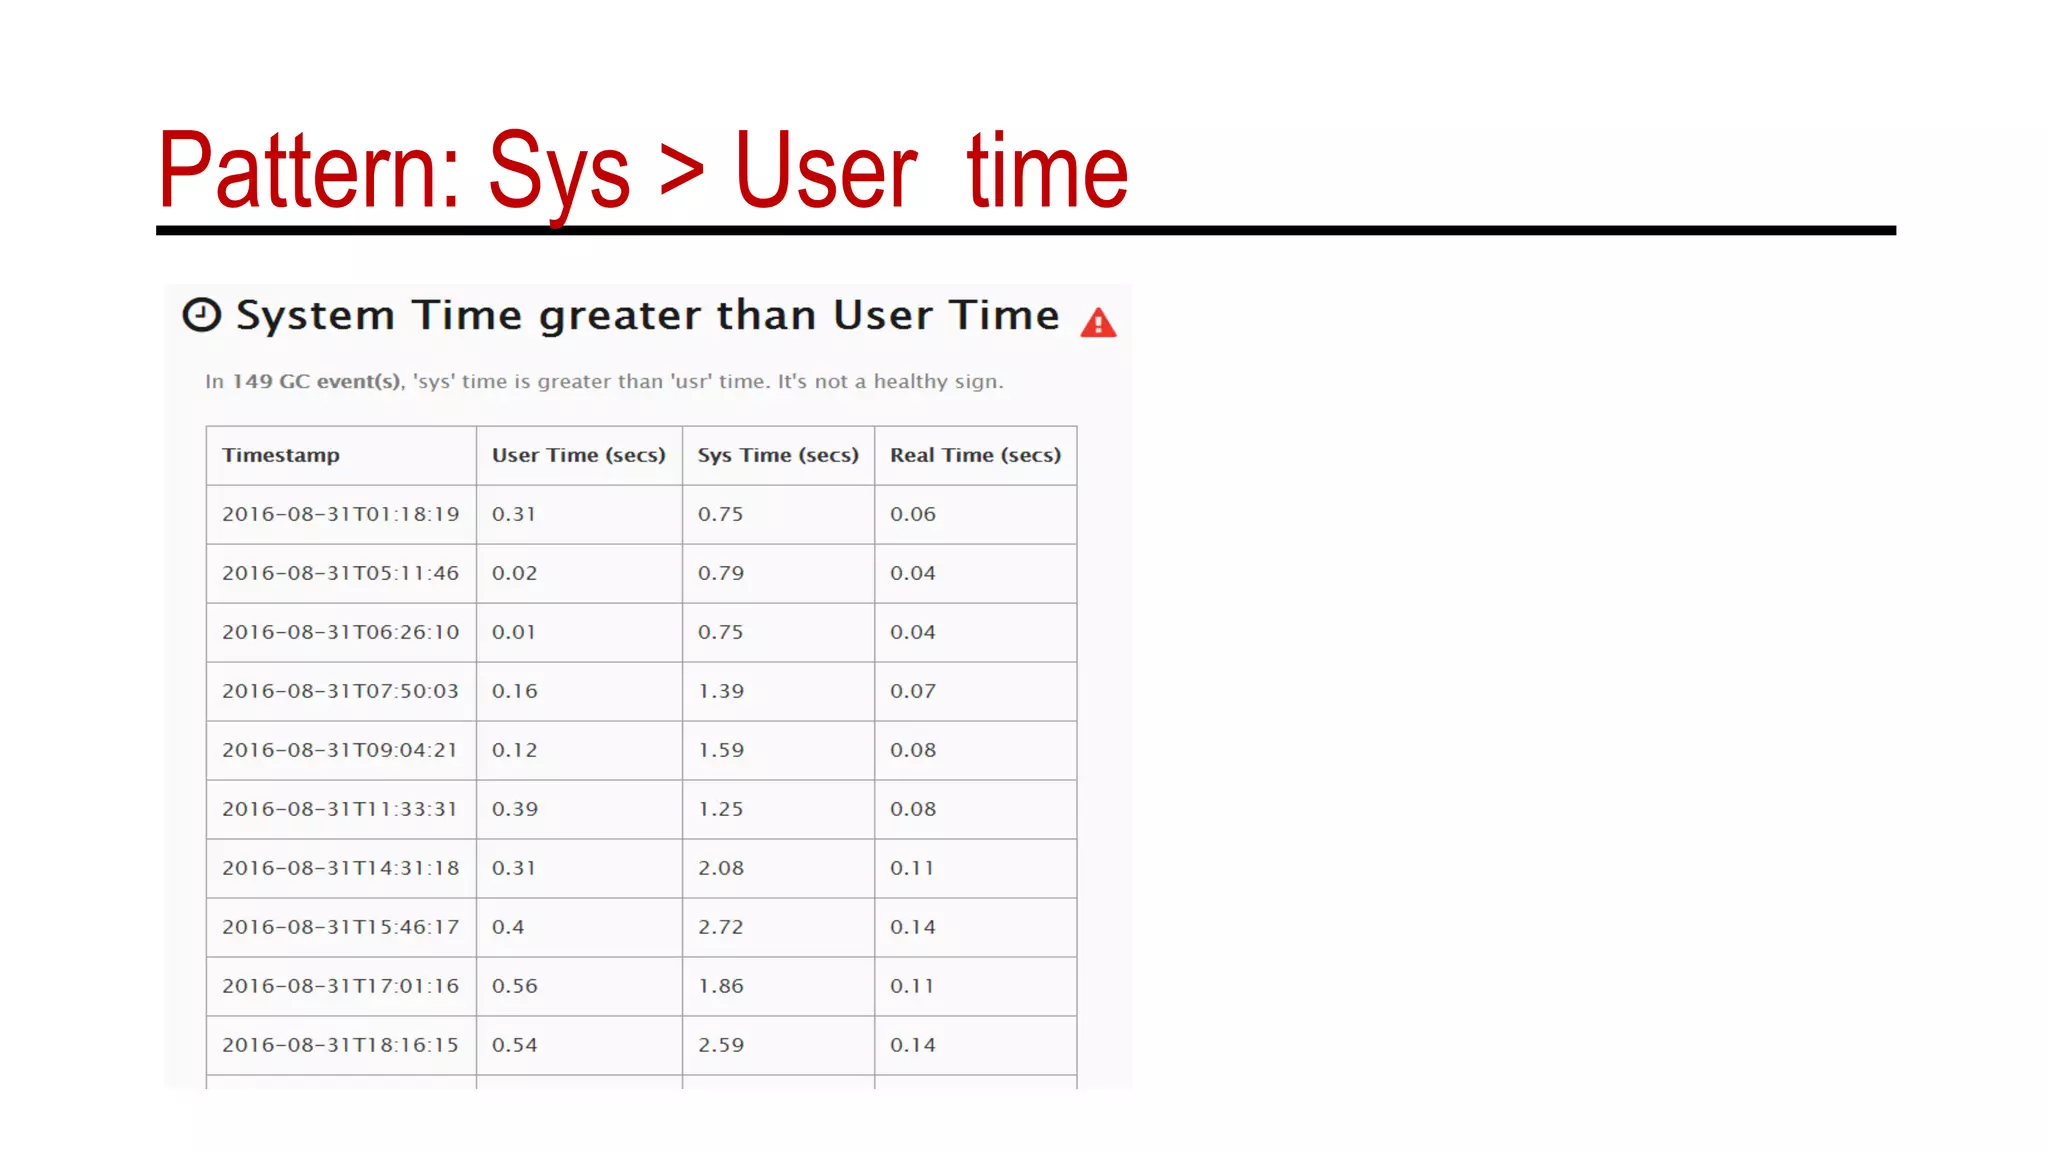
0.0568365 secs] [Times: user=0.31 sys=0.75, real=0.06 secs]
2016-08-31T01:18:19.345+0000: 541.554: [Full GC (Metadata GC Threshold) [PSYoungGen: 18847K->0K(2446848K)] [ParOldGen: 17382K-
>25397K(5592576K)] 36230K->25397K(8039424K), [Metaspace: 34865K->34865K(1079296K)], 0.0467640 secs] [Times: user=0.31 sys=0.08, real=0.04
secs]
2016-08-31T02:33:20.326+0000: 5042.536: [GC (Allocation Failure) [PSYoungGen: 2097664K->11337K(2446848K)] 2123061K->36742K(8039424K),
0.3298985 secs] [Times: user=0.00 sys=9.20, real=0.33 secs]
2016-08-31T03:40:11.749+0000: 9053.959: [GC (Allocation Failure) [PSYoungGen: 2109001K->15776K(2446848K)] 2134406K->41189K(8039424K),
0.0517517 secs] [Times: user=0.00 sys=1.22, real=0.05 secs]
2016-08-31T05:11:46.869+0000: 14549.079: [GC (Allocation Failure) [PSYoungGen: 2113440K->24832K(2446848K)] 2138853K->50253K(8039424K),
0.0392831 secs] [Times: user=0.02 sys=0.79, real=0.04 secs]
2016-08-31T06:26:10.376+0000: 19012.586: [GC (Allocation Failure) [PSYoungGen: 2122496K->25600K(2756096K)] 2147917K->58149K(8348672K),
0.0371416 secs] [Times: user=0.01 sys=0.75, real=0.04 secs]
2016-08-31T07:50:03.442+0000: 24045.652: [GC (Allocation Failure) [PSYoungGen: 2756096K->32768K(2763264K)] 2788645K->72397K(8355840K),
0.0709641 secs] [Times: user=0.16 sys=1.39, real=0.07 secs]
2016-08-31T09:04:21.406+0000: 28503.616: [GC (Allocation Failure) [PSYoungGen: 2763264K->32768K(2733568K)] 2802893K->83469K(8326144K),
0.0789178 secs] [Times: user=0.12 sys=1.59, real=0.08 secs]](https://image.slidesharecdn.com/becomeagchero-170627063634/75/Become-a-Garbage-Collection-Hero-5-2048.jpg)


![G1 GC Format2015-09-14T11:58:55.131-0700: 0.519: [GC pause (G1 Evacuation Pause) (young), 0.0096438 secs]
[Parallel Time: 7.9 ms, GC Workers: 8]
[GC Worker Start (ms): Min: 519.4, Avg: 519.6, Max: 520.6, Diff: 1.3]
[Ext Root Scanning (ms): Min: 0.0, Avg: 2.9, Max: 7.3, Diff: 7.3, Sum: 23.4]
[Update RS (ms): Min: 0.0, Avg: 0.0, Max: 0.0, Diff: 0.0, Sum: 0.0]
[Processed Buffers: Min: 0, Avg: 0.0, Max: 0, Diff: 0, Sum: 0]
[Scan RS (ms): Min: 0.0, Avg: 0.0, Max: 0.0, Diff: 0.0, Sum: 0.0]
[Code Root Scanning (ms): Min: 0.0, Avg: 0.0, Max: 0.1, Diff: 0.1, Sum: 0.1]
[Object Copy (ms): Min: 0.0, Avg: 4.2, Max: 7.2, Diff: 7.2, Sum: 34.0]
[Termination (ms): Min: 0.0, Avg: 0.2, Max: 0.4, Diff: 0.4, Sum: 1.7]
[Termination Attempts: Min: 1, Avg: 7.9, Max: 18, Diff: 17, Sum: 63]
[GC Worker Other (ms): Min: 0.0, Avg: 0.0, Max: 0.1, Diff: 0.1, Sum: 0.4]
[GC Worker Total (ms): Min: 6.4, Avg: 7.4, Max: 7.7, Diff: 1.3, Sum: 59.6]
[GC Worker End (ms): Min: 527.0, Avg: 527.1, Max: 527.1, Diff: 0.1]
[Code Root Fixup: 0.0 ms]
[Code Root Purge: 0.0 ms]
[Clear CT: 0.5 ms]
[Other: 1.3 ms]
[Choose CSet: 0.0 ms]
[Ref Proc: 0.7 ms]
[Ref Enq: 0.0 ms]
[Redirty Cards: 0.3 ms]
[Humongous Register: 0.0 ms]
[Humongous Reclaim: 0.0 ms]
[Free CSet: 0.0 ms]
[Eden: 24.0M(24.0M)->0.0B(34.0M) Survivors: 0.0B->3072.0K Heap: 24.0M(252.0M)->3338.0K(252.0M)]
[Times: user=0.06 sys=0.00, real=0.01 secs]](https://image.slidesharecdn.com/becomeagchero-170627063634/75/Become-a-Garbage-Collection-Hero-8-2048.jpg)
![CMS Log formatBefore GC:
Statistics for BinaryTreeDictionary:
------------------------------------
Total Free Space: 2524251
Max Chunk Size: 2519552
Number of Blocks: 13
Av. Block Size: 194173
Tree Height: 8
2016-05-03T04:27:37.503+0000: 30282.678: [ParNew
Desired survivor size 214728704 bytes, new threshold 1 (max 1)
- age 1: 85782640 bytes, 85782640 total
: 3510063K->100856K(3774912K), 0.0516290 secs] 9371816K->6022161K(14260672K)After GC:
Statistics for BinaryTreeDictionary:
------------------------------------
Total Free Space: 530579346
Max Chunk Size: 332576815
Number of Blocks: 7178
Av. Block Size: 73917
Tree Height: 44
After GC:
Statistics for BinaryTreeDictionary:
------------------------------------
Total Free Space: 2524251
Max Chunk Size: 2519552
Number of Blocks: 13
Av. Block Size: 194173
Tree Height: 8
, 0.0552970 secs] [Times: user=0.67 sys=0.00, real=0.06 secs]](https://image.slidesharecdn.com/becomeagchero-170627063634/75/Become-a-Garbage-Collection-Hero-9-2048.jpg)


![GC Time
• Real is wall clock time – time from start to finish of the call. This is all elapsed
time including time slices used by other processes and time the process spends
blocked (for example if it is waiting for I/O to complete).
• Sys is the amount of CPU time spent in the kernel within the process. This means
executing CPU time spent in system calls within the kernel, as opposed to library
code, which is still running in user-space. Like ‘user’, this is only CPU time used by
the process.
• User is the amount of CPU time spent in user-mode code (outside the kernel)
within the process. This is only actual CPU time used in executing the process.
Other processes and time the process spends blocked do not count towards this
figure.
• User+Sys will tell you how much actual CPU time your process used. Note that
this is across all CPUs, so if the process has multiple threads it could potentially
exceed the wall clock time reported by Real.
[Times: user=11.53 sys=1.38, real=1.03 secs]](https://image.slidesharecdn.com/becomeagchero-170627063634/75/Become-a-Garbage-Collection-Hero-28-2048.jpg)


The document discusses performance metrics related to garbage collection (GC) in applications, emphasizing the importance of measuring key performance indicators such as latency and throughput. It outlines various GC log formats across different JVM vendors, including Oracle, IBM, and Android's Dalvik VM, and provides examples of GC events and their timings. The document also mentions the necessity of enabling GC logs for better analysis of memory and CPU utilization, and offers insights into optimizing performance by minimizing GC pause times.