Downloaded 10 times

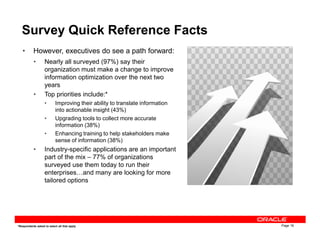
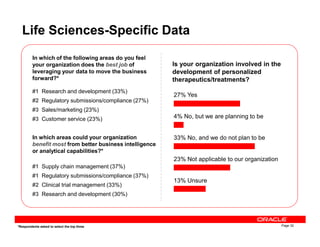
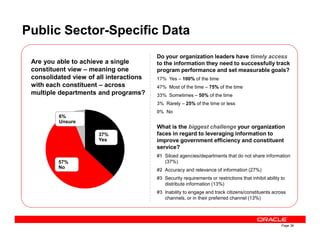
![The Path Forward
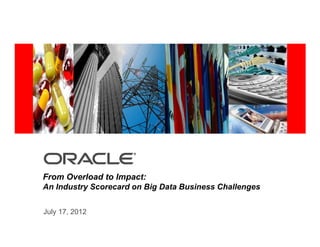
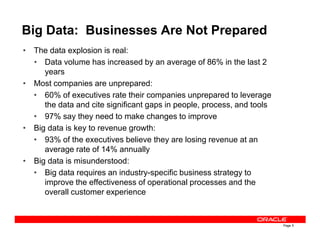
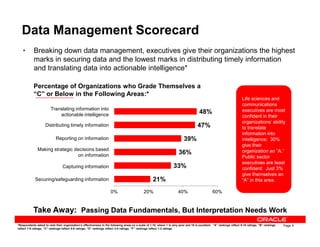
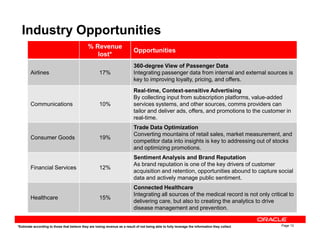
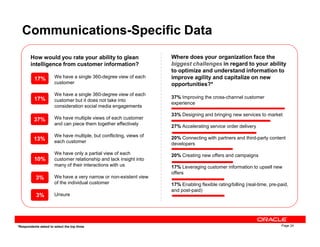
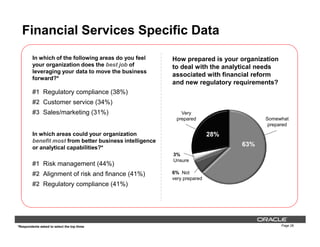
• Executives from organizations ready to manage the data deluge offer
recommendations for successful preparation
What steps has your organization taken to prepare?*
“We have streamlined information
systems so the information can get to the
required party faster. We also outsource a
portion of our information management.”
– President/CEO/COO, Life Sciences
“We identified the weaknesses in our data
gathering system and are now designing a
new software and analytical platform to
address these needs.”
– President/CEO/COO, Utilities
Page 16
Take Away: Leaders Recommend Upgrading Technology, Staff, and Strategy
*According to respondents who rank their organization’s preparedness to handle a data deluge a 6-10 on a scale of 1-10 where 1 is not at all prepared and 10 is
completely prepared
– President/CEO/COO, Life Sciences
“We are working with business units to
determine our needs and trying to figure out
how to get different systems to talk to each
other.” – CIO/CTO, Utilities
“We have changed our [storage] architecture
and are looking to improve our backup
capabilities.” – CIO/CTO, Manufacturing
– President/CEO/COO, Utilities
“We are growing our talent and staffing,
balancing the team with the growth we
expect in data.” – CFO, Financial Services
“We have tripled our storage
capabilities in the last month. We now
have shared storage on our computer
systems.” – CIO/CTO, Oil & Gas](https://image.slidesharecdn.com/frombigdataoverloadtobusinessimpact-130819165740-phpapp01/85/From-big-data-overload-to-business-impact-16-320.jpg)

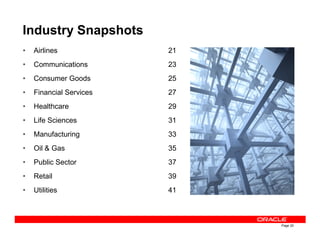

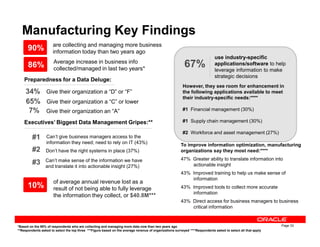
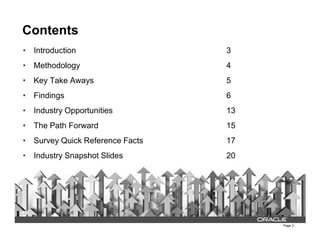
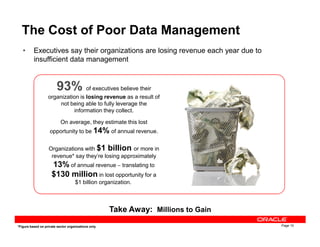
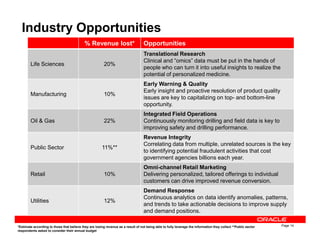
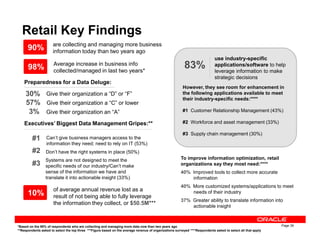
![Manufacturing-Specific Data
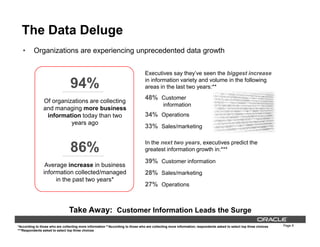
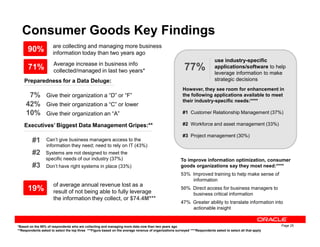
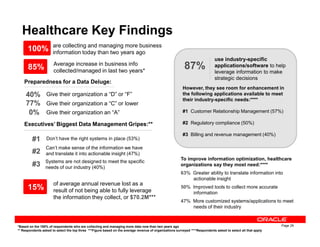
In which areas are you making the best use of
information to drive business growth?*
#1 Sales and marketing (47%)
#2 Engineering and design (43%)
#3 Supply chain (40%)
#3 Production (40%)
#4 Distribution (20%)
Where are you struggling most to capture
information and make high-impact
business decisions from it?*
#1 Sales and marketing (27%)
#2 Supply chain (23%)
#3 Production (13%)
#3 Service (13%)
#3 Finance (13%)
27% said “we are
not struggling in
Page 34
#4 Distribution (20%)
#5 Finance (17%)
#3 Finance (13%)
*Respondents asked to select the top three
How would having access to the information you require enable you to make better decisions?
What types of decisions would you like to be able to make with this data?
“More information would keep the machines running better and increase reliability.”
“The more information received, the better the product.”
“[Data would enable us to] forecast trends in customer buying behavior to better plan new products and
anticipate industry changes.”
not struggling in
any area”](https://image.slidesharecdn.com/frombigdataoverloadtobusinessimpact-130819165740-phpapp01/85/From-big-data-overload-to-business-impact-34-320.jpg)


The document summarizes the key findings of a survey of 333 North American C-level executives about their organizations' preparedness to manage big data and leverage it effectively. The following were among the main findings: - Organizations have seen an 86% average increase in data volume in the last 2 years, especially customer, operations, and sales/marketing data. - However, 60% of executives rated their organizations as unprepared (C or lower), with 29% giving a D or F. Healthcare executives were least confident. - Top frustrations included lacking the right systems to gather data and inability to give managers timely access to information. - 93% of executives believe they are losing an average of