This document provides an introduction to the Indian Standard Code of Practice for Design Loads (Other than Earthquake) for Buildings and Structures Part 3 Wind Loads [IS 875 (Part 3): 1987]. It discusses the background and shortfalls of the previous 1964 code. The nature of wind is described, distinguishing between rotating winds like cyclones and tornadoes, and non-rotating pressure system winds. The new 1987 code aims to provide more rational wind loading guidelines based on recent advances in understanding wind effects on structures.

![EXPLANATORY HANDBOOK
ON
INDIAN STANDARD CODE OF PRACTICE FOR
DESIGN LOADS (OTHER THAN EARTHQUAKE)
FOR BUILDINGS AND STRUCTURES
PART 3 WIND LOADS
[IS 875 (PART 3): 1987]
0 BIS 2001
BUREAU OF IN DIAN STANDARDS
MANAK BHAVAN, 9 BAHADUR SHAH ZAFAR MARG
NEW DELHI 110002](https://image.slidesharecdn.com/is875-windload-111116012529-phpapp02/85/Is-875-wind-load-2-320.jpg)


![14. Handbook on Functional Requirements of Buildings (Other than Industrial Buildings) (SP 41: 1987)
15. Handbook on structures with Reinforced Concrete Portal Frames (without Cranes) (SP 43: 1987)
16. Handbook on Structures with Steel Lattice Portal Frames (without Cranes) (SP 47: 1987)
17. Handbook on Building Construction Practices (Other than Electrical Services) (SP 62: 1997)
18. Handbook on Construction Safety Practices (SP 70: 2001)
This Handbook has been written with a view to provide detailed background information on the provision of
Indian Standard on Code of Practice for Design Loads (Other than Earthquake) for Buildings and Structures :
Part 3 Wind Loads [1S875 (Part 3): 1987] and also the use of standard for arriving at the wind loads on buildings
and structures while evaluating their structural safety. The Handbook will serve as a guide for all those engaged
in the structural design of wind sensitive buildlngs and structures due to their shape, slenderness, flexibility, size
and lightness.
It maybe noted that the Handbook does not form part of any Indian Standard on the subject and does not have
the status of an Indian Standard. Wherever, if there is any dispute about the interpretation or opinion expressed
in this Handbook, the provisions of the codes only shall apply; the provisions of this Hankbook should be
considered as only supplementary and informative.
The Handbook is based on the first draft prepared by Shri S.K. Agarwal, Head, Wind Engineering, SERC,
Ghaziabad. The draft Handbook was circulated for review to STUP Consultants Ltd, Mumbai; National Council
for Cement and Building Materials, New Delhi; Central Public Works Department, New Delhi; Indian Institute
of Technology, Chennai; Indian Institute of Technology, KanpuG Structural Engineering Research Centre,
Chennai; M.N. Dastur & Co Ltd, Kolkata; Meteorological Office, Pune; Indian Institute of Science, Bangalore;
University of Roorkee, Roorkee; Tandon Consultants Pvt Ltd, New Delhi; Central Electricity Authority, New
Delhi; Indian Institute of Technolo~y, Kharagpuq Indian Institute of Technology, New Delhi; Engineers India
Ltd, New Delhi; N.T.P.C., Noida; Ministry of Railways (RDSO), Lucknow; Department of Space, Bangalore;
Nuclear Power Corporation, Mumbai; Moti Lal Nehru Regional Engineering College, Allahabad; VaJcilMehta
Seth, Ahmedabad; Anna University, Chennai; UNITECH, New Delhi; Consulting Engineering Services (I) Pvt
Ltd, New Delhi; Tata Consulting Engineers, Mumbai; Housing &Urban Development Corporation, New Delhi;
National Institute of Construction Management and Research, Mumbai; Howe India (Pvt) Ltd, New Delhi; Army
Headquarters, New Delhi; Institution of Engineers, New Delhi; Gammons India Ltd, Mumbai; Central Building
Research Institute, Roorkee; Department of Science & Technology, New Delhi; Metallurgical& Engineering
Consultants (India) Ltd, Ranchi; Planning Commission, New Delhi; and views expressed by them were taken
into consideration while finalizing the Handbook.
(vi)](https://image.slidesharecdn.com/is875-windload-111116012529-phpapp02/85/Is-875-wind-load-7-320.jpg)

![SP 64 (S & T) :2001
O INTRODUCTION which approached or crossed the Indian coasts during
1890 to 1960, together with the wind data available
0.1 Background
from about 10-12 continuously recording Dynes Pres-
A large number of structures that are being constructed sure Anemograph (DPA) stations which existed at that
at present tend to be wind-sensitive because of their time, to get an overall picture for the country. However
shapes, slenderness, flexibility, size and lightness. 3-cup anemometer readings were not much used in the
Added to these are the use of a variety of materials preparation of wind maps because much of such data
which are stressed to much higher percentage of their were synoptic.
ultimate strength than in earlier days because of better
The height of DPA instruments varied from 10 m to
assurance of the quality of materials. In the social
30 m at different places. Therefore only one extreme
environment that is developing world over, the ancient
value of wind was given up to 30 m height from ground
philosophy of accepting continuing disasters due to
level without any variation in-between. Further, l/10th
wind as ordained by ‘fate’ and Gods is giving place to
power law had been adopted regardless of terrain
demands for economical wind resistant designs. These
conditions, for indicating variation of wind speed with
factors have demanded a more realistic, if not, precise
height from 30 m to 150 m, for which there was no
definition of wind loading. Updating of some
supportive evidence. The code gave two wind pressure
International Codes of practice, notably the British,
maps (one giving winds of shorter duration <5 minutes
Australian, Canadian, American and French has been
and another excludlng winds of shorter duration) and
effected fairly frequently over the last two decades and
there was no clear guidance for using either or both of
the present versions incorporate most of the advances
them.
made in understanding the wind characteristics and its
effect on structures. The new discoveries are such that With the publication of the recent revised wind code,
it is clear that mere issue of amendments to the earlier IS 875 (Part 3) : 1987, an attempt has been made to
wind Code IS 875 : 1964 will not be justifiable. The remove these deficiencies and provide to the Indian
recently issued wind code ‘Code of practice for design structural engineer adequate guidelines for arriving at
loads (other than earthquake) for buildings and more rational wind loading for design purposes.
structures’ IS 875 (Part 3): 1987 differs in many ways
from the previous Code first issued in 1964 and 0.2 Nature of Wind
attempts not only to rectify the shortfalls of the 1964
0.2.1 Wind means the motion of air in the atmosphere.
code but incorporates recent knowledge of wind
The response of structures to wind depends on the
effects on structures. The height up to which velocities
characteristics of the wind. From the point of view of
are given has now been raised to 500 m and the
assessing wind load, it is convenient to divide the wind
loadings on as many of the commonly encountered
into two categories: ‘Rotating and Non-rotating’
buildings and structures, for which there are no other
winds. Rotating winds are caused by tropical cyclones
Indian Standards, have been included. Although not
and tornadoes. The wind speeds caused by these may
explicitly stated, the code recognizes the fact that most
exceed 200 kti. The duration of such winds at any
of the high winds in India occur due to short duration
Ioeation varies from 2 to 5 minutes in the case of
rotating winds like tropical cyclones along the Coasts
tornadoes and thunderstorms and about 3 to 4 days in
or Tornadoes elsewhere, and nearly rectilinear winds
case of tropical cyclones. Non-rotating winds are
of short duration like thunderstorms at many places. In
caused by differential pressures and thus move in
this respect, the high wind loading conditions in India
preferred direction. These are also called ‘Pressure
are different from those of temperate zone countries
System’ winds and when they persist for distances like
like Europe and Canada. Much of the random response
50-100 km, are termed as ‘Fully developed pressure
theories, which have been adopted in EuropanA-J.S. or
system winds’. The intensity of such winds is usual]y
Australian Codes are based on these ‘fully developed
given in Beaufort Scale as in Table 1 (other scales for
pressure winds’ or ‘pressure wind’ conditions and
particular types of winds like cyclones have also been
strictly cannot be applied in most parts of India. But
proposed). Thunderstorms are rectilinear winds of
their judicious use, in the absence of proper theories
high speed lasting only a few minutes and start as a
applicable to cyclones, tornadoes and thunderstorms
strong vertical downdraft, from clouds which spread
will give adequate safety margins and this is what the
laterally on reaching the ground. They last for 2 to
present 1S 875 (Part 3) :1987 attempts to do.
5 minutes and wind speed can exceed 200 km/h.
In India, success in satisfactory codification of wind
loading on structures has remained elusive so far. In 0.2.2 Gradient Winak
most cases, codification has followed, not preceded
Winds are primarily caused by the differences in
structural failures or distress. The wind maps given in
temperature over the earth’s surface because the
the 1964 version of the code had been prepared mainl y
intensity of the sun’s radiation received at different
on the basis of extreme value wind data from storms
1](https://image.slidesharecdn.com/is875-windload-111116012529-phpapp02/85/Is-875-wind-load-9-320.jpg)


![SP 64 (S & T) :2001
configurations and solidlty ratios, no guidance was 2 TERMINOLOGY
avai Iable. Therefore it became essential for the
2.1 Angle of Attack [3.1.1]
designer to either consult other International Codes or
take advice from specialists. Angle between the direction of wind and the reference
axis is known as the angle of attack. As shown in
0.3.9 Pressure Coefficients Fig. 5(a), angle %’ is angle of attack, between the
direction of wind and reference axis (horizontal line).
All over the world, the unsatisfactory performance of
relatively light weight low rise buildings such as the 2.2 Breadth [3.1.2]
thatched houses in rural India or houses with sheet Horizontal dimension of the building measured normal
roofing, led to updating of pressure coefficients to the direction of wind, is termed as the breadth of the
(internal and external) for various configurations of structure. As shown in Fig. 5(b), breadth =AB for wind
buildings, wall openings and wind directions. along the longitudinal reference axis and BK for wind
Additionally, a need was felt to define higher local perpendicular to it. For other wind directions, such as
external negative coefficients at certain locations to at angle ’0’, it is the maximum width seen along the
cater to concentrations near edges of walls and roofs, wind such as the projection of AB’ on a plane
where the failures are primarily initiated. It is perpendicular to the direction of wind. In Fig. 5(b),
recognized that considerable research is still needed in this is AE.
this area.
2.3 Depth [3.1.3]
1 SCOPE Horizontal dimension of the building measured in the
direction of wind is the depth of the building. As shown
The aim of this Handbook is to provide detailed in Fig. 5(b), depth = AA’for wind along the reference
background information on the provisions of IS 875 axis and BA for wind perpendicular to the reference
(Part 3) : 1987 and the use of the standard for axis. For other wind directions, such as at angle ‘f3’,it
estimating wind loads on structures. The emphasis has is the maximum length from the first point on the body
been on the identification of source material used, which meets the wind to the point where a line from
philosophical ideas behind the changes in 1987 edition this point along-wind meets a boundary of the body
and guidance to the use of the standard. Clauses 0.1 such as BD.
and O.2 of this Handbook contains background
2.4 Developed Height [3.1.4]
information, philosophical ideas, nature of wind and
wind effects on structures. Clause 0.3 brings out the The velocity increases up to certain height from the
shortfalls of the earlier standard (IS 875: 1964), ground when wind passes from one terrain category
vis-a-vis wind zoning, risk level, wind velocity and its to another terrain category. After covering a certain
variation with height, dynamic analysis, effect of distance in the new terrain, the velocity profile does
structure size and shape. Clause 2 explains the various not change any more and is said to be fully developed.
terminology used in the standard. Clause 3 discusses Before becoming fully developed, the velocity profile
the main features of the revised Code like new wind will have a mixed character of the fully developed
zoning map, estimation of design wind speed, concept profiles of the upstream and downstream terrains. In
of return period, effects of terrain roughness and this intermediate region, the height up to which the
structure size, local topography, correct velocity profile changes in the new terrain is known as
velocity-pressure relationship. In Clause 4 wind the Developed Height. [Table 3] gives the vahtes of the
pressure and forces on buildings/structures are Developed Height as a function of the distance for the
discussed in light of pressure coefficient method. four terrain categories. Methodology for estimation of
Details of force coefficient method are given in 4.3 the developed height and for using the same has been
while dynamic effects like along-wind and illustrated in the solved Examples given in 3.5.
across-wind responses are explained in 5 and 6. 2.5 Effective Frontal Area [3.1.5]
Requirements of wind tunnel studies are detailed in 7.
Clause 8 conducts the user to the various provisions of As given in Fig. 5(a) for angle of attack ’6’ = O,
the standard with the help of flow diagrams. Clause 9 effective frontal area is ABCD, which is the projected
contains the methodology for the estimation of wind area of the structure normal to the direction of the
loads on low rise buildings, with the help of examples. wind. For ‘til’not equal to zero, the frontal area is
ACEF.
Clause 9.3 is devoted to the estimation of dynamic
effects of wind using gust factor method and contains 2.6 Element Surface Area [3.1.6]
typical solved examples of structures. In Fig. 5(a), for angle of attack ‘f3’= Oat height z, area
NOTE—AllClauses,FiguresandTablesin SquareBracketsin PQRS represents the element surface area of height
the HandbookRefer to Clause Numbers,FigureNumbersand Az. In the element surface area pressure/force
TableNumbersof IS 875(Part3): 1987,respectively coefficients are to be taken constant.
8](https://image.slidesharecdn.com/is875-windload-111116012529-phpapp02/85/Is-875-wind-load-16-320.jpg)
![SP 64 (S & T) :2001
2.7 Force and Moment Coefficients [3.1.7] 2.9 Gradient Height [3.1.9]
When a structure is immersed in flowing fluid like air, When wind moves over large distances in a particular
a force is exerted on it which depends on the nature of terrain, the velocity becomes constant above a certain
flow, type of structure and is expressed in terms of height. The height above which the velocity is found
non-dimensional coefficient. This non-dimensional to be constant and is not influenced by surface friction
coefficient is termed as force-coefficient. is called the Gradient Height. Implicitly, the Code
There can be components of force in the directions identifies the gradient height as the height of the
other than the direction of wind. The force component planetary boundary Iayev the wording of the definition
along the direction of wind is called drag force (now- is obviously very carefully done, since the
a-days, more frequently as along-wind force) and the meteorologists’ identify the gradient height as one at
force components in the other normal directions are which there is a balance of Coriolis and pressure
termed as lift force (or across-wind force) and side forces. The meteorologists’ definition of gradient
force (or transverse force). Likewise, the moment height puts it well above the edge of the atmospheric
coefficient tending to bend the structure in the direc- boundary layer. Thus the definition of gradient height
tion of wind is called the over turning moment, the used in the Code is not the same as the gradient height
coefficient tending to twist it about a vertical axis as as understood by the meteorologists.
torque and the coefficient in the transverse direction as 2.10 Pressure Coefficient [3.1.9]
‘sideways’ moment coefficient.
2.8 Ground Roughness [3.1.8] The pressure exerted by wind at a point on the structure
wil I be different from the pressure of wind far
The obstructions like trees, buildings, structures, etc, upstream of the structure, called ‘free stream static
on ground are termed as ground roughness. The ground pressure’. The ratio of the difference of the pressure
roughness tends to retard the flow near ground because at a point on the structure and static p~ssum of the
of momentum transfer between layers of wind. The incident wind to the design wind pressure is termed as
velocity profile of wind is dependent on the ground Pressure Coefficient.
roughness. Although the nature of ground roughness
on the surface of the earth varies from flat and very The concept of pressure coefficient is similar to that of
smooth to very rough as in the city centres with tall force coefficient. The pressure coefficient at a point
buildings, it has been found convenient and adequate multiplied by design wind pressure yields the pressure
to categorize them into four fairly distinct categories. at that point.
J
/’7
#
e e“
WIND DIRECWM
(e)
AXIS
RENCE
(b)
VJINDIN PLAN BUILDINGPLAN
FIG. 5 WIND EFFECTSON A BUILDING
9](https://image.slidesharecdn.com/is875-windload-111116012529-phpapp02/85/Is-875-wind-load-17-320.jpg)
![SP 64 (S & T) :2001
The pressure coefficient may vary with height or 2.12 Solidity Ratio ‘$’ [3.1.9]
width. The pressure acting towards the surface of In general, solidity ratio is the ratio of the sum of all
structure is to be taken as positive and pressure acting the areas’ of each element of a framed structure
away from the surface of structure is to be taken as normal to the wind to the area of the boundary
negative. enclosing the structure. Care must, however, be taken
2.11 Suction [3.1.9] in applying “this definition. In a plane frame, the
boundary area is to be taken as that of the main frame
Atsomepoints on anybody, pressure may fall below only and the areas of appurtenances which are within
atmospheric pressure and is called ‘suction’. Suction the boundary [as AntennaAl, or ladderLl, in Fig. 6(a)]
is the pressure acting away from the surface of treated as part of the element of the frame. However,
structure; negative pressure is the same as suction the area of the antenna or an appurtenance outside the
pressure. boundary such as the AntennaA2 or lightening arrester
6(a) Plane Frame
0’ c’
(ii)
(i)
6(b) Space Frame
FIG.6 SOLmITY
RATIO PLANE SPACE
— AND FRAME
10](https://image.slidesharecdn.com/is875-windload-111116012529-phpapp02/85/Is-875-wind-load-18-320.jpg)
![SP 64 (S & T) :2001
L~ in Fig. 6(a) should not be taken into account either Terrain category 1 (TC- 1) applies to exposed open
as part of the enclosed boundary or that of the frame terrain with few or no obstructions and in which the
in computing the solidity ratio. The loads on such average height of objects surroundings the structure is
appurtenances outside the enclosed boundary must be less than 1.5 m. Category 2 (TC-2) refers to open
separately estimated and added to the load on the frame terrain with well scattered obstructions having heights
at the appropriate point. In Fig. 6(a), the area enclosed generally between 1.5 to 10 m while Category 3 (TC-3)
by ABCD k the boundary area and the area of shaded applies to terrain with numerous closely spaced
elements to be considered for estimating the solidity obstructions having size of buildings/structures up to
ratio is indicated. Similar principles apply in the case 10 m in height with or without a few isolated tall
of space frames. In case of cross bracings, the structures. Terrain Category 4 (TC-4) means terrain
projected area as seen from windward face shall be with numerous large high closely spaced obstructions.
taken and added to other areas (shown shaded) to However, when fetch lengths are small, the velocity
arrive at the total solidity ratio. If there are profile is not fully developed and suitable velocity
appurtenances within the enclosed volume (ABCD profile with changes in terrain categories be
A’B’C’D’) [see Fig. 6(b)(i)], then their area should be considered [5.3.2.4].
projected on the nearest windward frame for
estimating the frame solidity ratio Fig. 6(b)(ii). The 2.15 Velocity profile [3.1.9]
solidity ratio of each frame should be found and The variation of wind speed with height is called the
appropriate shielding factor applied. Velocity Profile. The velocity profile is dependent on
2.13 Fetch Length [3.1.9] the terrain category, zonal velocity and the fetch
length. Figure 8 shows the velocity profile in the four
The distance over which wind has moved in a terrain categories.
particular terrain category before approaching the
2.16 Topography [3.1.9]
structure is known as the Fetch Length. The velocity
profile of wind changes continuously over the fetch Geographical features such as mountains, hills,
length before stabilizing at the variation given in escarpments, etc, of an area is known as the
[Table 2]. The distance required for a stab]: profile to Topography of the area in which the structure is built
be formed is given in [Table 3]. Distance AB in Fig. 7 and this affects the wind speed on and downstream of
is the fetch length. these features.
2.14 Terrain Category [3.1.9] 3 WIND SPEED AND PRESSURE [5]
Buildings, vegetation, walls, trees and waves at sea 3.1 Basic Wind Speed [5.2]
contribute to the surface roughness and thus influence
the local characteristics to which a structtue may be In 1960, there existed about 10-12 continuously
exposed. The average ground roughness of large areas recording DPA stations in the country compared to
is termed as Terrain Category. Based on the average about 50 or so such stations at present. The instruments
height of the ground roughness four representative continuously record wind speed on Y-axis with time
terrain categories having fully developed velocity on X-axis and in addition, record the direction of wind
profiles are suggested [5.3.2] from the equivalent of a speed. Most of these stations are located on the coastal
calm sea to inner city area dominated by tall buildings. belt.
H
MODIFIEO VELOCITY
PROFILE DUE TO
CHANGE OF
ROUGHNESS
H
h:
MEAN GROUND
LEvEL
APPROACHING VELOCITY
PROFILE
‘I?==4’(b,
(a)
FIG. 7 EFFECTOFCHANGE INTERRAIN
CATEGORIES
11](https://image.slidesharecdn.com/is875-windload-111116012529-phpapp02/85/Is-875-wind-load-19-320.jpg)
![SP 64 (S & T) :2001
The revised wind map is based mainly on the data from Cyclonic Storms — Cyclonic storms on east and west
the anemograph records of 47 DPA stations for periods coasts are more intense over the sea than on the land.
from 1948 to 1983. All these wind data have been West coast storms are less intense except in Northern
published in India Meteorological Department publi- Sourashtra compared to east coast storms. Reports of
cations, ‘Indian Weather Review, Annual Summary failures of structures at Sriharikota, Gujarat coast,
Part-A’ published annually from 1948 onwards. The Paradeep and other places have been taken into ac-
basic approach followed for preparing the wind map count for evolving the reference speed in these regions.
is by extracting wind velocities, since analysis of stmc- Storm speeds begin to decrease once they cross the
tures in many cases depends on wind speed directly coast and are normally taken to be effective up to a
and also much of the available data on effects of terrain distance of about 60 km inland after striking the coast.
is in terms of wind speed. The use of wind speeds for However, in Bengal coast its effect has been observed
statistical analysis is also in line with the internatio- up to 110 km inland. A region along the sea coast
nallyaccepted practice. The peak values of annual extending up to a distance of 60 km (and 110 km along
maximum wind speeds (wind gustiness) for each of the Bengal coast) from the nearest coast line has been
47 stations formed the data for statistical analysis to identified separately from the main land for wind
obtain the extreme wind speeds. In the statistical zoning. In addition, it has also been decided to give the
analysis of all the annual peaks at each of the above 47 number of cyclones that have struck different sections
stations in India, IMD used Fisher-Tippet Type-I of east and west coasts in the basic wind map for more
(Gumbal) distribution. Before analyzing, recorded sophisticated design load estimation.
values were reduced to values at 10 m height above
ground for the normalized terrain Category 2. Since Dust Storms — Dust storms associated with high local
the data for analyses came from DPA which has an wind speeds which are short lived and are particularly
averaging time of about 3 seconds, analysis gives gust intense over Rajasthan plains have been considered.
velocity values averaged over 3 seconds. These values Also Norwesters or Kal Baisaki winds over North
for 50 year return period and 50 year structure life have Eastern plains during summer months have been ac-
been given in [Fig. 1] for terrain Category 2. In addi- counted for. It has been suggested that the influence of
tion to the use of data available from 47 DPA stations wind speed off the coast up to a distance of about
up to 1983, the following effects have been suitably 200 km maybe taken as 1.15 times the value on the
incorporated in the preparation of the basic wind nearest coast in the absence of definite wind data [5.5]
velocity map: as in Australia. The occurrence of a tornado is possible
in virtually any part of India. They are particularly
Orography — Orography has been considered in the more severe in Northern parts of India. The recorded
zoning of wind velocity map since it was observed that number of these tornadoes is too small to assign any
continuous hills and mountains spread over a large frequency. The devastation caused by a tornado is due
area affect wind speed, for example regions demar- to exceptionally high winds about its periphery and the
cated by Vindhya mountains. The data spread seems sudden reduction in atmospheric pressure at its centre
to match the orography of the country. resulting in a huge outward pressure on the elements
of the structure. The regional basic wind speeds do not
Palghat Gap — Extreme winds observed during mon- include any allowance for tornadoes directly. It is not
soon season over the southern peninsula due to the the usual practice to allow for the effect of tornadoes
funneling effect of Palghat gap (reported wind speeds unless special requirements are called for as in the case
being up to 160 km/h) has been considered. of important structures such as satellite communica-
500
t I ++%%
OPENSEA OPENTERRAIN FOREST
StJWRRS CITY CENTFES
FIG. 8 VELOCITY
PROFILE
OVERDIFFERENTTERRAINCATEGORIES
12](https://image.slidesharecdn.com/is875-windload-111116012529-phpapp02/85/Is-875-wind-load-20-320.jpg)
![SP64(S&T) :2001
tion towers. The wind speed can now be obtained up level’, on the other hand means the probability that a
to 500 m height above the ground surface. Design wind given wind speed will be exceeded in a certain number
speed up to 10 m height from mean ground level is of successive years which is usually the life of the
taken to be constant. Although not stated in the Code, structure. The coefficient kl is identified in the Code
turbulence level above 500 m is unlikely to be more for return periods of 5,25,50 and 100 years alongwith
than 6 percent. Basic wind speed map of India has been recommendations regarding ‘mean probable design
presented in the Code. The reference wind speed all life of structures’ of various types [Table 1]. For
over the country has been found to fall into six ranges general buildings and structures of permanent nature,
of basic wind speeds, varying from 33 m/s to 55 nds the return periods have been recommended to be 50
for a 50 year return period and a probability of ex- years and a life of 50 years for the structure. For all
ceedence level of 63 percent. The indicated wind speed temporary structures including temporary boundary
characteristics are in line with other International walls, it is recommended that a life of 5 years be
Codes, namely short duration gusts averaged over a assumed and the appropriate multiplier kl as given in
time interval of about 3 seconds applicable to 10 m [Table 1] be used. The normal value of risk level
height in ‘open’ terrain. The Code recognizes that recommended is 0.63 for structures whose life
there is not enough meteorological data to draw expectancy is equal to the return period. The factor kl
isotachs (lines joining places of equal velocity) on the has been used to assess the effect of different risk
wind map of India as seems to be the practice in some levels.
other International Codes.
At first sight, a risk level of 0.63, which is the prob-
The revised map, when compared to that of the earlier ability that the design wind speed is exceeded once in
Code shows that in general, in the following areas of the life of say N years of the structure under the
the country, the wind velocity was previously under- condition that the probability of the exceedence of the
estimated: design wind in any one year is l/N, seems rather high.
— Nollh : North-eastern part of Jammu and However experience in many parts of the world has
Kashmir shown that this amount of risk can be taken for normal
— West: Coastal areas of Kutch in Gujarat structures. Although not given in the Code, the risk
— East: Tripura and Mizoram level can be found from the formula
The wind map indicates updated supplementary infor- r=l–(1–l/T)~ ...(7)
mation (1877 to 1982) relating to the total number of
where
cyclonic storms. Occasionally, a user comes across a
N = desired life of the structure in years,
situation where the wind speed at a location on the
T = return period in years, and
boundary between two zones has to be obtained. If
r = risk level.
local wind data is not available, it is recommended that
the higher speed of the adjacent zones be used for The designer or owner must decide the amount of risk,
design. he is prepared to take. Let us take one example.
3.2 Design Wind Speed [5.3] Example. Only 10% risk acceptable, life 30
The design wind speed is dependent on the years, in zone with wind speed of 39 rids,
geographical basic wind speed, return period, height Categoq 2, size of structure 30 m. To find the design
above ground, structure size and local topography. The wind speed.
format of the equation of design wind speed adopted From Eqn (7), we get
in the new Code is as follows:
UT = 1-( l-r)l’N
Vz = Vb k, kz k~ ...(6) = 3.5x 10⁻³
where That is, this is the acceptable probability that the
V. = design wind speed at height z in mls, regional wind speed of 39 rmlswill be exceeded in any
Vh = basic wind speed of the wind zone, one year during the 30 year life of the structure for the
k, = risk coefficient, accepted risk. Using the above values of risk level, life
kz = terrain, height and structure size factor, and of structure and the quantities A and B corresponding
k~ = local topography factor. to 39 m/s wind speed in [Table 1], one obtains
3.3 Risk Coefficient [5.3.1] kl = 1.165.
There is sometimes confusion as to the meaning of Hence, the regional basic wind speed to be used for
return period and risk level. Return period (Tin years) this structure should be 1.165 x 39 = 45.44 rids. Use
is the reciprocal of the probability that a given wind of Eqn. (7) is necessary if the return period T only is
speed will be exceeded at least once in any one year. known from analysis of wind data and risk level has to
The word, ‘period’ sometimes causes confusion. ‘Risk be assessed.
13](https://image.slidesharecdn.com/is875-windload-111116012529-phpapp02/85/Is-875-wind-load-21-320.jpg)
![SP 64 (S & T) :2001
3.4 Terrain, Height and Structure Size (kz factor) to a height of 35 m at a distance of 0.5 km from B2.
[5.3.2] Hence one takes the multiplier of TC-3 [Class C of
The coefficient k2 has been indicated at different Table 2] up to a height of 35 m (by interpolation).
heights in a convenient tabular form [Table 2] which Above this height, the multipliers of TC-1 are to be
identifies four terrain categories (1, 2,3 or 4) and three used. At a height of 35 m, the multiplier corresponding
classes (that is, sizes) of structures (A, B or C). The k2 to TC-3 is to be used when computing the design load
factors are valid only up to the height at which they are on the tower, although the multipliers of both TC- 1 and
specified. For example, the factor 1.17 in TC-2, class TC-3 are shown at this height in this sketch. The final
A structure applies only up to 50 m height. As stated design multipliers are shown in Table 3.
in [Note 2 of Table 2], values between 1.12 and 1.17
Table 3 Multipliers for a Structure in TC-3 with
may be linearly interpolated between heights of 40 m
Upstream TC-1
and 50 m or a constant value of 1.17 (the higher one)
@ample 1)
may be used between 40 m and 50 m. The coefficient
k2 has different values [Table 33] when dealing with
wind speeds averaged over 1 hour, which are required Height (m) Multipliers as per Multipliers as per
[5.3.2.4(b)(i)] [AppendixB]
for evaluating dynamic effects according to certain
10 0.99 0.82
theories.
15 1.03 0.87
3.5 Fetch and Developed Height Relationship
20 1.06 0.91
[5.3.2.4]
30 1.09 0.96
The revised Code had added the concept of fetch
35 1.10 1.04
length and developed height for considering the effect
of change of terrain category. In the following 50 1.14 1.14
examples the methodology for considering this effect 55 1.15 1.15
is explained with the help of illustrations.
NOTE- It is observedthat the applicationof [5.3.2.4(b)(i)]
Example 1. A framed tower structure inside a big leadsto higheror conservativeload.
town at a distance of 0.5 km from the edge of the town;
the terrain outside the town isJat open, the structures Example 2. A chimney of height 150 m in open
inside the town are closely spaced and of heights up to country at a distance of 10 km from clusters of scat-
10 m. Height of the tower 55 m. Tofind the design wind teredsmall villages all round with houses of height less
speeds. than 10 m. Tofind the wind speed multiplier profile.
Solution: Here, one can take the terrain outside the Solution: Since the terrain up to a distance of 10.0 km
town as of category 1 (TC- 1) and the terrain inside the from the chimney is open, one may assume that the
town to be of category 3 (TC-3). This problem is a case terrain is of category 1 up to 10 km from the chimney.
of wind moving from a lower terrain catego~ to a In view of the location of clusters of small villages
higher terrain category. Figure 9 gives a sketch of the beyond 10 km, one can consider the approaching
configuration. profile to chimney to be TC-2 from beyond 10.0 km
and TC- 1 for a distance of 10 km from the chimney.
In the above sketch,AA is the edge of TC-1profile (say,
Figure 10 gives the sketch of the configuration. It may
where the factor as per [Table 2] is 1.35), B1B2is the
be observed that in this problem, the wind flows from
approach terrain of TC- 1 and B2B3is the town centre
a higher terrain category to a lower terrain category. In
terrain of TC-3 [5.3.2.1(c)]. The tower is located at C,
Fig. 10,AA is the edge of the TC-2 profile (say the line
a distance of 0.5 km from the beginning of the town at
of multiplier 1.35), B1B2is the approach terrain TC-2
B2. In order to apply [5.3.2.3], one proceeds as follows:
and B2B3 the TC- 1 in which the chimney is located.
At C draw the profile of multipliers as per [Table 2, The chimney is located at C, which is located at a
Class C] (since the height of the structure is more than distance of 10 km from the beginning of TC- 1, namely
50 m), corresponding to both the terrain categories 1 B2. To obtain the appropriate multipliers, one can
and 3. Thus CDH corresponds to TC- 1 and CEFG to proceed as follows:
TC-3. [5.3.2.4] allows one to use two options. As per
[5.3.2.4 (b) (i)], one can use the multipliers of the i) Assume that TC- 1multiplier applies for the
lowest terrain category, which in this case is TC-1, that entire height, as per [5.3.2.4 (b) (i)]
is, CDHG. The second possibility is to use the proce- ii) Use the procedure of [Appendix B] as follows
dure of [Appendix B]. To use the procedure of To use the procedure of [Appendix B], draw the varia-
[Appendix B], one first notes the height up to which tion of the multipliers of TC-2 and TC-1 at C with
the TC-3 profile has penetrated in the vertical direction height. These are mpectively CEFG and CDH. From
in the terrain in which the structure is located. In this ~able 31of the Code,it is observed that the profile of
case, [Table 3] indicates that TC-3 has penetrated up TC-1 penetrates up to a height of 80 m, in a distance](https://image.slidesharecdn.com/is875-windload-111116012529-phpapp02/85/Is-875-wind-load-22-320.jpg)
![SP64(S&T):2001
of 10 km. Thus one takes the TC- 1 multipliers of Class Table 4 Multipliers for a Structure in TC-1 with
C (since the maximum chimney dimension exceeds 50 Upstream TC-2
m) up to a height of 80 m. This multiplier has an (Example 2)
interpolated value of 1.17 at a height of 80 m. Above
this height, one has to take the multipliers as per TC-2, Height (m) Multipliersas per Mukiptieras per
Class C. But the multiplier as per TC-2, Class C has a [5.3.2.4(b) (i)] [AppendixB]
value of 1.17 only at a height of 100 m as per [Table 10 0.99 0.99
2]. The recommendation of [Appendix B] is to take the 15 1.03 1.03
same value of the multiplier as per the terrain of 1.06
20 1.06
location (that is TC-1) up to the height of the upstream
30 1.09 1.09
higher terrain category at which the same multiplier is
found as per [Table 2] of the Code. In this case, the I 50 I 1.14 I 1.14 I
recommendation implies that the multiplier 1.17 at 80 I 80 I 1,17 I 1.17 I
m height of TC- 1 must be continued up to a height of 100 1.20 1.17
100 m, above which only the TC-2 multipliers of Class 150 1.24 1.21
C are to be used. Table 4 gives the final recommended
multipliers. NOTE Asobservedearlier[5.3.2.4(b)(i)]giveshigherloads
—
but is simplerto apply.
A— . .— .
-+-—–A
—.
v
+
/
/
+
TC1
B3
—.— Tc .1
~ TC-3
— DESIGN PROFILE
FIG.9 DETERMINATION
OFVELOCITYPROFILE
NEARA CHANGE
INTERRAINCATEGORY
(LESSROUGHTOMOREROUGH)
15](https://image.slidesharecdn.com/is875-windload-111116012529-phpapp02/85/Is-875-wind-load-23-320.jpg)
![SP64(S&T) :2001
A .— . .— .— -—. .— A
—..
tii’7,xiii#
/
.. /’
./
TC2 Tcl
BI IB2 Ic 83
~— TC-1 PROPILE
--—- TC-2 PROPILE
DEStGNPWFtLE
FIG. 10 DETERMINATION
OFVELOCITY
PROFILE
NEARCHANGE
INTERRAINCATEGORY
(MOREROUGHTOLESSROUGH)
Example 3. A TV tower of height 300 m located in the b) B1B2 is the approach terrain TC-2, B2B3is the
centre of a city with tall buildings (greater than 50 m first intermediate terrain TC- 1, B3B4 is the
in height) up to a height of 3 km from it, closely built second intermediate terrain TC-3 and B4B5is
houses of up to 10 m height from 3 km to 10 km and the final terrain TC-4 in which the TV tower is
jlat terrain beyond for 15 km at which sea coast is located.
encountered. Wind is from the sea. To find the wind c) From Vable 3], it may be easily determined
speed multipliers. that the edge of the TC- 1 profile starting at B2
meets the TV tower at “Clat a height of 100 m,
Solution: This k a problem in which wind passes the edge of TC-3 profile starting at B3meets the
through four terrains before reaching the structure of TV tower C2at a height of 250 m and the edge
interest. At high winds, the sea can be taken as of the TC-4 profile starting at B4meets the TV
equivalent to TC-2 due to the large waves that are tower at C3 at a height of 220 m and the edge
generated. In this problem, TC-2 is followed by TC-1 of the upstream TC-2 profile is at a height of
for 15 km and this is followed bf TC-3 for 10 km with 490 m,
a final terrain category 4 for 3 km. The configuration d) All the four category profiles (of class C since
is sketched in Fig. 11 where the multiplier profiles of the maximum dimension of the structure is
TC- 1 to TC-4 are shown at the location of the TV more than 50 m) have been drawn with origin
tower. As before, one can choose the simpler method at C, the base of the TV tower.
of [5.3.2.4 (b) (i)] and use the multipliers of TC- 1 for e) Proceeding as before, one finds that TC-4
the entire height. To use the alternate method given in swamps TC-1 and is effective up to a height of
[Appendix B], one draws first the developing profiles 220 m, from C to D. At D, one”encounters TC-3
from the beginning of each terrain [Table 3]. beginning at 1$ up to a height of 250 m. Thus
a) AA is the edge of TC-2 (say the line of multi- the profile shifts from D to Eon TC-3 profile
plier 1.35). at a height of 220 m and moves along the TC-3
profile from E to F, which is at a height of
16](https://image.slidesharecdn.com/is875-windload-111116012529-phpapp02/85/Is-875-wind-load-24-320.jpg)
![sP64(s&T):2001
A— Jui?- — .—— —— — .— —— —_ _ -A
H
IT
TC-2 lc-t
Skm 1 b3 7 km B,~ 3km “
, 7 1
— DESIGN PROFILE ‘A— TC-1 PRCFHE —x— TC-3 PROFILE
—o— TC-2 PROFILE
Tc-b PROFILE ----—
FIG. 11 DETERMINATION
OFDESIGNPROFILEINVOLVING ORETHANONE
M
CHANGEINTERRAINCATEGORY
250 m. Above F, the unpenetrated profile is the 3.7 Design Whd Pressure [5.4]
far upstream TC-2 profile and this applies for
the rest of the height of the TV tower. Table 5 One of the important modifications in the Code relates
gives the final multipliers. to the veloeity-pressure relationship. In the earlier
version of the Code, the pressure was over-estimated
Table 5 Multipliers for a Structure in TC-4 with by about 25 percent for a given wind velocity. The
Upstream TC-3, TC-1 and TC-2 correct equation given now reads as follows:
(Example 3) pz = 0.6 VZ2 ...(8)
where
Height (m) Multipliers as per Multipliers as per
[5.3.2.4(b)(i)] [AppendixB] Pz = design wind pressure at height z in N/m2, and
VZ = design wind speed at height z in mh.
10 0.99 0.67
15 1.03 0.67 Strictly speaking, the coefficient 0.6 is only the most
20 1.06 0.83 probable average for the atmospheric conditions
30 1.09 0.83 prevailing in India during the whole year. A value of
50 1.14 1.05 0.6125 would be more appropriate in temperate zones
above latitude of about 33°. The wind effects in terms
100 1.20 1.10
of static loading on the structure are determined from
150 1.24 1.10 design pressures as indicated in 4. A comparison of
200 1.26 1.13 wind pressures as per new and 1964 Code is given in
220(intetpulated) 1.27 1.19 (TC-3 vatue) the following example.
250 1.28 1.26 (lW2 value)
Example. Estimation of design wind pressure for a
300 1.30 1.31(TC-2value)
building as per 1S 875:1964 and IS 875 (Part 3): 1987.
3.6 Topography (kJ [5.3.3] Given:
The coefficient k~ allows for undulations in the local A buildingof length35.0q width 15.0m, height15.0m
terrain in the form of hills, valleys, cliffs, escarpments Life of structure 25 years
and caters to both upwind and downwind Termin category 3
slopes. Methods for evaluation of k3 are given in Location: Delhi
[Appendix C] of the Code.
17](https://image.slidesharecdn.com/is875-windload-111116012529-phpapp02/85/Is-875-wind-load-25-320.jpg)
![SP 64 (S & T) :2001
Topography: Almost flat Table 6 Design Wind Pressure
(Example )
Solution:
Location
Previous code [1S875: 1964], [Fig. 1A] gives pz=150 (Yeara)
kgf/m2. “e “’rain m
1987 1964
Present code [1S 875 (Part 3) : 1987] :
25 I
3 I 831.37I
Design wind speed VZ = Vb.kl.kz.ks Delhi 1470.00
50 3 1026.39
Vb = 47.0 m/s [Fig. 1] 50 2 1271.91
Calcutta 25 3 940.89 1962.00
kl = 0.90 [Table 1, N = 25 years]
Roorkee 25 2 741.84 1471.50
Since greatest horizontal dimension of 35 m is between 25 3 744.91
20 m and 50 m Bombay 981.00
50 2 1115.60
k2 = 0.88 [Table 2, Class B] at 10.0 m height Madraa 25 3 940.89 1962.00
k~ = 1.00 Bangalore 25 3 447.09 981.00
Darbhanga 25 2 1380.73 1471.50
Hence Vlo = 47.0 x 0.90x 0.88x 1.0= 37.22 nds
— The building/structure taken as a whole;
Design pressure at 10 m height = 0.6 V;
— Individual structural elements such as roofs
= 831.37 N/m2 and walls; and
= 84.83 kgf/m2
(g= 9.80 m/s2 in most parts of India) — Individual cladding units such as sheeting and
glazing including their fixtures.
Let the life of the structure be increased to 50 years
The wind loading is given in terms of pressure coeffi-
[kl=l .0, Table 1], then
cients CP and force coefficients Cf and can be deter-
plo = 0.6 [47.0x 1.0x 0.88x 1.0]2 = 1026.39 N/m2 mined as follows:
= 104.73 kgf/m2 F= CfAep~ ...(9) [6.3]
If the structure is located in a terrain category 2, F= (Cw _ Cpi) A Pd ...(10) [6.2.1]
then the value of k2 = 0.98 and where
Pll) = 0.6 [(47.0)(1.00)(0.98)(1.00)]2 F= wind load;
= 1272.91 N/m2= 129.89 kgf/m2
Cf = force coefficient;
Let us now consider a situation where the same struc- A. = effective frontal area obstructing wind,
ture is situated at Madras, Calcutta, Roorkee, Bombay, which is identified for each structure;
Bangalore and Darbhanga. The design wind pressure
pd = design wind pressure;
will be as given in Table 6, for different possible terrain
conditions. From Table 6, it is observed that the design Cpe* Cpi = external and internal pressure coeffi-
wind pressure is strongly affected by the consideration cients; and
of the expected life of the structure and terrain A= surface area of structural elements.
category. It is observed that the earlier Code generally
over estimated the wind load in city centres. One can 4.2 Pressure Coeftlcients [6.2]
also work out that the earlier Code generally underes-
, timated the design wind load, if either the expected life Pressure coefficients are applicable to structural
or ‘return period’ is large (for example, seethe case for elements like walls and roofs as well as to the design
Bombay in Table 6). This is particularly true for of cladding. The calculation process implies the
regions where the design pressures, according to the algebraic addition of Cw and C~i to obtain the final
1964 Code are low. wind loading by the use of Eqn. (10). The Code
indicates both these coefficients separately for a wide
4 WIND PRESSURE AND FORCES ON variety of situations generally encountered in practice.
BUILDINGS/STRUCTURES [6]
4.2.1 External Pressure Coefficient CF [6.2.21
4.1 General
External pressure coefficient depends on wind direc-
The Code stipulates requirements for calculation of
tion, structure configuration in plan, its height versus
wind loading from three different points of viewf
18](https://image.slidesharecdn.com/is875-windload-111116012529-phpapp02/85/Is-875-wind-load-26-320.jpg)
![sP64(s&T):2001
width ratio and, characteristics of roof and its shape. 4.2.2.1 Internal pressures [6.2.3]
[Tables 4 to 22] are devoted exclusively to the deter-
The internal pressures given in [6.2.3] have been
mination of CPVFor the specific design considerations
deliberately specified slightly higher (negatively) than
relating to cladding, local coefficients have been
the codes of temperate countries to reflect the fact that
separately shown delineating the areas at the edges of
as a tropical country, the size of windows/doors are
walls and roofs where high concentration of negative
larger in India and the normal tendency is to keep them
pressure is often found to exist.
open as much as possible.
4.2.1.1 External pressures
4.3 Force Coefficients [6.3]
It deals with a large number of cases of gross force
Force coefficients applicable to the buildinghmcture
coefficients and pressures. Should pmssums in
as a whole as well as to structural frameworks which
[Table 4] be applied at each level in the case of a tall
are temporarily or permanently unclad are also given
building, with velocity variation as in [Table 2]. The
in [6]. For evaluating force coeftlcients for the clad
answer, is that the Code implies that the calculation
buildinghtmcture as a whole, the Code gives guidance
should be carried out for each level as if the air load at
for a variety of plan shapes and height to breadth ratios
that level is independent of that at an adjacent (or lower
[Table 23]. It also indicates extra forces occurring due
or higher) level. It is puzzling to note a positive pres-
to ‘frictional drag’ on the walls and roofs of clad
sure coefficient of 1.25 in [6.2.2.T, when one knows
buildings [6.3.1]. The diameter D to be considered for
that it cannot exceed +1 .0. The reason is that since the
rough surface when applying [6S.2.2] is the value
pressure coefficients on the small overhanging posi-
excluding the height of the roughness, that is excluding
tions are not given but are known to be more strongly
the height of flutings or similar ‘regular’ roughnesses
negative on top than the negative pressures on the non-
or excluding average height of random roughness like
overhanging portions, these numbers are expected to
sand particles. This definition of D is valid only if
compensate for the projected lower pressures on the
D/E >100 (where Eis the average height of the surface
top of overhanging portion. Although not stated in the
roughness). For still larger roughnesses, specialists
Code, it is desirable to take the same values in [6.2.2.T
advice should be sought.
on the vertical walls above and below the overhanging
portion, over a height equal to half the projecting Force coefficients on unclad buildingshtructures,
length of the overhang; if no other guideline is avail- frameworks and their individual members, are com-
able. prehensively covered in [6.3.3.3 to 6.3.3.6]. The
frameworks included are those that are single (that is
4.2.2 Internal Pressure Coefficient CPi[6.2.3]
isolated), multiple or in the form of lattice towers. The
Internal pressure coefficients are largely dependent on effects of ‘shielding’ in parallel multiple frames and
the percentage of openings in the walls and their the effect of different solidity ratios have been incor-
location with reference to wind direction. The Code porated along with global force coefficients for lattice
indicates C~i for a range of values with a possible towers Uables 28 to 32]. Force coetllcients for in-
maximum (that is positive pressure) and a possible dividual members of various structural shapes and
minimum (that is negative pressure) with the provision wires/cables have been separately indicated [Tables 26
that both the extreme values would have to be and 27].
examined to evaluate critical loading on the concerned 4.3.1 Individual Members [633.2]
member. Three cases have been specifically indicated
for arriving at C~i: The force coefficient of rectangular members given in
[Fig. 4] reflect the recent discovery that the aspect ratio
— openings up to 5 percent of wall area, of the nxtangle affects the total force coefficient and
— peaks at an aspect ratio of about 2/3. Slight discrepan-
openings from 5 percent to 20 percent of wall
cies will be observed between the gross value in
area, and
[Fig. 4] and the summed up values in [Table 4], for
— openings larger than 20 percent of wall area smaller height to width ratios and the value for the
(including buildings with one side open). square in [Table 26]. Such seeming contradictions will
be observed in several international codes also and
The last case is of particular interest in determining reflect, mainly the continuation of values taken from
wind loading for structures such as aircraft hangers earlier codes. The last case in Pable 4], has reconciled
which have wide full height openable doors forming the value in [Fig. 4] and that in the last sketch of
one side of the enclosure [Fig. 3]. [Table 4], hlw26.
19](https://image.slidesharecdn.com/is875-windload-111116012529-phpapp02/85/Is-875-wind-load-27-320.jpg)
![SP64(S&T):2001
In the other cases it is recommended that the negative specialist advice when wind induced oscillations of the
pressure behind the body be further reduced to bring structure reach significant proportions. [Clause 7.1]
the total force to the value in [Fig. 4]. For example let gives guidelines for the assessment of dynamic effects
us consider the case 1/2 c hAvS 312,312< Uw c 4 and of wind. It is to be noted that the Strouhal number for
8 = 0° in [Table 4 (item 4)] with a = 2, b = 8 and h non-circular bodies [7.2] is usually slightly less than
= 3. The total force in the direction of wind with that for circular bodies.
pressure coefficient of +0.7 on faceA and -0.3 on face 6 GUST FACTOR (GF) OR GUST
B is 1.0. ‘a’ in [Fig. 4] is ‘w’ of [Table 4], ‘b’ in [Fig. EFFECTIVENESS FACTOR (GEF) METHOD [8]
4] is ’1’of [Table 4] and ‘h’ has the same meaning in
both. Hence 6.1 One doubt that may arise during a comparative
study of [Table 33] to find hourly mean wind speed,
hJw = Ida = [h/b. blaJ and peak gust multiplier from nable 2] is the absence
Therefore, of the class of structure that is its size in [Table 33].
However, further study will show that the variable $
hlb = hlw. alb
takes into account the building size [8.3 and Fig. 8].
llw = bla
The Code says that the use of random response method
For hlw = 3/2 and llw = 4 of [Table 4] we have to look for across wind response of structures of non-circular
up Wb = 3/8, db = 0.25 in [Fig. 4B] which gives Cf = cross-sections have not matured and hence are not
1.18, while adding the pressures on faces A and B in given in the Code. Some users may find small dif-
[Table 4] yields Cf = 1.0. The recommendation is not ferences in the graph for E [Fig. 11] and those in some
to change the pressure on the front face A (they are other codes. Because of the local short period intense
usually more reliable and in any case cannot exceed nature of wind in most parts of our country, the calcu-
1.0), but decrease the pressure on the back face from lated gust factors as per the Indian Code will be found
-0.3 to -0.48. The pressures on the sides as well as at to be generally slightly higher than in other codes
the corners need not be changed. which are based on the turbulence characteristics of
the ‘steady’ fully developed pressure system wind.
4.3.2 Force Coefficient for Framed Structures
[6.3.3.3 and 6.3.3.4] 6.2 A1ong-Wind Loads [8.3]
The force coefficients for framed structures given in The use of gust factor approach has been permitted by
[6.3.3.3] and [6.3.3.4] reflect the result of data which the Code for the evaluation of along-wind load.
became available around 1980. A few designers have
The calculations involved for the estimation of along-
encountered a condition (in unusual structures), where wind load have been reduced to a simple equation
they found that the sum of the total force on more than given below:
three frames was more than that on a solid body of the
same outer geometry. This is correct and has to be FZ=Cf. AepZ~ G ...(11) [8.3]
applied as such if all the frames are finally mounted on
where
a single large structure. In some cases, the designers F, = along-wind static loading at height z, applied
have found it more economical to have a fully clad
on effective frontal area Ae of strip under
structure with an internal braced framework. consideration,
5 DYNAMIC EFFECTS [7] Pz’ = design pressure at height z corresponding to
The Code incorporates a new section relating to hourly wind speed, and
dynamic effects, recognizing the advent of a large G = gust factor.
number of tall, flexible and slender structures in the One of the important departures for along-wind
country’s sky-line. Structures which require investiga- dynamic effects as compared to static effects is to
tion under this section of the Code are the following: approach the problem of design pressure evaluation
— those with height to minimum lateral dimen- from the route of hourly wind instead of short duration
sion ratio of more than 5.0. gusts as one is required to do for application up to [6].
— structures with a first mode natural frequency [Table 33] indicates the revised factors k2 which have
of less than 1.0 Hz. to be applied to the basic wind speed (short duration
gusts) of [Fig. 1] for arriving at the hourly mean wind
Guidelines are given in the Code for the approximate speed and consequently the corresponding design
determination of natural frequency of multistoreyed pressures, pz’.
buildings and the designer is cautioned regarding cer-
tain structural responses such as cross-wind motions, The gust factor G, which depends on natural frequen-
interferences of upwind obstructions, galloping, flutter cy, size and damping of the structure and on the wind
and ovalling. The Code encourages use of wind tunnel characteristics can be evaluated directly from
model testing, analytical tools and reference to parametem obtained from graphs given in [Fig. 8 to 11].
20](https://image.slidesharecdn.com/is875-windload-111116012529-phpapp02/85/Is-875-wind-load-28-320.jpg)
![SP64(S8ZT):2001
6.2.1 Computation of Wind Load by Gust Factor tion can be attempted. It recommends use of wind
Method tunnel model studies and specialist advice in cases
Step 1. Hourly Mean Wind (V;): Hourly mean wind
where significant across-wind loads are anticipated.
speed is maximum wind speeds averaged over one 7 WIND TUNNEL MODEL STUDIES [1 and 7]
hour. The Code recommends that model studies in wind tun-
VZ’= V~.kl .kz’.k~ ...(12) nels lx resorted to under several conditions. These are:
i) for structures of unconventional shapes, un-
where usual locations and abnormal environmental
v~ = Regional basic windspeed[Fig. 1], conditions, not covered in the Code [1.1.3,
k, = Probability factor [5.3.1], Note 1];
kz’ = Terrain and height factor [Table 33], and ii) certain wind induced dynamic response
or k2 problems [7.1, Notes 2 and 9]; and
k~ = Topography factor [5.3.3]. iii) buildings or shapes for which more accurate
Step 2. Design Wind Pressure (p;) [6.2.1] data or conflation of existing data is required.
p;= 0.6 (V~)2 ...(13) Unlike in some foreign codes, no guidelines have been
prescribed for properly carrying out such studies or
Step 3. Along-wind Load [8.3]
limitation of model studies including those due to
F== @ie.p:.G ...(14) Reynolds number etc. The mason appears to be that
there are very few suitable wind tunnels in our country.
where
However, since the existing ones are being improved
FZ = along-wind load on structure at any height G
and four to five new wind tunnels are likely to come
Cf = force coefficient up in the next 3 to 5 years, it is in order to discuss this.
A. = effective frontal area;
Pz’ = design wind pressure; It is now well recognized that wind load on a structure
G= the Gust Factor = (peak load/mean load); and (static or dynamic) depends on:
is given by
i) Variations of mean velocity Uo,with height;
G=l+gf. r{[B(l+@)2+ SE@] ...(15) ii) Variation of the intensity of turbulence
with hei ht, the intensity being defined as
where
~f = peak factor defined as the ratio of the ex- *
where u’, v’ and w’ are the
pected peak value to the root mean value of a
fluctuating load; departure of the velocity at any time along x,y
r = roughness factor; and z axes, respectively, from Vo, and
gf. r is given by [Fig. 8] iii) the ‘scale’ of turbulence, which is a measure of
B= background factor [Fig. 9]; the size of coherent blobs of flow, usually
SEl~ = measure of the resonant component of the swirls of various sizes, called ‘eddies’.
fluctuating wind load;
s = size reduction factor [Fig. 10]; The above is not an exhaustive list, but is generally
E= measure of available energy in the wind adequate for consideration. Creation of the mean
stream at the natural frequency of the struc- velocity distribution in a wind tunnel is a relatively
ture [Fig. 11]; simple task and about half a dozen methods are avail-
damping coefficient of the structure able for doing it. However, care has to be exercised
6=
[Table 34]; and with regard to the simulation of (ii) and (iii). Some-
g~. r.ti times, it is stated that the intensity of distribution of
(+= ~ turbulence and scale must be the same as values scaled
down from that in the atmosphere. This maybe accept-
and is to be accounted only for buildings less
able for sharp edged bodies whose properties do not
than 75 m high in terrain category 4 and for
depend on the Reynolds number. But the force coeffi-
buildings less than 25 m high in terrain
cients on rounded surface bodies depend strongly on
category 3, and is to be taken as zero in all
Reynolds number and while the spectra must be simu-
other cases.
lated, the intensities may have to be different, to ensure
6.3 Across-Wind Loads that force coefficients are not measured in the force
The Code points out that the method of evaluating bucket (see data for R, between 4 x 10⁵ and 2 x 10⁶ in
across-wind and other components of structural [Fig. 5] which shows the ‘buck~t’).
response to wind loading are fairly complex and have The above discussions lead to the following general
not as yet reached a stage where successful codifica- guidelines for wind tunnel model studies.
21](https://image.slidesharecdn.com/is875-windload-111116012529-phpapp02/85/Is-875-wind-load-29-320.jpg)

![SP 64 (S & T) :2001
&
MEAN PROBABLE LIFE
q
I FIND Vb FOR PARTICULAR ZONE
[REFER FIG.1 OR APPENDIX Al
REFER [CIAUSE 5.3.2,3] FOR EFFECTS OF
- CHANGE IN TERPINN CATEGORY DUE TO
FETCH & DEVELOPED HEIGHT
1
q
-Yesl +
No 1
Yes
I
CALCULATE K3 AS PER
[APPENDIX C]
I
I J
A
i w
No
i
I
CALCULATE
*
VZ= Vb, KI, K2, K3
CALCULATE GESIGN WIND
PRESSURE
Pd = 0.6 VZ2 AT DIFFERENT HEIGHTS
FIG. 12 FLOWDIAGRAM
o STOP
FORCALCULATING
DESIGNWINDPRESSURE
23](https://image.slidesharecdn.com/is875-windload-111116012529-phpapp02/85/Is-875-wind-load-31-320.jpg)
![SP 64 (S & T) :2001
I CALCULATE WIND PRESSURE
Pd = 0.6 VZ2 I
TO READ COEFFICIENT OF PRESSURE CP & TO CALCULATE
WIND LOAD NORMAL TO A SURFACE FOLLOW
STEPS BELWJ
(fj +.+
Yes
‘ REFER CIAUSE 16.2.33 & u
“ ITABLE 71::O~~OSLWE &FREE
. ~/Q3LE 8]: FC4?FREE STANDIW
DOUBLE SLOPED R~FS
* ~ABLE 9] ; FOR PITCHED FREE ROOF
&a=30” 1622S6TA~
* ~ABLE 101: FOR PITCHED FREE ROOF FOR Cm IF CYLINDER WITH AXIS
&a. 3& WITN EFFECT OF
a) NORMAL TO GROUND
TRAIN OR STORED MATERIAL b) PARALLELTO GROUNO
q ~ABLE 11]: FOR PITCHED FREE ROOFS U!l
c) ~ > Io,ooo fiStNEO
&a=lO”
FOR CX = 0.S IF MD ~ 0.3
“ ~ABLE21:
1 FOR PITCHED FREE ROOFS = 0.5 IF MD< 0.3
ROOFS & ROOFS WITH
A SKYLIGHT
& u = IO” WITH EFFECT OF Nets: h Is tiw heiiht 84a uerlical
TRAIN OR STORED MATERIAL cylinderor bngth of a horizontal
‘ ~ABLE 13]: FOR TROUGHED FREE ROOFS cylinder,If there is a fmeSowof REFER CIAUSF
air aroundbdh ends, h b to be 19J2.116TASLF2 11
aci= lo”
taken aa halftha lengthfor mmpu- FOR A TYPICAL GRAND
‘ ~A13LE 14]: FOR TROW3HE0 FREE ROOFS
tlngthe rallo of MD. STAND PROOF
& a = 1~ WITH EFFECT OF
TRAIN OR STOREO MATERLAL
“Km##mwu ‘~
FOR Cm C+ ROOFS & SOITOMS OF FOR UPPER SURFACE OF
CYUNORICAL ELEVATED ROUND SILOS & TANKS
STRUCTURES
FIG. 13 FLOWDIAGRAM(2)TOREADCPVALUESOFBUILDING/STRUCTURES
(Continued)
24](https://image.slidesharecdn.com/is875-windload-111116012529-phpapp02/85/Is-875-wind-load-32-320.jpg)
![SP 64 (S & T) :2001
r 6
A
!YzER
. MUSE [6.2.2.6
& TABLE 16
FOR C- F9R
IS IT No PITCHEDROOFS
SINGLE SPAN OF MULTISPAN
BUILDINGS WITH
h NOT GREATER
THAN W’
REFER
‘“s47“
Q&&E 16.2.2.6
E 171
FOR Cm FOR
SAWTOOTl+ED
ROOFS OF
MULTISPAN
I BUILDINGS WITH
,i &&yes,?
No i No
REFFR Cl A USE Is REFER CLAUSE
AREA OF OPENING
[6.2.2.1 & TABLE 4] Yes u
BETWEEN 5“h & 20% OF
FOR Cm OF WALL AREA FOR C@= A().2
RECTANGULAR CUD
BUILDING
QU
No
h
q
REFERCIAUSE f6.2.3.2]
AREA OF OPENING>20% OF
WALL AREA
C*= ko.7
q
REFER IFIG.3] FOR BUILDING
WITH ONE SIDE OPEN
DEPENDING UPON B/L RATIO
REFER CLAUSE r6,2.2.2 & TABLE Q
FOR Cp OF PITCHED ROOFS OF
RECTANGULAR CIAD BUILDINGS
REFER CLAUSE f6.2.2,~
FOR OVERHANG ROOFS
REFFR CLAUSE 16.2.2.3 & TABLE 6]
FOR MONOSLOPE ROOFS OF
RECTANGULAR CIAD BUILDINGS
REFER CLAUSE [6.2 2.5 & TABLE 15]
FOR C= OF CURVED ROOFS
FIG. 13 now DIAGRAM(2) TOREADCPVwum OFBUILDINGS/STRUCTURES
25](https://image.slidesharecdn.com/is875-windload-111116012529-phpapp02/85/Is-875-wind-load-33-320.jpg)
![SP 64 (S & T) :2001
oEslaI%&%f%suRE
W*2
P*= o
q
J
TO READF- COEFFICIENT
OF
mLowwmRucll#lE ~
TNE8E STEP6
&
tTA BUHDINQ
+ ‘=
+
FOR OTHER
BUK.OINGSw
OBTAIN ~VNUE
CLAo
UNIFORM SECTleM
FROM fTABLE23]
1
& FlG4q
FORqVALUE
cORmEsmNOINc
Toatl mM21
m F*
CORRESPONUNG
TOmbORNb *1
FIG, 14 FLOWDIAGRAM TOREADFORCECOEFFICIENT
(3) (Continued)
qvALuE
c)
B
26](https://image.slidesharecdn.com/is875-windload-111116012529-phpapp02/85/Is-875-wind-load-34-320.jpg)
![SP 64 (S & T) :2001
0 B
Yes
A
No
1= [T Yes REFtR ITABLE23] i
REFER CLAUSE
+
DEPENDlt4G ON
L
[6.3.3.4, TABLE29
& FIG. 7] FOR ~
f RLA T71CE
RFFER ITABLE ~
DIAMETER (D),
DESIGN WIND FOR SQUARE OR
SPEED (Vd) & Yss EQUIU4TEIUL
SURFACE TRIANGuLARBASE
WITH FIAT SIDEO
ROUGHNESS
MEMBERs
fZEFER
ma
FOR SQUARE SAsE
WITH ROUNDED
MEMBERs
r
k -1 I
I
TRIANGULARBASE
No WITH ROUNOED
MEMBERS
FOR COMPUTING C,
FOR FRAMES HAVINGA
COMBINATIONOF CIRCULAR
AND FLATSIDED MEMBERS
USING INTERACTION
RELATIONSHIP
FIG. 14 FLOWDIAGRAM TOREADFORCECOEFFICIENT
(3)
27](https://image.slidesharecdn.com/is875-windload-111116012529-phpapp02/85/Is-875-wind-load-35-320.jpg)
![SP 64 (S & T) :2001
( GUST FACTOR METHOD ~
I
CALCULATE HOURLYMEAN SPEED (VZ~ AT
HEIGHT z AND TERRAIN CATEGORY
VZ ‘Vb, KI,K2, K3
CALCULATE DESIGN WIND PRESSURE AT
I
I
HEIGHT Z DUE TO HOURLY MEAN WIND
SPEED
Pz = 0.6.(VZ’)2
I
I
READ m.r & L(h) FROM (FIG.8)
DEPENDINGON THE HEIGHTOF
BUILDING/STRUCTUREAND
TERRAIN CATEGORY
READ”BACKGROUND FACTOR B
lFROM FIG.9]
DEPENOINGON CZ.hlL(h) & ~
Where, A = Cy,b/Cz.h
Cy= 10, Cz= 2:
b IS BREADTH OF STRUCTURE
NORMAL TO WIND STREAM
& h IS HEIGHT OF STRUCTURE
*
I READ SIZEREDUCTION FACTORS
1
I OM IFIG. 10]
FOR THE VALUE OF REDUCED
FREQUENCY Fo = Cz . fo,h/v’h & k
I
I Where f. IS THE NATURAL
FREQUENCY OF THE STRUCTURE
!L
I ‘1
READ GUST EN R Y
FACTOR E FROM FI .11
FOR THE VALUE OF
‘:
F(I= CZ fr).~”h
I I
I
COMPUTE GUST FACTOR G ( = peak load/
Mean load) USING THE EXPRESSION
I G=l+gr. r[B(l+@)2+S.
Where ~ IS THE DAMPING COEFFICIENT
E/p]%
=0.010 FOR WELOED STEEL STRUCTURE
=0.020 FOR BOLTED TEEL STRUCTURE
=0.016 FOR REINFORCEDSTRUCTURE
o STOP
FIG. 15 FLOW DIAGRAM
FORGUSTFACTOR
28](https://image.slidesharecdn.com/is875-windload-111116012529-phpapp02/85/Is-875-wind-load-36-320.jpg)
![SP64(S&T) :2001
9 ASSESSMENT OF WIND LOADS ON BUILDINGS AND STRUCTURES
9.1 Pressure Coefficient Method
9.1.1 Stepwise computation of wind load using Peak Gust Method is as under
Step 1. Design Wind Speed (VZ) [5.3]
Vz = V~.kl.k2.k~
where
Vb = basic wind speed,
Vz = design wind speed,
k, = probability factor or risk coefficient [Table 1],
kz = terrain, height and structure size factor [Table 2], and
k~ = topography factor [5.3.3].
Step 2. Design Wind Pressure (pZ) [5.4]
P. = 1/2p VZ2
where
P = the density of air and its value is 1.2 kg/m3.
Step 3. Wind Load Calculation [6.2.1]
The wind load on individual structural elements such as roofs, walls, individual cladding units and their fittings
is calculated by accounting the pressure difference between opposite faces of these elements or units and is
given by:
F= (CP - cPi) A.pd
where
F= wind load,
Cpe = external pressure coefficient,
Cpi = internal pressure coefficient [6.2S.1],
A= surface area of structural element or cladding, and
P(j = design wind pressure.
Values of CPeand C~ifor different types of roofs, walls of different types of buildings are given in [Tables 4 to
22].
Step 4. Estimation of Frictional Drag (F’) [63.1]
Depending upon the d/h or d/b ratio of rectangular clad buildings additional drag force given by Eqn. 16 or 17
is added to the force given by [6.2].
if hSb F= C~(d–4h) b.pd+C~(d–4h) 2h.pd ...(16)
h > b F = C; (d – 4b) b.p~ + C; (d – 4b) 2h.p~ ...(17)
Values of C~ are given in [6.3.1] for different surfaces.
9.1.2 Solved Examples of Rectangular Clad Buildings
Example 1. A rectangular clad building having pitched roof and located in a farm (Fig. 16) [Tables 4 and 5].
Given:
Physical Parameters:
29](https://image.slidesharecdn.com/is875-windload-111116012529-phpapp02/85/Is-875-wind-load-37-320.jpg)
![SP 64 (S & T) :2001
Height (k) 3.5 m
Width (w) 10.0 m (excluding the overhangs)
Length (1) 18.0 m
Roof angle (a) 5°
Overhang 0.5 m
Openings on sides : 10 percent of wall area
External surface of walls : Smooth
Flat ground
3k m
~ -J_
18m
FRONT ELEVATION
FIG. 16 A RKTANGULAR
CLADBUILDING
wrrH PITCHED
RGGF
Wind Data
Wind zone : 3(Basicwindspeed =47m/s)
Terrain category : 1 [5.3.2.1]
Class of structure : A [5.3.2.2]
Design Wind Speed (VIO)
VZ = V~.kl.k2.k~
V~ = 47 nds [5.2, Appendix A]
kl = 0.90 (Farm Building) [5.3.1, Table 1]
kz = 1.05 [5.3.2.2, Table 2]
k~ = 1.00 [5.3.3.1], for site upwind slope less than 3°
Hence
v 10 = 47x0.9x 1.05X 1.0= 44.42mls
Design Wind Pressure at 10 m height (plJ
P, = 0.6 VZ2 [5.4]
plo = 0.6 (44.42)2= 1183.88 N/m2
30](https://image.slidesharecdn.com/is875-windload-111116012529-phpapp02/85/Is-875-wind-load-38-320.jpg)
![SP 64 (S & T) :2001
Wind Load Calculation
F = (cPe - CPi)A.p~ [6.2.1, Tables 4 and 5]
Internal Pressure Coetllcients (CPi)
Since openings are given as 5-20 percent of the wall areas, the value of C~i = M1.5[623 and 6.2.3.2]
The sign will depend on the direction of flow of air relative to the side of openings.
External Pressure Coefficients on Roof (CJ
The CPefor various sectors of the roof excluding the overhangs, are given in Fig. 16(a) and Table 7 as per
[Table 5]. For Ww= 3.5/10 = 0.35, which is <0.5.
Table 7 Overall External Pressure Coeffkient
WindIncidencePressureChsfftdent
Portionof Roof
@ w
E -0.9 -0.8
F -0.9 -0.4
G -0.4 -0.8
H -0.4 -0.4
Pressure Coefficients for Overhang [6.2.2.71
External pressure coefficients are recommended as equivalent to nearby local pressure coefficients
1
-1.4, corner of width y = 1.5 m
Thus CPe=
[ –1 .2, other than comer
However, for wind ward side of overhang the equivalent CPi(underside of roof surface) is +1.25 while on
lee-ward side of overhang the CPiis equal to the Cw of adjoining wall.
Design Pressure Coeffkients on Roof (External)
CP(net) = CP – C@, are calculated for cladding (local pressure coeftlcients are given separately). The CP
calculations are summarized as follows:
If CPi= +0.5;
When 0 = OO;
CP(for region E and F)= -0.9- (0.5)= -1.4
CP(for region G and H)= -0.4- (0.5)= -0.9
When 9 = 90°;
CP(for E and G) = -0.8- (0.5)= -1.3
CP(for F and H) = -0.4- (0.5)= -0.9
If CPi= -0.5;
When 9 = OO;
CP(for E and F)= –0.9 – (-0.5) = -0.4
CP(for G and H)= 4,4- (-0.5)= +0.1
When f3= 90°;
CP(for E and G)= -0.8 – (-0.5) = -0.3
CP(for F and H) = -0.4- (-0.5)= +0.1
The CPvalues for various sectors of roof are given in Fig. 16(b).
31](https://image.slidesharecdn.com/is875-windload-111116012529-phpapp02/85/Is-875-wind-load-39-320.jpg)
![SP 64 (S & T) :2001
The wind may come from either direction and opening may be on any side, hence the highest CPvalue for all
zones of cladding is considered as –1.4 outward and+ 0.1 inward. Design will have to be checked for both these
pressures.
Design Pressure Coefficients on Roof (Local)
CP, local is negative everywhere. Depending on wind direction C~ican be +ve or –ve. Positive value of C~iwill
increase CP(net), which is to be considered for calculation of wind loads. The values of local CPare summarized
in Fig. 16(c).
Design Pressure Coeftlcients on Walls [6.2.2.1 and Table 4]
In this case h/w= 0.35 and VW= 1.8
— For these values of h/w and l/w [Table 4], the value of CP as per Codal provisions are given in
Fig. 16(d).
Value of CPiis the same as before = t 0.5
The CPcalculations are summarized below:
If CPi= +0.5;
When 6 = OO;
CP(for Wall A) = 0.7 – (0.5) = 0.2
CP(for Wall B) = –0.25 - (0.5) = -0.75
CP(for Wall C) = –0.6 – (0.5) = –1.1
CP(for Wall D) = -0.6- (0.5)= -1.1
When 0 = 90°;
CP(for Wall A) = -0.5- (0.5) = -1.0
CP(for Wall B) = -0.5 – (0.5) = –1.0
CP(for Wall C) = 0.7- (0.5) = +0.2
CP(for Wall D) = -0.1 – (0.5) = -0.6
If Cpi = ‘0.5;
When 8 = O“;
CP(for Wall A) = 0.7- (-0.5) = 1.2
CP(for Wall B) = –0.25 - (-0.5) = +0.25
CP(for Wall C) = –0.6 – (–0.5) = -0.1
CP(for Wall D) = –0.6 – (4.5) = -0.1
When O= 90°;
CP(for Wall A) = –0.5 – (-0.5) = 0.0
CP(for Wall B) = -0.5 – (–0.5) = 0.0
CP(for Wall C) = +0.7 – (-0.5) = +1,2
CP(for Wall D) = -0.1- (-0.5)= +0.4
The above CP values for walls are based on wind directions of (3= 0° and 0 = 90°. But with change of angle of
attack of wind, position of A–B and C–D get interchanged. Hence, maximum CPvalues for walls A or B = + 1.2
(and -1.0) and for walls C or D = +1.2 (and -1.1) are to be considered for the design of walls.
The comers of walls experience more force for which local <P is specified as under CP(Comer) = -1.0 -(+0.5)
= –1.5 or -0.5. Hence, the four comers of the building for width of 0.25w that is 2.50 m are to be designed for
CP=-1.5
32](https://image.slidesharecdn.com/is875-windload-111116012529-phpapp02/85/Is-875-wind-load-40-320.jpg)
![SP 64 (S & T) :2001
Computation of Frictional Drag [6.3 and 6.3.1]
For rectangular clad buildings when &h or &b >4 and h < b frictional drag force F’ (acting in the direction of
wind, for (3=90° and 270°) is given by
F’= c; (d - 4h) b.pd + c; (d-4h) 2 h.pd
(drag on roof) (drag on walls)
Here, d=l=18m; b=w=lOm; h=3.5 m
C;= 0.01 (since external surface of walls is smooth)
Frictional Drag on Roof
= 0.01 (18 – 4 X 3.5)10 X 1 183.88= 473.55 N
Frictional Drag on Walls
=0.01 (18–4x3.5) 2x3.5 X 1 183.88= 331.50N
Total Frictional Drag = 805.05 N
The frictional drag on various structural components is to be distributed such that the first l/3rd windward
portion (6 m) should be able to resist half of frictional drag alongwith other loads and rest 2/3rd lee-ward
portion (12 m) should be able to resist other half of frictional drag, on roof as well as on walls separately.
Final design pressure coefficient for cladding, fmtures etc, are given in Fig. 16 (e-g) and force calculations
are as follows:
Forces for regions other than local regions (for cladding and fixtures) considering higher value of CP from
Fig. 16(e). Negative values mean that the roof or wall is being pushed outwards or upwards.
Force per unit area for roof when CP= –1.4
= -1.4x 1.0x 1183.88 = –1 657.43 N/m2
Force per unit area for longitudinal walls when CP= + 1.2
= 1.2x 1.0x 1 183.88= 1420.66 N/m2
Force per unit area for cross walls when CP= + 1.2= 1420.66 N/m2
Forces for local regions (for cladding and fixtures) are given in Fig. 16(f).
Forces for design of main frames etc.
For the design of main frames various load cases are given in Fig. 16(g). The values given inside the frame are
to be used for calculating lateral force transferred from the side walls C or D. The frictional drag is to be taken
appropriately alongwith these forces.
COMMENTS
(i) Each component located in a region is to be designed for the forces acting on it.
(ii) The fasteners on cladding may be concentrated in the region of high wind pressure as shown in
Fig. 16(h).
33](https://image.slidesharecdn.com/is875-windload-111116012529-phpapp02/85/Is-875-wind-load-41-320.jpg)
![SP 64 (S & T) :2001
1.5m
I
-OVER HANG
;
WIND INCIDENCE :
ANGLE 0° I
I
;
;
l“5m
t
-1’4
PLAN
16(a) ~~ for Roof
PLAN P1.N
LocAL Cp c, ON OVERMAMG
16(c) ~ (Local) for Roof
PLAN PLAN
-1.L
-04
E,F G,H G,H E,F
A
ELEVATION ELEVATION
Max. CP(8=O”) Max Cp(e=1800)
(cP;;)+ 0.5) (Cpi. t03)
(b]
16(b) ~ for Roof
FIG. 16 A RECTANGULAR
CLADBUILDING
WITHPITCHEDROOF(Continued)
34](https://image.slidesharecdn.com/is875-windload-111116012529-phpapp02/85/Is-875-wind-load-42-320.jpg)
![SP 64 (S & T) :2001
WALL
m
LOCAL W!NO(O.9(F’)
cpe.-lo
C(-06) c +0.7) -1.0
Cp..f.o{
25 m
1 1
t r
A (+07) B(-025) I
I
1 I
I@m I
WINO 2 ~
;
(0=0’) & Uo OF
I :
z m I
1 :
I
I -1.4,40.1 -1.L,40.J :
03 1
& ;:* D(-O.l)
I I
I
PLAN SIDE
PLAN ELEVATION
: (- 165 7.43] :
I
I I
1 I
I
I
I
t I
I t
t
c
FRONT ELEvATION
WALL WALL
-f~
+1.2,-1$1
(+1420.66)
16(d) ~~ for Walls L*
WALL
I I
16 (e) ~ (Design) for Cladding
-f
1
25
1
L
~ W*
FIGURES IN BRACKET INDICATE THE DESIGN
PRESSURE IN NII112
16 (f) ~ (Design-Local) for Cladding
FIG. 16 A REmANGULAR
CLADBUILDING
WITHPITCHEDROOF(Continued)
35](https://image.slidesharecdn.com/is875-windload-111116012529-phpapp02/85/Is-875-wind-load-43-320.jpg)

![SP 64 (S & T) :2001
1
— —
+++++*+ ++ + + + +
+++++++ ++ + + + +
+++++++ ++ ++++
+++++++ ++ + +++
+++++++ + + + + ++
?
+++++-++ ++ + + + +
{
+++++++ + + + ++ +
+++++++ + + + + + +
+++++++ ++ + + + +
—
16(h) Non-Uniform Distribution of Fasteners for Local Regions
FIG. 16 A RECTANGULAR
CLADBUILDING
WITHPITCHEDROOF
Example 2. A rectangular clad building with monoslope roof with overhangs (Fig. 17), [Table 6].
-. .-
1- —-. — —.-— -z L..-_
ii
o
FIG. 17 A RECTANGULAR
CLADBUILDING
WITHMONOSLOPE OOF
R
Given:
Physical Parameters:
Height (h) : 4.0 m
Width (w) : 8.0 m
Length (1) : 16.0 m
Roof angle (~) : 20°
37](https://image.slidesharecdn.com/is875-windload-111116012529-phpapp02/85/Is-875-wind-load-45-320.jpg)
![SP 64 (S & T) :2001
Overhang : 0.5 m
Openings : Longer side of the building is open
External surface of wall : Smooth
Ground is almost flat
Life 25 years
Return period 25 years
Wind Data
Wind zone: 2 (Basic wind speed 39 m/s)
Terrain category :2 [5.3.2.1]
Class of structure: A [5.3.2.2]
Design Wind Speed (VJ
V,= VWkl.kz.kJ
V~ = 39 mh [5.2, Appendix A]
kl = 0.92 [5.3.1]
k2 = 1.00 [5.3.2.2, Table 2]
k~ = 1.00 [5.3.3.1]
Hence, VIO= 39 x 0.92 x 1.0x 1.0= 35.88 nds
Design Wind Pressure (pZ)
pZ = 0.6 VZ2
PIO=0.6x (35.88)2= 772.42 N/m2
Wind Load Calculation
F= (CP – CPi)A.p~ (6.2.1, Table 6]
Internal Pressure Coefficients (CPJ [6.2.3.2 and Fig. 3]
Since one side of the building is open, and B/L or W/L <1, C~iare as follows from [Fig. 3].
+0.8 for (3= 0°
[1
-0.175 for e =45”
C~i = +.5 for e = 90”
-0.5 for e = 135”
-0.4 for e = 180°
Values of Etfor 45° and 135° are obtained by interpolation.
External Pressure Hlcienta on Roof (Cpe)
The Cw for various sectors of the roof and different wind direction angles [6.2.2.3 and Table 6] are given in Fig.
17(a) and Table 8.
Table 8 External Pressure Coefficient on Roof (Cw)
Overall CP for a = 20°
0 H L
o“ -0.8 -0.5
45° -1.0 -0.6
90° -0.9 for4 m fromwindward -0.9 for 4 m fromwindward
-0.5 for theremainingportion -0.5 for the remainingportion
135° -0.5 -1.0
18(T -0.2 -1.0
Pressure Coefficients for Overhang [6.2.2.7]
Pressure coefilcients on top side of overhang (equivalent C~ are recommended as nearby local external
coefficients. However, for windward side of overhang the equivalent CPi(under side of roof surface) are
38](https://image.slidesharecdn.com/is875-windload-111116012529-phpapp02/85/Is-875-wind-load-46-320.jpg)
![SP 64 (S & T) :2001
recommended as 0.75 (for overhanging slope upward) and 1.25 (for overhanging slope downward) [6.2.2.7].
On lee-ward side of overhang, the CPiisequal to the Cwof adjoining wall. The net maximum pressure coefficients
are given below and shown in Fig. 17(b).
Adjacent to Regions
I HI I He I L I LI I
I -1.8-0.75=-2.55 I -2.0-1.25=-3.25 -2.0-1.25=-3.25 I -1.8- 1.25=-3.05 I
It is to be noted that these values are the maximum coeficientsfor which the roof in thatportion shall be designed,
regardless of the direction of wind. It is assumed that the under pressure on the side overhangs He and Le will
experience an upward force of 1.25, as also the overhang beyond L1 and ~, for some wind direction (for wind
from 180° in the latter case). Also that regions HzandLzare absent in the present example. Since the extent of
region (Hl + .HJ is equal to W, the width of the structure is W = lJ2.
Design Pressure Coefficients on Roof
CP(net)= Cp. – Cpi,k calculated for different direction of wind as given below :
For 0 = OO;
CP(region H) = –0.8 – (0.8) = –1.6
CP (region J!,)= -0.5- (0.8)= -1.3
For 0 = 45°;
CP(H)= -1.0- (0.8)= –1.8
CP (L)= -0.6 – (0.8) = –1.4
For Cl= 90°;
CP(windward 4 m) = -0.9- (-0.5) = –0.4
CP(rest of the portion)= -0.5 – (-0.5) = 0.0
Fore = 135°;
Cp (H)= -0.5 – (–0.4) = -0.1
Cp(L)= -1.0 – (-0.4) = -0.6
For(3 = 180°;
Cp(H)= -0.2- (–0.4) = +0.2
Cp (L)= -1.0- (-0.4)= -0.6
It is clear from the above calculations that CPfor region H is –1.8 @ = 45°) and +0.2@= 180°) and for region
L is -1.4 @ = 450).
Local Design Pressure Coefflcienta on Roof
The net pressure coefficients on the edges of the roof and overhangs are shown in Fig. 17(b),
Pressure Coeftlcients on Walls [6.2.2.1 and Table 4]
Since one of the walls is open, some care has to be exercised in assessing the internal and external pressure on
walls. The internal pressures are to be taken from [Fig. 3], for the case B/L< 1.0. The external pressures for the
solid walls as well as the pressures in the local region at the comers are to be taken from the appropriate cases
of [Table 4]. The external pressures for the case hlw = 1/2 and Uw= 2.0 are shown in Fig. 17(c). Taking the
internal pressure from [Fig. 3], the net pressure on the wall is given in Fig. 17(d). Design must be checked for
all the wind loadings conditions (positive and negative) and for each wind direction. CPfor comers of wall are
given in Fig. 17(e).
Since &h or db is not greater than 4, the building will not experience frictional drag.
39](https://image.slidesharecdn.com/is875-windload-111116012529-phpapp02/85/Is-875-wind-load-47-320.jpg)
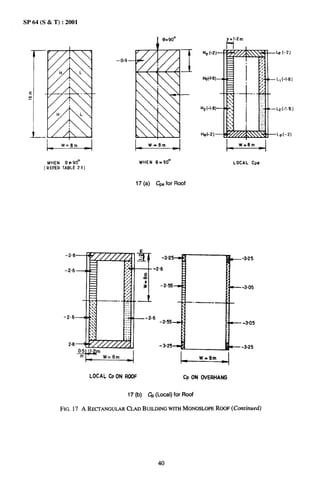


![SP64(S&T):2001
,+1.8
I
-.--—- *
I
I
i I
I I
1 I
I I
I I
+ I -0.5 I
I
1 I
i I
I 1
1
i
I ~
i I
-J -------- 4
+l.8
+1.8
* D
===6°”’
D 17 (e)
-0.6
~ on Comers of Vertical Walls
FIG. 17 A RECTANGULAR
CLADBUILDING
WITHMONOSLOPE OOF
R
Example 3. The rectangular clad building of Example 2 has been considered to be situated on a hill having a
slope of 9.5° on one side and 19.(Y on the other with walls on all sides with opening less than 5 percent [5.3.3.1
and Appendix C].
Given:
The approximate features of topography are given in Fig. 18.
The building is located at 40 m from mean ground level.
The slopes on either side of crest are greater than 3°, hence it is considered as hill.
In such cases, the total methodology of solution remains the same except that the value of ks is to be
calculated as per [Appendix C].
43](https://image.slidesharecdn.com/is875-windload-111116012529-phpapp02/85/Is-875-wind-load-51-320.jpg)
![SP 64 (S & T) :2001
WIND
~’””’”’
!
Z=loo
,
EL. 200
18(a) Wind Direction from Left to Right
2=100
.—.—.
‘7”’”’” z
EL. 200
EL. 200
w’””’”~
(b) Wind Direction from Right to Left
FIG. 18 A BUILDING
WITHMONOSLOPE OOFONA HILLSLOPE(Continued)
R
When Wind Blows Left to R@t — Fig. 18(a)
Upwind slo@. e = 9.5°
Downwind slope 0 = 19.0°
Effective horizontal length, L,= L = 600 m
Distance of building (X) from crest = – (L – Z-Z El)
cot
= - (600 -40 cot 9.5°) = -360 m
H/Le = 0.067 and X/Le = –0.60
(Since the building is situated on upwind slopti, negative sign is used)
k3=l+c,
Fore = 9.5° (3° <6< 170), C= 1.2 (100/600)= 0.2
s = 0.20 [Fig. 15]
Hence k3 = 1 + 0.2x 0.20= 1.04
When Wind Blows from Right to Left — Fig. 18(b)
Upwind slope (1= 19°
Downwind slope f3= 9.5”
Effective horizontal length L,= z/0,3 = 100/0.3= 333.33 m
Distance of building (X) from crest= +360 m
H/L, = 0.12 and X/Le = +1.08
Iq=l+c,
For 9 = 19°>17°, C = 0.36, s = 0.35 [Fig. 15]
Hence k3 = 1 + 0.36x 0.35= 1.126
NOTE—Fordesign, reater fhe two vafues of kqis considered.
g o
44](https://image.slidesharecdn.com/is875-windload-111116012529-phpapp02/85/Is-875-wind-load-52-320.jpg)
![SP64(S&T):2001
Thus,
V10=39 X0.92 X 1.OX l.126=40.401n/s
p10= 0.6 x (40.40)2= 979.34 N/m*
The rest of the procedure is similar to those used for Example 2 except that the pressure on all the walls shall
be taken from [Table 4] only (not on three walls only) and the internal pressure shall be taken as recommended
in [6.2.3], one observes that the internal pressure coefficient can be either +0.2 or -0.2 and the value which
produces greater distress must be considered for design.
External Pressure Coefficient on Roof
These values shall be taken as given in Fig. 18(c) together with the Table 9 given in it.
NOTES
1 Wall pressures indicated when wind is coming at (1= 180”,are the reverse of those given at 61 W, that is, +0.7 on B, -0.25 on A,
=
-0.6 on C and D, –1.0 on the near edge F.
2 Wall pressures indicated when wind is coming at El= 27LTare the reverse of those given at (1= 90°, that is, +0.7 on D, –O.1 on C,
-0.5 on A and B and -1.0 on edge H.
Table 9 External Pressure Coefficient on Roof (Cw)
EdgesOverhang
e H L
Ht He L L1 El Ez E3 E4 E5 E6
& -0.8 -0.5 -1.8 -2.0 -2.0 -1.8 -1.8 -2.0 -2.0 -2.0 -2.0 -1.8
45” -1.0 -0.6 -1.8 -2.0 -2.0 -1.8 -1.8 -2.0 -2.0 -2.0 -2.0 –1.8
90° -0.9 -0.9 -1.8 -2.0 -2.0 -1.8 -1.8 -2.0 -2.0 -2.0 -2.0 -1.8
(4 m Windward)
90” -0.5 -0.5 -1.8 -2.0 -2.0 -1.8 -1.8 -2.0 -2.0 -2.0 -2,0 -1.8
(4 m to 16m)
135” -0.5 -0.5 -1.8 -2.0 -2.0 -1.8 -1.8 -2.0 -2.0 -2.0 -2.0 -1.8
180° -0.2 -1.0 -1.8 -2.0 -2.0 -1.8 -1.8 -2.0 -2,0 -2.0 -2.0 –1.8
Fig. 18(d) gives the external pressures on vertical walls.
Design Pressure Coefficient
From the values of the external and internal pressures coefficients, the following design pressures coefficients
are worked out:
Walls
Face A {(+0.7 - (-0.2)} = +0.9 and {-0.2 - (0.25)}= -0.45
Face B {+0.7 – (-0.2)] = +0.9 and -0.45
Face C+ 0.9 and {-0.6 – (0.2)) = -0.8
Face D + 0.9 and -0.8
Edges E’, f? and F, F, –1.2,
Edges G, G’ and H, H’, –1.2.
Roof (excluding overhangs)
H, M, L, L’ = -1.2
HI, HI’, Ll, L1’ = –2.0
He, He’, L=, Let = –2.2
Overhang
Some care is required in assessing the under pressure on the comer pressure E2 and Es. They are taken as
equivalent to ‘sloping downwards’ [6.2.2.7] for wind coming from Et= 90°, to be conservative. Portion El,
definitely slopes upwards for wind at (3= 0° and E6 slopes downwards for wind at e = 180°. These lead to the
following design pressures forE, and Eb = (- 1.8- 0.75) = -2.55, Ez to Es = -2.0-1.25 = -3.25. The shear on
the foundation is observed to be maximum at 0 = W.
45](https://image.slidesharecdn.com/is875-windload-111116012529-phpapp02/85/Is-875-wind-load-53-320.jpg)

![SP 64 (S & T) :2001
Example 4. A multispan saw tooth shaped roof building (Fig. 19) [Table 17].
Given:
Physical parameters:
Height (h) : 6.0 m
Width (w’) : 12.0 m
Length (w) : 60.0 m
No. of Units : 4
Roof angle ((x) : As shown in Fig. 19
Openings on sides : Maximum 5-20 percent of wall area
External surface of walls : Rough (Corrugated)
6
b
(1
-1
1 w’= 12; 1
=1
W’= 12m
i
ROOF PLAN
*
a b~ dm n x
+
7s.7° ;
~
,. , 7.3° +“
6.0 m
:‘-L r
1
1 EO. 1
1
EO. 1 Ea. 1 EQ. L
‘1 1 v
ELEVATION
FIG. 19 BUILDING
WITHMULTISPAN
SAWTGGTHSPEEDRGGF(Continued)
47](https://image.slidesharecdn.com/is875-windload-111116012529-phpapp02/85/Is-875-wind-load-55-320.jpg)
![...
sP64(s&T):2001
Wind Data
Wind zone: 2 (Basic wind speed= 39 M/s)
TerrainCategory: 2 [532.1]
Class of structure: C [53.2.2]
Topography:Almost flat
Design Wind Speed (VJ
v, = v~.k~.k*.k3
v~ = 39 rn/sec
k, = 1.00
k2 = 0.93
k3 = 1.00
V, = 39x1x0.93x1 = 36.27 m/s
Design Wmd Pressure (@
pZ= 0.6 X (Vz) 2 = 06 (36.27)2= 789.31 N/m*
. ,
Wind Load Calculation
Internal Pressure Coefficient [6.23 and 6.232]
C@= M.5
External Pressure Coeflcient [6.22.6 and Table 17]
Region a b c d m n x z Local
Cw for
(3=0° +0.6 -0.7 -0.7 -0.4 4.3 -0.2 -0.1 -0.3 -2.0 and -1.5
e = 180° -0.5 -0.3 -0.3 -0.3 -0.4 4.6 -0.6 4.1 1
Cw for
o = 90° -0.8 -0.6 -0.2
0 = 270° -0.2 -0.6 -0.8
Design Pressure Coe@cients on Roof
Cp (net)= Cw – C@
h=6m, h1=h2=h=6m, h~=48m
Width on either side of ridge = 0.1 w’= 1.2 m
Cp (net) for roof
Region a b c dm n x z Local
CPfor (3= 0° and Cpi = +0.5 +0.1 -1.2 –1.2 -0.9 -0.8 -0.7 -0.6 -0.8 —
CPfor 9 = 0° and Cpi = -0,5 +1.1 -0.2 -0.2 +0. 1 +0.2 +0.3 +0.4 +0.2 —
Cp for O= 180° MCICpi=+0.5 -1.0 --0.8 -0.8 -0.8 -0.9 -1.1 -1.1 -0.6 —
CPfor (3= 180° and Cpi=-0.5 0.0 +0.2 +0.2 +0.2 +0.1 -0.1 -0.1 +0.4 —
Design CP (net) for (3= 0° and 180”
Region a b c dmn x z Local
Design +1.1 +0.2 +0.2 +0.2 +0.2 +0.3 +0.4 +0.4 - -2.5
Pressure
Coefficient I -1.0 -1.2 -1.2 -0.9 -0.9 -1.1 -1.1
and
-0.8 t -2.0
48](https://image.slidesharecdn.com/is875-windload-111116012529-phpapp02/85/Is-875-wind-load-56-320.jpg)
![SP64(S&T):2001
These coefficients have been marked in Fig. 19 (a) and (b).
CP (net) fore= 90°
Region hl hz hs
when,
C~i= +0.5 ‘1.3 -1.1 -0.7
C~i= ‘0.5 +0.3 -0.1 -0.3
These coefficients have been indicated in Fig. 19(c).
Final design CPare:
Region a b c d m n x z
Cp +1.1 –1.2 –1.2 –0.9 -0.9 –1.1 –1.1 +“.8
The design coefficients for roof cladding are given in Fig. 19(d).
Design Pressure Coefficient for Walls [6.2.2.1 and Table 4]
As per the definition given in [Table 4].
w=48m, l=60m, h=6m
h/w = 0.125 and VW= 1.25
For Wws 0.5 and 1< l/w S 1.5, values of CPare
Region A B c D Local
CP.for
9=0° +0.7 -0.2 -0.5 -0.5 -0.8
C~l=+0.5 4.5 -0.5 -0.5 -0.5 -0.5
C~i=–0.5 +0.5 +0.5 +0.5 +0.5 +0.5
+0.2 -0.7 -1.0 -1.0 -1.3
CPfor 0=0° +1 z
+0.3 +0.0 +0.0 +.3
e = 90° -0.5 -0.5 +0.7 -0.2 -0.8
C~i‘4.5 +0.5 +0.5 +0.5 +0.5 +0.5
C~i=+0.5 +.5 -0.5 -0.5 4.5 -0.5
Cp, e = 90° +0.0 +0.0 +1.2 +0.3 -0.3
–1.0 -1.0 +0.2 -0.7 -1.3
Considering the variability of the wind direction, the C (design) for all sides is +1.2 and –1.0 and CP (Local)
–1.3 for comer strips on all four corners of 0.25w = 1~ m width-wise and 0.251 = 15 m length-wise and are
indicated in Fig. 19(e). Also extreme values have to be recommended for the range of internal pressures.
Calculation of Frictional Force [6.3.1 and Table 17]
When wind blows parallel to longer wall, that is, 8 = 90° and 270°, then
h=6m, b=4, w’=48m, d=l=60m
oYh=lOandh<b
The total frictional drag force (on both the vertical walls and roofs) is given by
F = C/ (d – 4h) b.p~ + C: (d – 4h) 2h.p~
drag on roof drag on wall
Here C;= 0.02 for corrugated sheets as external surface with corrugations across the wind direction,
F'= 0.02(60-4x 6)x48 x789.3 l+ 0.02(60-4x 6)x2x 6x789.3l
= 27 278.55+6 819.64=34 098.19
49](https://image.slidesharecdn.com/is875-windload-111116012529-phpapp02/85/Is-875-wind-load-57-320.jpg)


![SP 64 (S & T) :2001
Example 5A rectangular clad building with multispan pitched roof (Fig. 20), [Table 16].
mm
ROOF PLAN
a bc d~ I!g 1
~-t If h=6.Om
s: a!
aI
“ --L
~Om 20.0 q 20.Om
L Zoom 7 7
1 1 ‘1
ELEVATION
FIG. 20 A BUILDING
wrn+ MUL’MSPAN
~CHED RGGF(Continued)
Given:
Physical Parameters:
Height (h) : 6.0 m
Width (w’) : 20.0 m
Length (w) : 100.0 m
No. of Units : 4
Roof angle (00 : 12°
Openings on sides: Less than 20 percent of wall area
External surface of walls: Rough (Corrugated)
Number of gable frames in length of 100 m = 21
All spans being equal.
55](https://image.slidesharecdn.com/is875-windload-111116012529-phpapp02/85/Is-875-wind-load-63-320.jpg)
![sP64(s&T):2001
Wind Data
Wind zone: 2 (Basic wind speed= 39 rids)
Terraincategory: 2 [5.321]
Class of structure: C [5.3.2.2]
Topography:Almost flat
Design Wind Speed (V)
Vz = vb.kl.k.#3
v~ = 39 In/s
kl = 1.00
k2 = 0.93
k~ = 1.00
V, = 39xlx0.93x l=36.27m/s
Design Wind Pressure (pZ)
Pz = 0.6X (VZ)2 = 0.6 (36.27)2 = 789.31 N/rn*
Wind Load Calculation
Internal Pressure Coefficient [6.2.3 and 6.23.2]
Since openings are less than 20 percent of wall area the vrdue of CPi= t 0.5
External Pressure Coefficient [6.2.2.6 and Table 16]
Since the values of pressure coefficients are given in [Table 16] for roof angles of 5°, 10°,20° ...... the values
of CP for ct = 12° are obtained by interpolating between the values at a = 10° and tx= 20°.
Region a b c dmn x z LQcal
Cp for
0=0° –1.02 -0.6 -0.4 -0.3 -0.3 -0.3. -0.3 -0.42
0 = 90” -0.42 -0.3 -0.3 -0.3 -0.3 -0.4 -0.6 -1.02 I–2.0 and –1.5
Region h, hz h~
CP, for
e = 90° -0.8 -0.6 -0.2
0 = 270° -0.2 -0.6 -0.8
Design Pressure Coefficients on Roof
Cp (net)= Cw - CPi
h=6m, h1=hz=h=6m, h~=88m
Width on either side of ridge, y = 0.1 w’= 2.0 m
Region a b c d m n x z Local
CPfore= 0° and Cpi = +0.5 +1.52 –1.1 -0.9 -0.8 -0.8 -0.8 4.8 -0.92
CPfore= 0° and Cpi = –0.5 -0.52 -0.1 +0.1 +0.2 +0.2 +0.2 +0.2 +0.08
CPfor t3= 180°and Cpi = +0.5 -0.92 -0.8 -0.8 -0.8 -0.8 -0.9 -1.1 –1.52
CPfor 0 = 180° and Cpi= -0.5 +0.08 +0.2 +0.2 +0.2 +0.2 +0.1 -0.1 -0.52
Design ) –1.52 –1.1 -0.9 -0.8 -0.8 -0.9 –1.1 –1.52 ] –2.5
Pressure and
‘1
Coeff. +0.08 +0.2 +0.2 +0.2 +0.2 +0.2 +0.2 +0.08 I -2.0
These coefficients have been marked in Fig. 20(a) and (b).
56](https://image.slidesharecdn.com/is875-windload-111116012529-phpapp02/85/Is-875-wind-load-64-320.jpg)
![SP 64 (S & T) :2001
Region hl h2 h~
CP for El = 90° and 270°
Cp= +0.5 –1.3 –1.1 +.7
CPfore =90° and 270°
Cp= -0.5 +0.3 –o. 1 -0.3
These coefficients have been indicated in Fig. 20(c).
The design coefficients for roof cladding are given in Fig. 20(d) and (e).
Design Pressure Coej6cientfor Walls [6.2.2.1 and Table 4]
W= gem, 1= loom,” h=(jm, h/w= ().()75and//w= 1.25
For h/ws 0.5 and 1< l/w< 1.5, values of CPare
Region A B c D Local
CP, for
0=0° +0.7 -0.2 -0.5 -0.5 -0.8
Cpi= +0.5 4.5 4.5 4.5 4,5 4.5
Cpi= ‘0.5 +0.5 +0.5 +0.5 +0.5 +0.5
Cp, 0=0” +0.2 -0.7 –1.0 –1.0 -1.3
+1.2 +0.3 +0.0 -0.0 -0.3
CP, for
e = 90° -0.5 -0.5 +0.7 -0.2 -0.8
Cpi‘4.5 +0.5 +0.5 +0.5 +0.5 +0.5 .
Cpi‘+0.5 4.5 ‘4.5 4.5 4.5 4.5
+0.0 +0.0 +1.2 +0.3 -0.3
Cp, e = 90°
–1.0 –1.0 +0.2 -0.7 –1.3
Considering the variability of the wind direction, the C (design) for all for sides is +1.2 and –1.0 and CP(Local)
–1.3 for comer strips on all four comers of 0,25w = 26 m width-wise and 0.25 x 1 = 25 IP length-wise and are
indicated in Fig. 20 (d) and (e).
Calculation of Frictional Force [6.3.1 and Table 17]
When wind blows parallel to length that is, O = 90° and 270°, then
h=6m, b=4w’=80m, d=l=lOOm, a7h=16.67>4
The frictional drag force is given by
F = C; (d - 4h) b.p~ + C: (d - 4h) 2h.p~
drag on roof drag on wall
Here C;= 0.02 for corrugated sheets as external surface with corrugations across the wind direction ,
F = 0.02 (100 - 24)X80X 789.31+ 0.02 (100-4X6)X 12X 789.31 =95 980.09 +14 397.01 = 110377.1.
The frictional drag force on various structural elements is distributed such that 50 percent of this frictional drag
is resist by windward l/3rd length (33.33 m) alongwith other loads and balance 50 percent force by rest 2/3rd
length (66.67m) in each direction (1= 90° and 270°.
For Roof
Frictional drag force =95 980.09 N
95 980.09/2=47 990.05 N is resist by Area = 33.33 x 80 m2
Force per unit area =47 990.05/(33.33 x 80)= 17.99 N/m2
47990.05 N is resist by another 2/3rd length that is, 66.67 m
Force per unit area = 13 639.28/(66.67x 80)= 8.99 N/m2
57](https://image.slidesharecdn.com/is875-windload-111116012529-phpapp02/85/Is-875-wind-load-65-320.jpg)

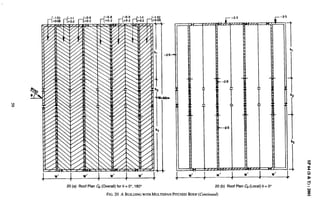

![2t5.97 Nlm
WE WALL
-1.0
L Cp +1.2 (947.17) e= 96
*
20 (e) ~ for Walls and Rmfs
FIG. 20 A 13UILDINGwrrH MULTISPANPITCHEDROOF
Example 6. A rectangular clad goabwn buiiliing with combined roof (Fig. 21) [Table 20].
Case 1 — If the Annexe is clad.
Case 2 — $the Annexe is unclad (sides open)
Given:
Physical Parameters:
Height of main building (hl) : 8.0 m
Height of annexe building (hz): 4.0 m
Width of main building (b~: 4m
Width of annexe building (bl) : 3m
Slope of roof of main building a : 20°
Slope of roof of annexe building et: 18.4°
Length of building (1): 18.0 m
Permeability: >22 percent of wall area
Wind Data
Wind zone :2 (basic wind speed= 39m/s)
Terrain category :2
Class of structure: A
Probable design life of structure: 50 years
Design Wind Speed
v~ = 39 m/see
kl = 1.00
k2 = 1.00
kj = 1.00
Vz =39xlxlxl=39rrtls
Design Wind Pressure
pZ = 0.6(39)2 = 912.6 N/m2
Internal Pressure Coeftlcients
C“i= * ().7
E;ternal Pressure Coeftlcients for Roofs [6.2.2.2 andTable 5]
Main Building
h/w=8/(4+3) =8/7=1.14, ct=20°andy =0.15 x7=l.05m
NOTE — It is not clear from the Code, as to whether the lesser horizontat dimension as seen in the plan including the annexure or of
the portion abnve the annexed should be taken for w. It is recommended that the lesser horizontrddimension at ground level be taken if
hl > (),2h2, If hl c 0.2 h2, w Shou]d k me lesser horizontal dimensiwr of the portion above the annexure.
61](https://image.slidesharecdn.com/is875-windload-111116012529-phpapp02/85/Is-875-wind-load-69-320.jpg)
![SP 64 (S & T) :2001
Region EF GH EG FH
wind angle wind angle
e=o” 9=90°
~ = 2(3” -0.7 -0,5 -0.8 -0.6
Figure 21 (a) and (b) give the Cp values for main building including local values.
CP, on roof of annexe building and vertical common wall [6.2.2.10 and Table 20]
Here ctl <30°, bl < bz and hl/h2 = 8/4 = 2.0
CPe= 0.4 hllhz – 0.6 = + 0.2
For portion a CW = +0.2 for direction 1
Cw = –0.4 for direction 2
For portion b CF = +0.7 for direction 1
Cpe= –0.4 for direction 2
For portions c and d [Table 5], as given above
Cp~ Walls [6.2.2.1 and Table 4]
for
h/w= hl/(bz+bl) =7/5 = 1.14,0.25w =0.25x7= 1,75 mat(3= O°and4.5 mate =90° andfi= 18/7=2.57
I
7
L
bt= 3.0 m bz - 6.Om
1
ELEVATION
WALL°C’
I
I
i
I
I
I
I
wALL ‘k I WALL ‘B’
r
10.Om I
I
,
I
I
I
I
[
I
I
L -
PLAN
FIG. 21 PI’ITHEDROOF WITHA VERANDAH(Continued)
62](https://image.slidesharecdn.com/is875-windload-111116012529-phpapp02/85/Is-875-wind-load-70-320.jpg)
![sP64(s&T):2001
Region A B CD Local
when
(3=0° +0.7 -0.3 -0.7 -0.7
e = 90” -0.5 -0.5 +0.7 -0.1 } –1.1
CP(net) for portions c and d [Table5]
CP(net) = CW– Cpi and Cpi = M.7
For (3= 0°, Cp (net) for region EF = -0.7-0.7 = – 1.4
CP (net) for region GH = – 0.5-0.7 = – 1.2
Cp(net) local= –2.2 and -1.7
For o = 900, Cp (net) for region EC = -0.8- 0.7= –1.5
Cp(net) for region FH = -0.6- 0.7= -1.3
Cp (net) local= –2.2 and –1.7 for width of 0.6 m
Cp(net) for portions a and b
For portion a,
when 9 = 0° Cp = +0.90 or Cp = -0.50
when (1= 180° Cp=–l.lOr CP=+0.3
For portion b,
when (3 = 0° Cp= +1.4 or Cp= 0.0
when O= 180° Cp=–l.lor Cp=+0.3
Cp(net) values for roof are shown in Fig. 21 (c) and (d)
Cp(net)for Walls
Region A B c D Local
When (3= 0°
+0.0 -1.0 -1.4 -1.4
+1.4 +0.40 +0.0 +0.0
–1 .8
) 4.4
e = 90°
–1.2 –1.2 +0.0 -0.00
+0,2 +0.2 +1.4 +0.60
These values of C~net) on walls am shown in Fig. 21 (e)
It is to be noted that the local pressure of –1.8 must be apphcu uu UIC VICIUCUI wau puIuuu u tusu, us uu UIC IIUIU
and back walls, at (3=90° and 270°. In many structures, design will have to be checked for both +ve and -ve CP
- I.S-l f- -1.0
~y<h<045w
- y80.60m
Orn
(a) Cpe VALUE FOR ROOF(c,d ) (b) Cp. VALUE FOR ROOF (c)d)
(e=o”) (e=90°)
FIG. 21 PrrcHED RGGFWITH VERANDAH
A (Continued)
63](https://image.slidesharecdn.com/is875-windload-111116012529-phpapp02/85/Is-875-wind-load-71-320.jpg)
![SP 64 (S & T) :2001
especially when there are load carrying frames, since some members may go into buckling for one of the loading
conditions.
Design pressure coefficients are shown in Fig. 21 (g).
If annexe portion is open except for the overhanging portion, it is treated as overhang [6.2.2.7] having Cpi= +1.25.
Hence CP(net) = 1.45
The portion of wall b below the overhang is to be designed for a pressure coefficient Cw of 0.9 as in [Table 21,
portion Hl for wind from left to right and CPi = f 0.7 inside pwsure and Cw = -0.4 and Cpi= + 0.7 for wind
from right to left. Although net pressures are generally given at 0 = 0° and 90°, the design shall be checked at
O= 180° and 270°, unless the structure is built symmetrically in both direction.
NOTE — Thatthe ‘Local’presswes t the comers have afsoto be assumedto be carried over to the portions B and C and D of the
a
vertical walls of the main building, in addition to the local pressures at the comers of the boundary of the entire building.
-2.27 f- -1.7
m
l--=--l 1=3.0 m 4.Om
i
(C 1 Cp DESIGN FOR Mw(c,d) (d) Cp DESIGN FOR PORTION ‘a’ OF
INCLUDING LOCAL ROOF { 8= O“)
(e-o”,90”)
21 (a – d) Main Building Including Local Values
(-1 AND+W
.0 -1.0 (+1.4 AT 9-M’)
e=leoe) +0.4
+
.0
pa
Im
1
.m
0=0” e.lelti
175 m 1.75m “ 1.75m
‘w-
~~~] AT 0-0”1 1-148 I&,~]AT e=moo
21 (e) Net Pressure Coefficients on Vertical Walls
at t3= 0° and 180°
FIG.21 PITCHED
ROOFWITHAVERANDAH
(Continued)
64](https://image.slidesharecdn.com/is875-windload-111116012529-phpapp02/85/Is-875-wind-load-72-320.jpg)

![SP 64 (S & T) :2001
3.0 m L b.o m k
5 1 1
~ -1-8
.——
T———
-t
—.— —.
-t
I
L -1,8
LJ
FOR
14 FOR 9=0”
a
0=$00
c
4.om
d
--1.8
-1.8
e=
1 3.Om .
1 4.OI!I L
~
-3
21(g) Pressure Coefficients on Vertical Walls at (3= 0° and 90°
FIG. 21 PITCHEDRDDFWITH VERANDAH
A
Example 7. A rectangular clad building with roof having sky light (Fig. 22), [Table 20].
Given:
Physical Parameters:
Height (hl): 6m
Total height of structure (hz) : 6.8 m
Width (bl): 5m
Width of sky light portion (bz): 2 m
Total width of structure: 12 m
Length of structure (1): 15 m
Maximum permeability of building: 3 percent of wall area
66](https://image.slidesharecdn.com/is875-windload-111116012529-phpapp02/85/Is-875-wind-load-74-320.jpg)
![sP64(s&T):2001
Wind Data
Wind zone : 2 (Basic wind speed= 39 m/s)
Terrain category :2
Class of structure :A
Probable design life of structure : 50 years
Topography : Almost flat
Design Wind Speed
VZ = V~.kl.kz.k~
Vb = 39 ds
kl = 1.00 .
kz = 1.00
k~ = 1.00
Vz =39xlxlxl=39m/s
Design Wind Pressure
p,= 0.6(VZ)2 = 0.6(39)2 = 912.6 N/m*
Internal Pressure Coeflcients: C~i = * 0.2
External Pressure Coeflcient on Roof [6.2.2.10 and Table 20]
bl=5m, bz=2mthatis, bl>bz
For e = 0°
CP, for portions a and b is –0.6 and +0.7 respectively,
For 6 = 180°
The values of CP, as obtained for Et= 0° get interchanged.
External Pressure Coeflcient on Walls (CPJ [6.2.2.1 and Table 4]
Mws 0.5 and l/w= 1.25
Region A B c D Local
When
I
9=0° +0.7 -0.2 -0.5 -0.5
-0,8
e =900 -0.5 -0.5 +0.7 -0.2
CP Local Values for Rooffrom [Table 5], for (3= 0°
Region a d e fgh
Cp~ when Cpi = +0.2 -0.6 -0.5 -0.8 -2.0 -2.0 –2.0
Cp(net) when Cpj = –0.2 -0.8 -0.7 -1.0 -2.2 -2.2 –2.2
CD(net) -0.4 -0.3 -0.6 -1.8 -1.8 –1.8
CP(net) for roof are shown in Fig. 22 (a) - (d),
CP (net) for Wall
CP(net) Local= – 0.8 – 0.2= –1.0
CP(net) for main portions of the wall
Region A B CD Local
o = 0° and C’pi= + 0.2 +0.5 -0.4 -0,7 -0.7
-1.0
0 = 0° and cpj = -0.2 +().9 +-0.0 -0.3 -0.3
67](https://image.slidesharecdn.com/is875-windload-111116012529-phpapp02/85/Is-875-wind-load-75-320.jpg)
![SP 64 (S & T) :2001
Region A B CD Local
0 = 90° and Cpi = + 0.2 -0.7 -0.7 +0.5 +0.4 ]
(3= 90° and C~i= – 0.2 -0.3 -0.3 +0.9 +0.0 J -1.0
Design +0.9 -0.7 -0.7 –0.7
–1.0
Pressure -0.7 0,0 -0.9 0.0 1
Coefficient 1
Figure 22 (e-h) give the values of coefficients for the main walls.
Since ~ and Ub are less than 4, there will be no frictional drag on building.
NOTE—Thatalthough
‘Local’ alues tthecomerofroofsandwalls
v a arenotspecifically
indicatedn[Table
i 20,Tables and5]shall
4
be used in the case of all buildings for localvalueson the roofs and vertical walls.
Design pressure coefficients for the whole building are given in Fig. 22(i).
e
-J
a bCd 0$ M
7
6.Om
~, J
=5m 2 b! q 5m
ELEVAf ION
r
1
9
12.0 m 1.
1
ROOFPLAN (LOCAL)
(a)
b = 0.7 48 -0.8 ba +.0.7
a = -0.6 -0.6 ~c5 a= -tM
c1 0
0=180”
(b) (c)
Cp FOR ROOF
-1.0 +09
+0 -08
o
(d)
Cp NET FOR ROOF
FIG. 22A RECTANGULAR
CLADBUILDING
WITHSKYLIGHT
ROOF(Continued)
68](https://image.slidesharecdn.com/is875-windload-111116012529-phpapp02/85/Is-875-wind-load-76-320.jpg)

![SP 64 (S & T) :2001
-1.0 ( LOCALON WALLS)
LS)
Zzz Zzzz
+0’91 +09, -0.7 -04 -0-s +0-9 ,-07
-04 -1.0
Zz [ E%%
i
VERTICAL WALL ROOF WALL
WALL ‘b’
A
22(i) ~(net) for the Building
FIG.22 A RECTANGULARCLAD BUILDINGWITHSKYLIGHTRGGF
Example 8. Consider the rectangular clad building of Example 7 with the same parameters except that
bl = b~ (Fig. 23) [Table 20].
In this case bl S b2, therefore, values of CP for portion a and b are to be determined from [Table 20].
Here bl = bz and hl/h2 = 6.8/6 = 1.13
CP~ (for portion a) = 2 x 1.13-2.9 = 4.64
and Cpe (for portion b) = -0.5 (for direction 1)
Cpe(for portion b) = -0.4 (for direction 2)
CP Local values for roof from [Table 5], fore= 0°
Region a b e c d
Cpe when Cpi= +0.2 -0.64 -0.5 -0.8 -0.6 -0.5
Cp(net) when Cpi = –0.2 -0.84 -0.7 –1.0 -0.8 -0.7
Cp(net) -0.44 -0.3 -0.6 -0.4 -0.3
70](https://image.slidesharecdn.com/is875-windload-111116012529-phpapp02/85/Is-875-wind-load-78-320.jpg)
![SP64(S&T):2001
CP Local values for roof from [Table 5], for9=180°
Region a b e c d
Cpewhen Cpi = +0.2 -0.5 -0.6 -0.8 -0.5 -0.64
Cp(net) when Cpi = –0.2 -0.7 -0.8 -1.0 -0.7 -0.84
Cp(net) -0.3 -0.4 -0.6 -0.3 -0.44
Cp design values -0.84 -0.8 –1.0 -0.8 -0.84
However, on leeward side as per [Table 20, Item ( b)], the Cw for pitched portion ‘a’ and vertical portion ‘b’
are -0.5 and -0.6, respectively Fig. 23 (b) and (c).
CP(net)values considering variability of wind direction are given in Fig. 23 (d).
Other values of CP(net) as well CPlocal remain unchanged.
CP(net) for the roof and the walls are indicated in Fig. 23(e).
ELEVATION
PLAN
(a)
e.(y 0=180’
(b) (c)
Cw FOR ROOF
-* -w -0a
w
r
L
(d)
Cp NET FOR ROOF
FIG. 23 A RECTANGULAR
CLADBUILDING
WITHSKYLIGHT
RGGF
SPECIALCASE(Continued)
71](https://image.slidesharecdn.com/is875-windload-111116012529-phpapp02/85/Is-875-wind-load-79-320.jpg)
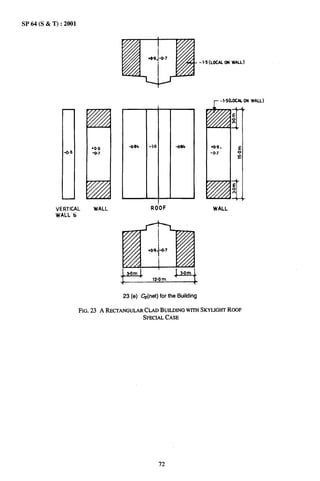
![SP 64 (S & T) :2001
Example 9. Consider the rectangular clad building of Example 9.1.2.7 with the same parameters except that
the skylight is of triangular shape (Fig. 24) [Table 20].
The Cpeon roof are given for all roof portions as for pitched roof and skylight portion as –0.6 and +0.4 for
windward side and –0.6 and –0.5 for leeward side.
Thus CP(net) considering the variability of direction of wind is -0.8 and +0.6 for all portions of ,tie roof and
CP(net) as well as CPlocal remain unchanged for other portion of building.
I-f
n.
bcd
--&
a
7
60m
J-
1- bt :5m
!
“’bf21+
1< b,. 5m
-1
ELEvATION
+ 120m —~
ROOF PLAN (LOCAL)
(a)
b =+011 c*-O.6
CZ-O.6 b.+04
a=-0.6 d:-o. ~ d=-O.5 •--o.~
m
n
0=0” e = 160”
(b) (c)
Cpe FOR ROOF
I (d)
Cp NET FOR ROOF
FIG. 24 RETANGULAR
CLADBUILDING
WITHSKYLIGHT GGF
R
Example 10. A godown with semi-circular arch springing from ground (Fig. 25) [Table 15].
Given:
Physical Parameters:
Height (H) 5.0 m
Width (1) 10.0 m
Length (L) 30.0 m
Roof Semi-circular curved roof, springing from ground level
Permeability Openings on sides not more than 5 percent of wall area
External surface Corrugated
Topography Almost flat
Wind Data
Wind zone : 4 (Basic wind speed= 47 m/s)
Terrain category : 2,
Class of structure : B
73](https://image.slidesharecdn.com/is875-windload-111116012529-phpapp02/85/Is-875-wind-load-81-320.jpg)
![SP 64 (S & T) :2001
Design Wind Speed
VZ = Vb.kl .kz.k~
v~ = 47 In/s
kl = 0.90 (for mean probable design life of structure as 25 years) [Table 1]
kz = 0.98 [Table 2]
k~ = 1.00 (for flat ground) [5.3.3.1]
VZ = 47X 1.00X 0.98X 0.90= 41.45 IU/S
Design Wind Pressure
p,= 0.6 x (VZ)2 = 0.6 (41.45)2 = 1031.0 N/m2
Internal Pressure Coetllcient [6.2.3 and 6.2.3.1]
Since openings are not more than 5 percent of wall area C~i= * 0,2
External Pressure Coeftlcient for Roof [6.2.2.5, Table 15 and Table 5]
For H/l = 5/10 = 0.5 ; C= –1.2 and Cl = + 0.7
The curved roof is converted to pitched roof at 3.5 m height upwards and coefficients for this portion are
calculated as per [Table 5] as shown in Fig. 25(a).
For 6 = 0° and a = 22.6°
EF GH Local 1 Local 2
Cpe -0.3 -0.4 –1.0 –1.2
Cp(net)
if C~i= +0.2 -0.5 -0.6 -1.2 -1.4
if Cpi= -0.2 -0.1 -0.2 -0.8 -1.0
Design Cp -0.5 -0.6 –1.2 -1.4
For Et= 90° and a= 22.6°
EG FH
Cpe -0.7 -0.6
CP(net)
if Cpj= +0.2 -0.9 -0.8
if Cpi= -0.2 -0.5 -0.4
Design Cp -0.9 -0.8
CP. (local) are indicated in Figs. 25 (b) and (c)
External Pressure Coeftlcienta for End Walls
h/w= H/1=0.5 andl.5<Uw=l/L<4.O
Wind angle c D Local
Cpe for 0 = O“ -0.6 -0.6 –1.0
CP when Cpi = +0.2 -0.8 -0.8 -1.2
Cp when Cpi = –0.2 -0.4 -0.4 ~.8
Cp. for 0 = 90° +0.7 -0.1 –1.0
Cp when Cpi = +0.2 -0.5 -0.3 -1<2
CP when Cpi = –0.2 +0.9 +0. 1 -0.8
Width of local edges= 0.25 w or 1= 2.5 m
CP(net) values for roof are shown in Fig. 25 (d).
74](https://image.slidesharecdn.com/is875-windload-111116012529-phpapp02/85/Is-875-wind-load-82-320.jpg)
![SP 64 (S & T) :2001
Frictional Drag [6.3.1]
h= H=5m, b=l=lOm, d= L=30m,
pd = 1031.0 N/m*
Since W >4 and W/I< 4, the frictional drag will be experienced by structure for (3= 90° and 270°. Also since,
the roof is curved there are no walls. The frictional drag is given by:
F’= C{ (d – 4h) b. Pd. and C; = 0.02 for corrugated surfaces.
F’=0.02(30 -4 X5) X1 OX1O31.O=2M2.ON
Half of the frictional drag is to be resisted by windward l/3rd (10 m) length and rest half by 2/3rd (20 m) length
on leeward side, in addition to other loads.
Forces
F= CP.A.p~ and pd = 1031.0 N/m*
Cp Force,N/mz
4.9 -927.9
+.8 -824.8
-0.6 -618.6
4.3 -309.3
-1.2 -1237,2
-t .
-1.4 -1443.4
--t
,(CQ a
-d 10m
35m
5.
“la’ “
--t
-1
YJm
(a)
[ ;:;’
------
. , -0.5
“______
“i -i
5m ‘ -0.7
k !
CPQ FORROW(0-Cf’l Cp, FOR RUM (tih9d’1
(b) (c)
FIG. 25 SEMI-CIRCULAR
SHELLROOF(Continued)
75](https://image.slidesharecdn.com/is875-windload-111116012529-phpapp02/85/Is-875-wind-load-83-320.jpg)
![SP 64 (S & T) :2001
-t
(Q!%
1.2
15m
LOCAL
‘
lm
l’2
15
-1
36m
+ 0.9
, 1 c
-w -1.2
-1.2
~~~1 -0.6
30m
A 4
T--i--T
L 10
m 1
Cp (NET) CP(NET ) 9=9$
WHEN 9=0”
FIG. 25 SEMI-CIRCULAR
SHELLRGGF
Example 11. Rectangular clad structure having circular arch shell roof with overhang (Fig. 26) [Table 15].
-—.
7
H.3m
o(= 55°
OVERHAIW
~1 TIE
TIE
m
J
L 2.5 m
-1 ~
1 i-11 m 1
1
2.5 m L’
1
FIG.26 BUILDING
m CIRCULAR ARCHSHELLRGGFWITH
OVERHANG(Continued)
Given:
Physical Parameters:
Height of arch roof (H) : 3m
Height of structure : 6m
Width (1) : llm
Length (L) : 30m
Roof slope : 65°
76](https://image.slidesharecdn.com/is875-windload-111116012529-phpapp02/85/Is-875-wind-load-84-320.jpg)
![SP 64 (S & T) :2001
Roof Curved circular arch
Openings on sides Openings 5-20 percent of wall area
External surface of cladding : Roof made of ferro-cement flat units overlapping each other with
dimensions
0.8 m x 2 m; masonry (unplastered) for walls.
Topography Almost flat with less obstructions in surrounding but industrial area
far away
Radius of shell 6.54 m
Wind Data
Wind zone 4 (Basic wind speed= 47 m/s)
Terrain category 2
Class of structure B
Mean probable life of structure : 25 yearn
Design Wind Speed [5.3]
VZ = V~,kl.k2.kJ
kl = 0.90
kz = 0.98
k~ 1.00
=
v= = 47 X 0.90X 0.98X 1.00= 41.45 m/S
Design Wind Pressure
pZ = 0.6 (VZ)2 = 0.6 (41.45)2= 1031.0 N/m2
Internal Pressure Coefficient [6.2.3 and 6.2.3.2]
Since openings are about 5-20 percent of wall area, the value of CPi=* 0.5. The sign will depend on the direction
of flow of air relative to the side of openings.
Pressure Coefficient (on roof) [6.2.2.5, Table 15 and Table 5]
Here HA= 3/1 1 = 0.273 and 0.7H = 2.1 m
~ ‘=-’09~~8 (by interpolation)
2’ }
For the purpose of local C and CPi,the arch roof is considered of equivalent pitched roof havinghAv=6/11 =
0,545 and roof angle= 65ge
Since the ridge is curved there will be no local coefficients. The Cm values for the roof are shown in
Fig. 26(a) to (c)
Pressure Coefficient for Overhangs [6.2.2.7]
CPeat top of overhang portion is the same as that of the nearest top portion of the roof and in this case Cw for
0 = 270° and 90° is -0.7 for 5.5 m width at edges and –0.5 for middle strip of 2.45 m.
For windward side of overhang the equivalent CPi(on under side of roof surface) is 1.25 while on leeward side
of overhang the CPiis equal to the CPeof adjoining wall.
CP(net) values forthe roof are indicated in Fig. 26(d).
External Pressure CoetTicient for End Walls [6.2.2.1 and Table 4]
It/w = 6/11 = 0.54 and VW= 30/11 = 2.73
Wall A B c D Local
for Q=0° +0.7 -0,3 -0.7 -0.7 –1,1
for 8 = 90° -0.5 -0.5 +0.7 -0.1 }
Comer width is 0.25w = 2.75 m
CP(net) values for the roof are indicated in Fig. 26(e).
77](https://image.slidesharecdn.com/is875-windload-111116012529-phpapp02/85/Is-875-wind-load-85-320.jpg)
![SP 64 (S & T) :2001
Frictional Drag [6.3.1]
h= If=3m, B=l=llm, p~=1031.0N/m2
d= L=30m
Since fi = 10>4 and Wh = 3.67<4, frictional drag will be experienced by structure for (3= 90° and 270°.
~ = C; (d - 4h)b.p~ + Cr (d – 4h)2h.p~
Ct’ = (average of smooth and corrugations surfaces)= 0.5(0.01+ 0.02)= 0.015
F’= 0.015(30–4 X3) X11 X1 031+0.015(30– 4X3) X2 X3 X1O31
= 3062.1 N+ 1 670.2N
(roof) (wall)
Half of frictional drag is to be borne by windward l/3rd length that is, 10 m length and rest half of frictional
drag by the 2/3rd length on leeward that is, 20 m, in addition to other loads.
Forces
p~ = 1031.0 N/m*
Cp Force, N/m*
–1 .75 -1804.25
-0.8 -924.8
I 0.9 I 927.9 I
I -1.2 i -1237.2 I
-1.0 -1031.0
-1.473 -1518.66
I
-9,08 -936.15
-1.6 -1649.6
c= -0..973
-Q,973
-o-b
-0.
WHEN O=0° WHEN 9=270°
(b) (c)
26 (a) to (c) ~ on Roof
FIG. 26 BUILDING
WITHCIRCULAR ARCHSHELLRGGFWITH OVERHANG(Conthwe@
78](https://image.slidesharecdn.com/is875-windload-111116012529-phpapp02/85/Is-875-wind-load-86-320.jpg)
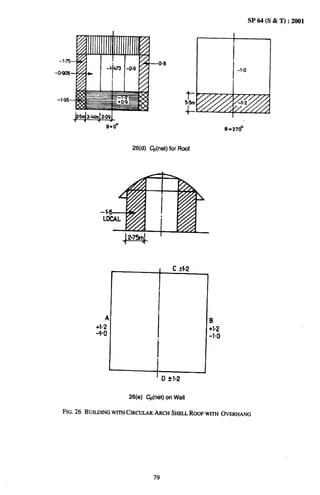
![SP 64 (S & T) :2001
Example 12. Estimation of design wind pressure on glass glazings.
The determination of equivalent static wind pressure on large glazing has been the subject of considerable study
ever since the failure of such glazing on the Kennedy Memorial Building in Boston, USA. It is recognised that
such large glazing experience three types of wind loads, all additive, namely:
(i) a static wind load due to a wind speed averaged over a specified time interval,
(ii) a random dynamic wind load due to turbulence in the wind, and
(iii) a resonant wind load due to resonant excitation of the vibration of the panel by the energy of the
turbulent fluctuations at the natural frequency of the panel.
Generally speaking, the resonant component can be neglected if the natural frequency of the panels is more than
about 250 Hz. For design purposes, the information from experimental and theoretical studies have been codified
into equivalent steady design wind pressure, in which all of the three wind load components stated above are
already added appropriately.
Although the design wind pressure can be worked out for each level of a building, it is recommended that the
pressure corresponding to the top level as well as those at the comers be adopted for all lower levels. There are
two main reasons for this recommendation:
First — The assumed need to standardize the thickness of the glass at all places.
Second—The effect of failure of a panel at any height. Such failure may increase the internal pressure coefficient
to positive like 0.8 due to free passage of air into the building as against the maximum value of 0.2 for building
with no windows. Such increase of internal pressure may bring about the failure of other panels to which the
high internal pressure may be communicated by the passages inside the building.
To illustrate, take an example of a square cross-section sealed building just outside New Delhi of height 50.0 m
and sides of 15.0 m each, in terrain category 2 and with no windowslopenings.
Design Wind Speed [5.3]
VZ = V~.kl.k2.k~
k, = 1.07, since failure of glass panel is hazardous [Note 2 of 6.2]
kz = 1.17, though the size of building is 50 m but the panel size will be less than 20 m, hence the panel is
considered as Class A and corresponding value has been picked up from [Table 2]
kx = 1.00
VZ = 47x 1.07x 1.17x 1.00 =58.84 m/s
Design Wind Pressure
pZ = 0.6 (VZ)2 = 0.6 (58,84)2=2 077.24 N/m2
Since the building is without windows, as per [6.2.3.1], the internal pressure coefficient=* 0.2.
Also, (3/2) c (h/w)< 6 and lC (Vw) c (3/2)
Considering that glazing is provided at a distance of less than 0.25 times the width of wall from the comer, as
per [Table 4] the external local pressure coefficient of –1 .20 will govern the design even with minimum internal
pressure of+ 0.2; resulting in a net pressure coefficient of –1 .4. This gives a design pressure for glazing
p~=2077.24 x 1.4=2 908.13 N/m2
9.1.3 Preliminary Explanation with Regard to Structures with Free Roofs [Covered by Tables 8 to 14]
[Tables 8 to 14] refer to roofs with open bays on all sides, [Table 8] applies to roofs with (Ww) lying between
0.25 and 1.0 and (L/W) lying between 1 and 3. Modifications to the roof pressures due to obstructions are to be
applied. When the length of the canopy is large, then [Tables 9 to 14] have to be used, if (b/d) = 5.0 or near
about. In such cases [Tables 9 and 10] imply that the average pressures will have to be worked out for portions
of the roof for wind angles of 0°,45°, 90° and 0°,45°,90°, 135° and 180° when there is obstruction on one side.
For example [Tables 9 and 10] give separate pressure on one quarter leeward area of roof, designated as J, at
6 = 45°. [Tables 11 and 12] are to be used if the canopy is inclined at 30°. In case (b/d) is substantially more
than 5.0 and roof angle is other than those given in the Code, it is better to commission wind tunnel model studies.
Frictional force shall be considered when the roof area is larger in [Tables 9 to 14], compared to the area in
[Table 8]. The friction force is to be distributed such that half of the friction force acts on the windward l/3rd
80](https://image.slidesharecdn.com/is875-windload-111116012529-phpapp02/85/Is-875-wind-load-88-320.jpg)
![SP 64 (S & T) :2001
of the surface and the other half on the leeward 2/3rd surface. The forces may be considered to act at the mid
plane of these portions.
The definition of the height ‘h’ given in [Table 8] for positive and negative roof angles must be carefully noted.
It is not the height to the lowest point of the canopy for both positive and negative roof angles.
The definition of the width is that of the main canopy only and will not include the facia if they are inclined and
extend beyond the edge of the main canopy.
Case A — No obstructionw’stored material below the canopy
[Table 8, read with 6.2.2.4], gives the overall roof pressures of the canopy. The columns, trusses and foundations
are to be checked for these loads. It is to be noted that the Code gives only the force coefficients in the direction
of wind as 1.3 for the facia implying that only a facia of angle 90° (that is, a vertical facia) is covered in the
Code. If the facia has an angle other than 90°, the loads can be significantly higher and values based on wind
tunnel model studies or conservative values based on the loads of roof overhangs of buildings [6.2.2.2 and Table
5] maybe used. If a number of such canopies are being built, it is more economical to get model studies made
in wind tunnel to know accurate loadings.
Case B — Obstructions/stored material below the canopy
Here, the solidity ratio as defined in [6.2.2.4] has to be found. This is obviously the ratio of the height of
the obstruction to the total height of the canopy. As indicated in [6.2.2.4 and Table 8], the positive
pressure is not affected by the obstruction but the negative pressure upstream of the obstruction gets
modified. The horizontal force coefficient of 1,3 on the vertical canopy is introduced only on the
windward canopy.
The pressures at the corners A, B, C, D are shown at the higher value of –3,0 in line with some of the new findings
and in the absence of a specific clarification on this point in the Code. It may be noted that as per the Code, the
design cannot be checked for opposite pressures on the two arms on the canopies also.
9.1.4 Solved Examples of Free Roofs
Example 13. A rectangular clad building with free pitched roof [6.2.2.4 and Table 9].
Given:
Physical Parameters:
Height (h) : 5m
Length (b) : 50m
Span (d) ; 10m
Roof angle (et) : 30°
Wind Data
Wind zone 4 (Basic wind speed= 47 rrds)
Terrain category 1
Class of structure B
Design life of structure 25 years.
Design Wind Speed
V,= Vb.kl.k2.k3 = 47 X 0.90 X 1.03X 1.0 = 43.57 tllk+
Design Wind Pressure
pZ = 0.6 (VZ)2 = 0.6 x (43.57)2= 1139.00 N/m2
CASE I: When there is no stored material underside [see Fig. 27(a)l
Wind Load Calculation
Pressure Coeftlcient on Roof and End Surfaces [Table 9]
81](https://image.slidesharecdn.com/is875-windload-111116012529-phpapp02/85/Is-875-wind-load-89-320.jpg)
![SP 64 (S & T) :2001
For Roof
CP(net) = CP(top) – CP(bottom)
For (1= 0°
CP(for region D) = 0.6 – (–1.0) = 1.6
CP(for region@= -0.5 – (–0.9) = 0.4
For 0 = 45°
CP(for region D) = 0.1 – (-0.3) = 0.4
CP(for region E) = -0.6- (-0.3) = -0.3
CP(for region J) = -1.0- (-0.2)= -0.8
For Q= 90°
CP(for region D) = –0.3 – (–0.4) = 0.1
CP(for region@= -0.3 – (–0.4) = 0.1
For End Surfaces
CP(net)= CP(front) – CP(rear)
CP(windward, end surface)= 0.8 – (0.4) = 0.4
CP(leeward, end surface)= -0.3 – (0.3) = -0.6
For f3= 90°, there will be force due to frictional drag (Tangentially)
= 0.05p#d= 0.05 X 1 139.00X50X 10=28 475 N
Force on portion D = 1.6x 1 139.00x 1 = 1822.40 N/m2
Force on portion J = 0.8 x 1 139.00=91 1.20 N/m2
Force on portion E = -0.3 x 1 x 1 139.00= –341.70 N/m*
The design pressure coefficients are indicated in Fig. 27(b)
CASE II: If effects of train or stored materials are to be considered [see Fig. 27(c)]
Wind Load Calculations
Pressure coefficients on roof and end surfaces are to be taken from [Table 10]
For 0 = 0°
CP(for region D) = 0.1 – 0.8 = -0.7 for full length
CP(for region E,)= -0.7 – 0.9 = –1.6 for full length
For 0 = 45°
CP(for region D) = –0.1 – 0.5= -0.6
CP(for region q = -0,8 -0.5 = –1.3
CP(for region J) = -1.0 -0.5 = –1.5
For 0 = 90°
CP(for region D) = –0.4 + 0.5 = 0,1
CP(for region E) = -0.4 + 0.5 = 0.1
CP(windward, end surface)= 0.8+ 0.4= 1.2
CP(leeward, end surface)= -0.3- 0.3= -0,6
For e = 180°
CP(for region D) = –0.3 + 0.6 = 0.3
CP(for region E) = 0.4 + 0.6 = 1.0
Design pressure coefficients are indicated in Fig. 27 (d).
For (3= 90°, Frictional tangential force = 0.05 pdb.d
Forces on Different Portions
F1 = 1.2x 1 139.00= 1366.80 N/m2
Fz = –2.0 x 1 139.00= –2 278.00 N/m*
F~ = –1.6 x 1 139.00= –1 822.40 N/m2
FA = –0.7 x 1 139.00= – 797.30 N/m*
82](https://image.slidesharecdn.com/is875-windload-111116012529-phpapp02/85/Is-875-wind-load-90-320.jpg)

![SP 64 (S & T) :2001
+--l
ROOF LOPE
S X=‘W
EFFECTS OF TRAINS OR STORED
MATERIALS
9= W-4Y,0R135” .180”
D, D, E, E’ FULLLENGTH
0 = 90”,0, D, E, E’ PART LENGTH b’
THEREAFTER CP = O
K-=--l
27 (C)
t
r b
‘“ -f~
-..
‘!”
----
-2.0
---
+~.o.7
-----
-L
,+
d
t
W3
b/3
FI 2
F/4 FRICTIONAL
DISTRIBUTION
ORAG
$12
7 W2
d
~ J
L ‘T: ‘ -i
27 (d) Design Pressure Coefficient
FIG. 27 EXAMPLE
OFPITCHEDFREEROOFS,et = 30° wrim ORwrrHouT Emo3crs OFTRAINORSTORED
MATERIALS
Example 14. A free double sloped tempora?y roof (Fig. 28) with and without an obstruction underside, and
with and without a facia of 0.75 m [6.2.2.4 and Table 8].
Given:
Physical Parameters:
Height of roof(h) : 3.41 m
Width of roof (w) : 5.0 m
Length of structure (1) : 10.0 m
Roof angle (CL) : 20°
The structure is supported on columns at a distance of 1.0 m from the centre. There are 1.0 m high cotton bales
along its length, with width of 1.0 m.
84](https://image.slidesharecdn.com/is875-windload-111116012529-phpapp02/85/Is-875-wind-load-92-320.jpg)
![SP 64 (S & T) :2001
scorn
“
I
-L
h.sam
1
r-
2.5m
-1- mn
ELEVATION
$5m HIGH WAL
/f//l/fl//~~~~f~f
333 m L 3.33 m L 3933m
t 1 1 “F”’”; J
t—-+- --t-”- 5.0 m
1
-~lo.om~
PLAN
FIG. 28 A FREEDOUBLE-SLOPED
ROOF(Continued)
Wind Data
Wind zone 2 (Basic wind speed= 39 m/s)
Terraincategory 2
Class of structure A
Life of structure 5 years [Table 1]
Topography Flat
Design Wind Speed
Vz = V@l .k2.k3
v~ = 39 n-h
kl = 0.76
kz = 1.0
k3 = 1.0
Vz = 39x0.76 xlxl=29.64ds
85](https://image.slidesharecdn.com/is875-windload-111116012529-phpapp02/85/Is-875-wind-load-93-320.jpg)
![SP 64 (S & T) :2001
Design Wind Pressure
p== 0.6 (VZ)2 = 0.6 (29.64)2= 878.53 N/m2
Pressure Coefficients on Roof
CP for O= 0° [6.2.2.4 and Table 8]
Since the 1.0 m high cotton bales are normal to wind direction and is on upwind, the solidity ratio(+)= 1.0/2.5
= 0.4
Maximum +ve (thmst)
Cp (overall)=+ 0.7
Cp (local)= +0.8, +1.6, +0.6, +1.7 [As shown in Fig. 28 (a)]
Maximum –ve (suction)
CP(overall)= -0.78
CP(local)= –1.08, -1.54, –1.78, -0.96 [As shown in Fig. 28 (a)]
CP for 0 = 90°
Since there is no obstruction for air flow $ = O, All the thrust values of CP are same as in the case for 6 = 0°
Suction values are
CP(overall)= –0.7
CP(local)= –0.9, –1.3, -1.6, –0.6
CPfor 0 = 180°
Since the obstmction is on downwind side not on upwind side 1$ O.The CPvalues are same as in the case of
=
e = 90°.
The design pressure coefficients CPare shown in Fig. 28 (a).
Force Calculations
The force on ridgeltrough induced by individual slopes is as follows:
F = Cp(overall) x A x p~ (where A = Area of one side roof)
= –0.82 X 2.5X10X 878.53= –18 009.86 N
F= +0.7 (2.5x 10)x 878.53= 15374.28 N acting on centre of roof,
that is (2.5/2 = 1.25 m) away from the trough, acting normal to the surface
Total upward force on support structure
= 2 x (-18 009.86)=–36019.72 N = -36.02 kN (upward)
Total downward force
F= 2 X (15 374.28)=30 748.56 N = 30.75 N
Maximum moment induced on support structure is when one side roof experiences thrust and other side roof
experiences suction.
Hence the moment at top of support due to vertical component of wind
= (-18 009.86X 1.25-15 374.28X 1.25) COS20°
= -41729.1 cos 20°=39212.53N-m
Moment at the base of the support due to horizontal component of wind
(18 009.86 + 15 374.28)x 2.5 sin 20°
=28 545.12N-m
86](https://image.slidesharecdn.com/is875-windload-111116012529-phpapp02/85/Is-875-wind-load-94-320.jpg)
![SP 64 (S & T) :2001
t
$ m —0”8 , -1c08
L ~1”7, -o*%
1.6,-1054
0.7,-0.82
H %
RI 096, -1*78
v 0.8 & 1.78 ( HIGHER OF TWO
FOR OVERLAP)
Cp LOCAL
28(a) Forces on Support Structure
FIG.28 A FREEDOUBLE-SLOPEDOOF
R
Example 15. A rectangular unclad structure with V- troughed free roof (a = 10’) aria’ underside obstruction
(Fig, 29) [6.2.2.4, Tables 13 and 14].
Given:
Physical Parameters:
Height (h) : 4m
Width (d) : 8m
Length (b) : 40m
Roof angle (a) : 10°
Since the inclination of the canopy is 1(Y [Tables 13 and 14] have to be used.
Wind Data
Wind zone 2 (Basic wind speed 39 rrds)
Terrain category 2 [5.3.2.1]
Class of structure B [5.3.2.2]
Life of structure 50 years.
Topography Flat
Design Wind Speed [5.3]
VZ = Vb.kl.kz.k~
v~ = 39 mls
kl = 1.0
kz = 0.98
k~ = 1.0 (for flat ground)
v, = 39X 1 X 0.98X 1 = 38.22 m/s
Design Wind Pressure
P.= 0.6 (V,)2= 0.6 (38.22)2 = 876.46 N/m2
87](https://image.slidesharecdn.com/is875-windload-111116012529-phpapp02/85/Is-875-wind-load-95-320.jpg)
![SP64(S&T):2001
Without underside obstruction. [Fig. 29 (a)]
Pressure Coefficients [Table 13]
On roof CP(net)= CP(top)– CP(bottom)
Positive forces on a surface are always to be taken as acting towards the surface.
For (3= 0°
CP(net) (for region D)
= CP(D)- CP(D’)
= +0.3 – (-0.7) = +1.0 on full length of roof acting downwards
CP(net) (for region E)
= 0.2 – (–0.9) = +1.1 on full length of roof acting downwards
For 6 = 45° (on full length of roof)
CP(net) (for region D) = 0.0- (-0.2) = +0.2
CP(net) (for region E) = 0.1- (-0.3)= +0.4
For O= 90°
CP(net) (for region D) = -0.1- (0.1)= -0.2
CP(net) (for region E) = -0.1- (0,1)= -0.2
Acting on windward width (b’= d ) and is zero on rest of portion of roof. [6.2.2.4 and Table 13]
CP(net) (for region F ) = 0.4- (-1.5)= +1.9 [Fig. 29 (a)]
Effect of obstructions below the roof [Table 14]
Pressure Coefllcient on Roof
Cp(net) = cp(top) - CP(bottom)
For (3= 0° on full length
CP (for region D) = -0.7- (0.8)= -1.5
CP (for region ,/7)= -0.6 – (0.6)= –1.2
CP (for region F) = -1.1- (0.9) = -2.0
For 0 = 45° on full length
CP(for region D) = -0.4- (0.3)= -0.7
Cp(for region E) = -0.2 – (0.2)= -0,4
For (3= 90° for windward length of b’= 8,0 m
CP(for region D) = -0.1- (0.1)= -0.2
CP(for region E) = -0.1- (0.1)= -0.2
For 6 = 180° on full length
CP(for region D) = -0.4- (-0.2) = -0.2
CP(for region E) = -0.6- (-0.3) = -0.3
Friction force at 0 = 0° and 180°
= 0.1 p~.b.d= 0.1 X 876.46X40X8= 28.04 kN
CP(design) for cladding
Since obstruction may be on either side, hence, maximum CPis –1.5 over the roof and CPlocal on edges is -2.0.
Recent measurements suggest that the value should be enhanced to –3.0 at the corners.
88](https://image.slidesharecdn.com/is875-windload-111116012529-phpapp02/85/Is-875-wind-load-96-320.jpg)

![SP 64 (S & T) :2001
9.2 Force Coeftlcient Method [6.3]
9.2.1 In the Force Coefficient method the total wind load F on a particular building or structure as whole is
given by
F= Cp A.. p~
where
Cf = force coefficient,
A,= effective frontal area of building or structure, and
p~ = design wind pressure.
The Code specifies, different values of force coefficients for different faces of a building. Since the design
pressure varies with height, the surface area of building/structure be sub-divided into strips and appropriate
pressures are taken over the strips and calculated individually on the area Ae.
9.2.2 Force Coefficients for Clad Buildings [6.3.2]
[Figure 4] gives the values of the Force Coefficients for rectangular clad buildings of uniform section with flat
roofs depending upon the Mb and a/b values while [Table 23] gives the value for other clad buildings of uniform
section.
9.2.2.1 Force coefficients for circular sections [6.3.2.2]
Though the Code specifies that Force Coefficients for circular cross-section buildings be taken from [Table
23], yet for a precise estimate for infinite length [Fig. 5] may used which accounts for the surface roughness ‘E’
and in case the length of the structure is finite the Force Coefficient is modified by a multiplication factor of K.
9.2.2.2 Force coeficientsfor walls and hoardings
Earlier it was thought that the maximum wind pressure occurs when the wind direction is at right angles to the
surface. The wind tunnel tests abroad, however, indicated that the maximum net pressure occurs when the wind
is blowing at approximately 45° to the wall/hoarding. Further, as the width to height ratio of wall increases, the
net normal pressure across the wall, for wind direction normal to the wall, decreases due to the attenuation of
the pressure fluctuations on the leeward side. Near a free end or corner, there is a large increase in load for
oblique wind directions blowing on the free end specially at higher width/height ratios. In case, an adjacent wall
is running at right angle to the free end the net load near the corner reduces considerably.
In case of hoardings the pressure tends to be a little higher due to the wind flow under the hoarding. When the
gap underneath the hoarding. The Code, therefore, recommends in [Table 24] the value of Cffor hoardings/walls
ofs 15 m with Vwious bfi ratios, if resting on the ground or above tie groundataheight20.25 h (b and h are
the width and the height of the wall/hoarding respectively).
9.2.3 Force Coefficients for Unclad Buildings
The Code [6.3.3] specifies the values of Force Coefficients for permanently unclad buildings and for frame
works of buildings which are temporarily unclad like roof trusses and frame works of multistoreyed build-
ings/factories during erection.
9.2.4 Force Coefficients for Individual Members
For individual members of infinite length the Force Coefficients are to be taken from [Table 23] and for finite
length members depending upon the Z/d or Ubvalues to be modified by a multiplication factor K as before. These
values are further modified in case the member abuts onto a plate or wall in such a way that the free flow of air
around that end of the member is prevented. In such cases the Ub value is doubled for determining the value of
K. In case the free flow of air is prevented around both ends of the member the value of Ub is = m for calculating
the value of K.
9.2.4.1 Flat sided members
[Table 26] specifies the values of the Force Coefficients for two mutually perpendicular directions in case of
flat sided members when the wind is normal to the longitudinal axis of the member. These are designated as Cf.
and Cftrespectively, for normal and transverse directions and are given in [Table 26]. The normal and transverse
forces are thus given by the following two relations:
Normal Force, F.= C~n.P~.K. 1. b
Transverse Force, Ft = Cfr pd. lC.1. b
90](https://image.slidesharecdn.com/is875-windload-111116012529-phpapp02/85/Is-875-wind-load-98-320.jpg)
![SP 64 (S & T) :2001
9.2.4.2 Circular sections
The values of Force Coefficients for such members are to be calculated as explained in 9.2.2.1.
9.2.4.3 Wires and Cables
In the case of wires and cables the values of Force Coefficients are dependent on diameter, surface roughness
and the design wind speed. The Force Coefficients for such members are to be taken from [Table 27].
9.2.5 Open Plane Frames
Single and mutiple open frames are covered in [6.3.3.3 and 6.3.3.4]. Depending upon the solidity ratio ‘~’, Force
Coefficients data is divided into three categories as:
a) All flat sided members;
b) All circular members having either
i) DVd <6 m2/s
ii) DV~ > 6m2/s
c) Frames with both flat and circular members.
The values of the Force Coefficients are given in [Table 28]. In case of mutiple parallel frames, the windward
frames have a shielding effect on the leeward frames. The wind force on the windward frames or any unshielded
part of the leeward frames is computed using [Table 28] but the wind load on fully shielded or partly shielded
depends upon the effective solidity ratio and the frame spacing of the windward frame. [Table 29] gives the
Shielding Factor ‘q’ in terms of Effective Solidity Ratio ‘~’ and the frame spacing ratio.
9.2.6 Lattice Towers
The data in [6.3.3.5] for overall Force Coefficients for wind blowing into the face of the lattice tower vis-a-vis
Solidlty Ratio ‘$’ is divided as undec
a) Square towers with flat members,
b) Square towers with rounded members, and
c) Equilateral triangular towers with rounded members.
In case of square towers with flat members, wind is also to be considered blowing into a comer of the tower;
for which purpose the Code recommends a multiplying factor of 1.2 for the wind blowing into the face.
9.2.7 Solved Examples by Force Coejicient Method
13xample 16. A hoarding of 2,5 m x 1.5 m at height with its centre 2.5m above ground level is to be erected
on National Highway outside Delhi (Fig. 30).
Given:
Physical Parameters:
Height (h) : 1.5m
Length (1) : 2.5 m
Height of its centre above the ground: 2.5 m
Wind Data
Wind zone :4 (Basic wind speed= 47 rnh) for Delhi
Terrain category :1 [5.3.2.1]
Class of structures : A [5.3.2.2], since all dimensions are less than 20 m.
Design Wind Speed (Vz)
VZ = Vb . kl . k2 . k~ [5.3]
v~ = 47 lrds
k, = Probability factor for Vb = 47 m [5.3.1 and Table 1]
= 0.71 (considering mean probable design life of structure as 5 years )
k2 = Terrain, height and structure size factor [5.3.2 and Table 2] for heights 10 m
= 1.05
k~ = Topography factor [5.3.3 and Appendix C]
= 1.0, that is, ground is almost flat.
Hence, VIO= 47 x 0.71 x 1.05x 1.0= 35.04 m/s
91](https://image.slidesharecdn.com/is875-windload-111116012529-phpapp02/85/Is-875-wind-load-99-320.jpg)

![SP 64 (S & T) :2001
Design Wind Pressure (pZ)[5.4]
pZ = 0.6 x (VZ)2 and PIO= 0.6 x (35.04)2 = 736.68 N/m*
Cf = Force coefficient for low wall or hoarding <15 m
Wind Pressure and Forces [6]
Force Coefficients [6.3 and Table 24]
b=2.5m
h=l.5m
h’= 1.75 m.so h’ > 0.25h and b/h = 1.67
Hence, Cf = 1.2
Effective Frontal Area (Ae) = 2.5 x 1.5= 3.75 m2
Wind Force on Hoarding (F)
F = CP A.. p~
F= 1.2x 3.75x 736.68=3 315.06 Nor 884.02 N/mz
Check for Oblique Winds [6.3.2.3]
The value of Cf in the case is 1.7 on one edge and 0.44 on another edge [Fig. 30 (a)].
For overall forces, Cf is to be considered average of these two values, that is, Cf (average) = 1.284
Wind force (average wind force due to oblique wind)
= 1.284X 3.75X 736.68 N
= 3547,11 Nor 945.90 N/m*
However, the pressure distribution on the hoarding is given in [Fig. 30 (b)] alongwith the eccentricity of the force.
NOTE — The static forceof3547. 11 N due to oblique incidence of wind at an eccentricity of 0.25 m from the center of hoarding sheet
is to be considered for design of support. The pressure varies on hoarding sheet from maximumof2254.24 N/mz at edges to
1085.13 N/mz near central portion, with average pressure of 945.90 N/m*.
Though dynamic wind force may not be experienced by such low structure, the large hoarding may get twisted in strong winds and
tearing of sheets may occur near the edges if not designed propwly. Hence, the large hoarding may be braced (in its plane) suitably and
may be stiffened in normal direction (Perpendicular to the plane of hoarding).
Example 17. A masonry freestanding boundary wall (Fig. 31).
Given:
Physical Parameters:
Height of wall above ground level: 3.0 m
Height of fencing (barbed wire) : 0.6 m
Width of wall : 0.345 m uniform height
Length of wall : lkm
Ground : Almost flat
Mass density of brick masonry : 17.275 kN/m3
Wind Data
Wind zone 2 (Basic wind speed= 39 ink).
Terrain category 2
Class of structures C [5.3.2.2].
Design Wind Speed (VJ
Vb . kl . kz . k~ [5.3]
39 ds
Probability factor [5.3.1 and Table 1]
0.92 (considering mean probable design life of wall as 25 years)
1.05 for terrain category 2 and class of structure C
1.0, that is, ground is almost flat.
93](https://image.slidesharecdn.com/is875-windload-111116012529-phpapp02/85/Is-875-wind-load-101-320.jpg)
![SP 64 (S & T) :2001
J 1200mfn
i
- “N 2-’-6..
—
‘y
.
BRICK WALL
(345mm THICK)
%
FIG. 31 BOUNDARY ALL(LENGTH=Han)
W
Hence
VIO = 39X 0.92X 0.93X 1.0= 33.37 111/S
Design Wind Pressure (pZ)[5.4]
Pz = 0.6X (VZ)2
PIO = 0.6x(33.37)2= 668.13 N/m2
Wind Load Calculation
Wind force is given by
F= Cp A,. p=
Choice of Cf [6.3.2.3 and Table 24]
Here, b =1 km, h= 3 mandbfi >160
Since wall is on ground Cf = 2.0
Force on Barbed Wire
Solidity ratio = 10 percent, corresponding value of Cf for single frame having flat sided members is 1.9
[Table 28]
A.= 0.1 m2
F=l.9x0.1x 668.13 =127N
Force on Wall
F= 2 x 1 x668.13= 1 336.26 N/m2
Forces at Base
Bending moment due to barbed wire and wall
94](https://image.slidesharecdn.com/is875-windload-111116012529-phpapp02/85/Is-875-wind-load-102-320.jpg)
![SP 64 (S & T) :2001
= 127 x 3.525 + 0.5 x 1 336.26x 3.075x 3.225=7 073.44 N-m
Total shear at base
= 127+ 1 336.26x 3.075 = 4.236 kN/m length
Calculation of Stresses at Base
Total weight of masonry at base
= 17.275x (3.225x1x 0.345)= 19.22 kN/m width of wall
Bending stress caused by vertical bending produced at base on extreme edge
= 6M/bd2=6x7073.44/1 x 0.3452= 0.357 N/mm3
Compressive stresses due to weight at base
= P/A= 19.22/(1 x 0.345)= 0.055 N/mm2
Maximum tensile stress at extreme fibre for vertical bending
= (0.055 - 0.357)= 0.3 N/mm2
Check for Tensile Stress
According to 5.2.3.2 of IS 1905:1980 ‘Code of practice for structural safety of buildings: Masonry walls (second
revision)’, permissible tensile stress for freestanding vertical walls in vertical bending is 0.07 N/mm2. However,
the tensile stress at base of wall at ground level amounts to 0.3 N/mm2, therefore, exceeds the permissible value.
The base width of wall is to be increased for tensile stress design. The thickness of wall at various heights is
given by:
t== 44008.78 +(7X 10⁴+ 17275h)
h
Thus
tatheight 1 m from top= 0.214 m
tatheight 2 m from top= 0.392 m
tatheight 3 m from top= 0,544 m
NOTES
1 The tensile stress criteria may govern the design. For preliminary design the following formula maybe used to catculate the watl
thickness at a height for prismatic walls not exceeding 10 m in height.
r= h J(3 X CfWXfJd) + (7 x 10⁴+ P@)
where
t = thickness wall in m,
h = height of section from top of wall (m),
CfW= force coefficient for wall,
Pd = design wind pressure, and
Pp = mass density of masonry.
2 The permissible tensile stress in masonry is based on assumption that the mortar used is not leaner than Ml (US = 1/5).
3 Though [Table 1] considers mean probable design life of 5 years for boundary watls but the designer may decide higher k, factor as
given in [Note of Table 1]dependkrg upon the irnportartcegiven to the structure such as security wall where mean probable design life
may be taken as 25 years.
95](https://image.slidesharecdn.com/is875-windload-111116012529-phpapp02/85/Is-875-wind-load-103-320.jpg)
![SP 64 (S & T) :2001
Example 18. A closed cylindrical petrochemical tank (Fig. 32) [6.2.2.8].
ELEVATION
32(a) ~~ for Roof
=-1.2, +0.2
CP=-2.2, -0.8
cp=-1.7, -Q.3
o
~ (Design) for Roof
FIG. 32 A CLOSED CYLINDRICALPETRO-CHEMICALTANK
Given:
Physical Parameters:
Height (h) :6m
Diameter (d) : 10m
Roof angle (et) : 11.310
Topography : Flat ground
External surface : Rough
Wind Data
Wind zone 4 (Basic wind speed= 44 m/s)
Terrain category 2 [5.3.2.1]
Class of structure A [5.3.2.2]
Design Wind Speed (VZ)
Vb = 44 ds
kl = 1.07 (considering important structure having a return period of 100 years) [5.3.1]
k, = 1.0 [5.3.2.2, Table 2 ]
k; = 1.0 (site upwind slope c 3°) [5.3.3.1]
VIO = 44x 1.07x 1.OX 1.0=47 .08111Ls
Design Wind Pressure (pZ)
p10 = 0.6x (47.08)2= 1329.92 N/m2
96](https://image.slidesharecdn.com/is875-windload-111116012529-phpapp02/85/Is-875-wind-load-104-320.jpg)
![SP 64 (S & T) :2001
Wind Load Calculation
.
F = (CPe - CPi)A.pd [6.2.1]
Internal pressure Coefl’icientaon Roof (Cpi) [6.2.3.1 md 6.2.2.8]
As per [6.2.3.1] , the permeability of completed tank may be less than 5 percent and corresponding CPi = t 0.2
but during fabrication a stage may come when opening on roof etc maybe equivalent to open ended cylinder.
In such a situation for Wd = 0.6 as per [6.2.2.8] CPi=- 0.8. However, there can bean inside positive pressure of
+0.7 [6.2.3.2] during construction phase. However, if the tank is pressurized for whatever reason, the working
pressure must be taken for CPi.The design should be checked with C i = -0.8 as long as there is no roof. Once
the placing of the roof begins, the internal pressure, should be chang J“ m accordance with [6.2.3.2]. This means
positive internal pressures of 0.7 can be expected.
External Pressure Coefficients on Roof (CPe) [Fig. 2]
Here, ldd = 0.6 and tan u = 0.2, and [6.2.2.12 and Fig. 2] are applicable.
Therefore, then a = 0.15 h +0.2 D [since 0.2< Wd <2 ] = 2.9 m
Since wind may come from any direction, the CP values are given in [Fig. 32(a)]
Design Pressure Coefficients on Roof (Cp)
Cp= Cpe- Cpi,C’pi -0.8
=
The values of CP for design of roof cladding when the shell is empty are given in [Fig. 32(b)].
Forces on Shell Portion
For component design, pressure coet%cients as described in [Table 18] are to be used.
For overall forces [Table 23] is to be used.
Overall forces on shell (for completed tank)
Here, k’~.b26, hlD = 0.6 and external surface is rough
Cd = 0.7 [Table 23]
A. = 10 (6+1)=70 m2
Force F = Cr A,. p~ = 0.7 x70x 1329.92=65 166.08 N
When tank is open
When tank is open at top, the external pressure distribution around the tank maybe considered as applicable to
cylindrical structures described in [Table 18], for ?dD = 1 and different positions of periphery 0, CF value
are:
0 0° 15° 30° 45° 60° 75° 90° 105° 120° 135° 150° 165° 180°
Cpe 1.0 0.8 0.1 -0.7 -1.2 –1.6 –1.7 –1.2 -0.7 –0.5 -0.4 -0.4 -0.4
CPi= –0.8 (when the tank is without roof), and
CPi= i 0.5 (when the tank is partially open) [6.2.3.2]
The maximum net Cp and force are tabulated below
0 0° 9CF’ 180”
CF +1.0 -1.7 -0.4
Cpi -0.8 -0.8 -0.8
Cp -1.8 -0.9 +0.4
Force N/m* -2393.86 -2260.86 -1063.94
97](https://image.slidesharecdn.com/is875-windload-111116012529-phpapp02/85/Is-875-wind-load-105-320.jpg)
![SP 64 (S & T) :2001
Example 19. A circular water tank resting on shajl (Fig. 33).
1182”81 KN .65KNrn
?.
m-t -’27%”N’m
s 1158348N/n
9801.kl N/m
==! 13747. N/m
K!
12648.09 N/m
11085”01 N/m
i
I
4
1 9.Om
J
ELEVATION
EO
-
“A .~
-—.
—
D
PLAN
FIG. 33 WATER TANK RESTINGON SHAIT
Given:
Physical Parameters:
Height (h) below top cap : 25.25 m
Total height (H) : 27.00 m
Diameter of shaft (outer) : 9.0 m
Diameter of tank : 13.0 m
Surface condition : Fairly rough on tank and fluted on shaft
Since the height to minimum lateral dimension is less than 5.0, it is not necessary to check the design for dynamic
forces [7.1].
98](https://image.slidesharecdn.com/is875-windload-111116012529-phpapp02/85/Is-875-wind-load-106-320.jpg)
![SP64(S&T) :2001
Wind Data
Wind zone : 3 (Basic wind speed= 47 m/s)
Terraincategory :1
Class of structure :B
Topography : Almost flat
Probable design of structure : 50 years.
Design Wind Pressure at Various Heights (pz= Z)
For calculating design wind pressure at various elevations of the tank only ~ will change and accordingly pZ at
ith elevations have been computed below,
At 27m elevation
Vb = 47 nds
k, = 1.0
kz = 1.03 as per [Note 2 of Table 2]
k~ = 1.0
VZ = 47X 1.03 =48.41 tn/S
P, = 0.6x (48.41)2= 1406.11 N/m2 between 20 m to 27 m
For 20 m to 15 m height
k2 = 0.98
VZ = 47x0.98 x1.OX 1.0=46.06 m/s
P. = 0.6 x (46.06)2= 1272.91 N/m2
For 10 to 15 m height
kz = 0.94
VZ = 47x0.94x 1.OX 1.0= 44.18 m/s
P. = 0.6x (44.18)2= 1171.12 N/m2
For Oto 10 m height
kz = 0.88
VZ = 47x0.88x l,OX 1.0= 41:36 m/s
P. = 0.6x (41.36)2= 1026.39 N/m2
Wind Load Calculation
Uplift wind pressure on roof [Table 19] with H = Totalheightof the tank portion and D = diameter of the tank
portion,
HID= 9/13 = 0.69
CP = –0.78 (by interpolation)
and CPi = * 0.2 (for less than 5 percent openings)
Vertical load on roof [6.2.2.9]
P = 0.785 D* C i -Cd p~ with eccentricity e = O.lD
P = 0.785x 13 {6.2 - (-0.78)(1 406.1 1)}
= 182810.75 N
Eccentricity =0.lD=O.lx13=l.3m
Bending moment = 1.3x 182.81 kN-m
= 237.65 kN-m
Overall Horizontal Force on Tank and Shaft [6.3.2.1 and 6.3.2.2]
In the case of such appurtenances which ‘Stand’ on another structure, one is confronted with the problem of
finding the height to diameter ratio. There is no guideline in the Code as to how such situations are to be handled.
A reasonable approach is to take an imagintiy plane at half the height and assume that the airflows symmetrically
(or bifurcates symmetrically) about this plane so that this plane can be considered as a virtual ground. Then the
height to be considered is H/2 and diameter is D and the suitable value of height to diameter ratio is (H/2D) , In
this problem, we have to consider H/2D = 9/(2 x 13)= 0.346.
99](https://image.slidesharecdn.com/is875-windload-111116012529-phpapp02/85/Is-875-wind-load-107-320.jpg)
![SP 64 (S & T) :2001
F = CPAe.p~ [from Table 23 for circular section]
V&b 26 and rough surface
For tank, H/D = 0.346 which is less than 0.5 and hence, Cf = 0.7
For the shaft, the presence of the wide water tank at the top and the ground at the bottom, may be viewed as
making the air flow two dimensional that is H/D for the shaft+ CO. ence it is appropriate to take, Cf = 1.2 for
H
the rough shaft.
Horizontal Force on Shaft per metre Length
(0.0 to 10.0 m height) = 1.20X(1 X 9.0)X 1026.39
= 11085.01 N
(10.0 m to 15 m height) = 1.20x(1 x9.O)X 1171.12
= 12648.09 N
(15.0 m to 18 m height) = 1.20x(1x 9.0)x 1272.91
= 13747.43 N
( 8.0 m to 19.75 m height) = 0.7x(1X 11.O)X 1272,91
= 9801.41 N
( 9.75 m to 20.00 m height) = 0.70(1X 13)X 1272.91
= 11583.48 N
(20.00 m to 25.25 m height) = 0.7X 135X 1406.11
= 12795.6 N
(25.25 m to 27.00 m height) = 0,7X (13.0/2)X 1406.11
= 6397.80 N
[Appendix D] and its note also specify the value of Cf for circular sections and the procedure is as under. It is
to be noted that the pressure at the nearest nodal point of [Table 2] above the region is to be used.
The value of the force coefficient given in [Table 23] for circular cross-section may not appear to be consistent
with the values read from [Fig. 5], and corrected for height to diameter ratio as per the recommendations in
[Table 25]. It will be observed that in general the values in [Table 23] are higher even if one assumes that the
values at finite H/D are those corresponding to the use of multipliers in [Table 25] on the values at H/D + CO.
However, from the wording in [Table 23], it is clear that the roughness envisaged in [Table 23] includes
deliberately made small projections, possibly from architectural considerations. This case is not considered in
[Fig. 5] The word ‘Smooth’ in [Table 23] really means in this problem E/D= 0,05x 10⁻⁵ of [Fig. 5] (for the
force coefficient of 0.6 at H/D + 00). For a diameter of 13.0 m, this means that the combined deviations/rough-
ness of surface must be less than 0.65 mm, which is not likely to be achieved in construction.
If the surface is stipulated to be smooth with no fluting or projections, designer may take the values in [Fig. 5]
instead of values in [Table 23], taking the multiplier as 0.8 for H/D e 2.0. In the present problem the force
coefficients then will be 0.64 for tank and 0.8 for shaft.
Example 20. Consider the circular tank of Example 19 to be supported on 16 columns of 45 cm diameter @
22.5° radially with a radius of 4.5 m. Other parameters remain unchanged (Fig. 34).
As in the previous problem, the height to maximum width can be taken as 3.0 and hence no dynamic analysis
[7.1] is needed.
Force on roof of the dome [6.2.2.9 and Table 19]
Since tank rests on columns, it is covered under Case (d) of [Table 19]
H=9.0m, Z=27.0m, D=13.0mand (2YH-1)=2;
The value of CP = -0.75 (for roof) and= -0.6 (for bottom).
Since, openings are less than 5 percent, C~i = * 0.2
100](https://image.slidesharecdn.com/is875-windload-111116012529-phpapp02/85/Is-875-wind-load-108-320.jpg)
![SP 64 (S & T) :2001
!EE
G
I
J
G-1
in
It’
S.
E
I
o
Q“
L .
r
945 m 1
1
ELEVATION
WIND
-
DIRECTION
PLAN
FIG. 34 WATER TANK RESTINGON COLUMNS
Uplift Force on Roof per Square Metre
= (Cpe- Cpi)A.Pz
= (-0.75 -0.2)x1x 1406.11=+1 335.80 N/m2
Force on Bottom per Square Metre
= (-0.6 -0.2)x 1 x 1 272.91= -1018.33 N/m2
Uplift Force on Roof [Table 19]
P = 0.785 D2 (~pi – CPe.pJ
= 0.785X 13 (0.2+ 0.75X 1406.11)
— 177214.50 N with an eccentricity ‘e’ = 0.1 D = 1.3 m
Horizontal Force on Tank [6.3.2.1 and 6.3.2.2, Table 231
For HID = 0.347, rough surface, and vd b ~ @
Cf = 0.7
101](https://image.slidesharecdn.com/is875-windload-111116012529-phpapp02/85/Is-875-wind-load-109-320.jpg)
![SP 64 (s & ‘r) :2001
Force on cylinder of tank = 0.7 x(1 x 13) 1406.11 = 12795.60 N/m*
Force on taper= 0.7 (1 x 11.1) 1272.91 = 9890.51 N/m*
Force on staging [6.3, 6.3.3 and 6.3.3.3, Table 28]
Consider the columns as a frame around a periphery and using [6.3.3.3, Table 28]
No. of columns = 16 D.V~ >6 m/s2
Total gap between cylindrical columns (Fig. 34) is
s = [ro sin zz.s”–~ll+{[~.sin45° –~11–
[~.sin22.5°+ rll }+ ([r. sin67.5°– rll
-[r-() in 45° + r,] }+( [r. sin 90°-rl] - [r. sin 67.5°+ rl] }
s
There is no gap for air flow between the columns at El= 90° and El= 67.5°
Hence net gap
g = rt) sin 67.5° – 6r1 = 4.5 sin 67.5°– 6 x 0.225 = 2.807 m
Solid area = 9.45 – 2.807 = 6.643 m2
Solidity mtio ($)= 6.643/9.45= 0.70
Force coefficient (by interpolation) on wind facing columns= 1.28
Overall Forces on Staging
There is no specific guideline in the Code for finding out the force coefficient for such shielded configuration.
A conservative approach is to note that gap flow occurs only for t3 up to 67.5 and hence the ‘frame spacing’
as per [ 6.3.3.4 ] is likely to be closer to unity. The range of values for @r and ~ in [ Fig. 7 ] does not cover
the situation here. Hence, it is conservative to take ‘effective solidity’ as 0.7 and ‘frame spacing ratio’ as 1.0
in [ Table 29 ] which yields a shielding factor of 0.6. Hence total force coefficient, Cf = 1.28 + 1.28 x 0.6
— 1.28 (1 + 0.6) = 2.048 for combined effect qf windward as well as leeward colums. Here, exposed area, A, is
–
6.643 m2 per m length of staging. The wind induced force per unit length of staging FZ = Ct . A. . P~, is
calculated as follows.
FOI- FZ (0.0 m to 10 m height) = 2.048 x 6.643 x 1026.39 = 13963.9 N/m
For F, (10 m to 15 m height) = 2.048x 6.643 x 1171.12 = 15932.93 N/m
For FZ (15 m to 18 m height) = 2.048x 6.643x 1272.91 = 17317.77 N/m
NOTE— Most of the time the columns of the staging are braced with cross-beams. The design of the beam should be able to withstand
the wind loads imposed on it, Special attention is required in detailing of the junction of the beam and the column, For calculation of
forces on beams let us consider cross-beams of size 450 mm (depth) and 300 mm (width) which are placed at a vertical sp~cing 01
3 m. It is more appropriate to adopt a value of Cf from [ Fig. 4A.]. The beam can be considered having parameters as u = 300 mm,
b = 450 mm, a / b = 0.67 and n = distance between two columns = r d 8 = 4.5 x 22.5 x 11/180= 1767 mm, It may be noted that the
ends of the cross-beam are obstructed by columns, therefore, from [ 6.3.3.2 a (ii)] the value of h/b = co is to be adopted. Correspondingly
from [Fig, 4A] Cl for windward area is 2.75 and considering the effect of shielded leeward portion the total Cf= 2,75x (1 + 0,6)= 4,4
The exposed area of the beam all around the staging at an elevation = area of one beam ( that as half perimeter x width) – area covered
by columns = 0,45 x 11 x 4,5 – 0.45 x 6.643 = 3.372 m2. Therefore, the overall forces acting on a cross-beam spanning all around
~he staging at an elevation ‘z’ is given by
For Fz (0.0 m to 10 m height) = 4.4x 3.372x 1026.39= 15228.34 N
For F, (10 m to 15 m height) =4.4x 3.372x 171.12= 17375.67 N
Forces on Each Cross-beam Spanning Two Columns
For calculation of forces on a cross-beam spanning two consecutive columns, the exposed area Ae = 1.0 x 0.45
= 0.45 n12/m and Cf = 2.75. Correspondingly forces are as follows:
For FZ(0.0 m to 10 m height) = 2.75 x 0.45 x 1 026.39= 1270,16 N/m.
For Fz (10 m to 15 m height) =2.75 x 0.45 x 1 171.12= 1449.26 N/m.
Force on Each Column per Unit Length
Force on each column for calculation of design loads areas follows. Here, Cf = 1.2 [Table 23 ] for an aspect
ratio ( H/D ) of 18 / 0.45 = 40, V~ . b >6 and for roughr. c. c. column surface, Ae = 1 x 0.45 m2/m length of
column.
For Fz (0.0 m to 10 m height ) = 1.2x 0.45 x 1 026.39= 554.25 N/m
For Fz (lOm to 15 m height)= 1.2x 0.45 x 1 171.12 =632.40 N/m
For Fz (15 m to 18 m height)= 1.2x O.45 x 1272.91 =687.37 N/m
102](https://image.slidesharecdn.com/is875-windload-111116012529-phpapp02/85/Is-875-wind-load-110-320.jpg)
![SP 64 (S & T) :2001
~@ 2063462 N
~@ 1E770.26 N
~@ 10393.69 N
ELEVATION
PLAN
FIG.35 AN INVERTEDTYPE WATER TANK
Example 21. An inverted type conical water tank (Fig. 35) for a nuclear power plant.
Given:
Physical Parameters:
Height (h) :29.0 m
Top diameter :14.8 m
Bottom diameter :3.0 m
Wind Data
Wind zone :3 (Basic wind speed= 44 m/s)
Terrain category :2
Class of structure : B [5.3.2.2]
Topography : Flat
Probable life of structure :100 years.
103](https://image.slidesharecdn.com/is875-windload-111116012529-phpapp02/85/Is-875-wind-load-111-320.jpg)
![SP 64 (S & T) :2001
Design Wind Speed
Vz = VMkl.k2.kJ
V~ = 44 lllh [5.2]
kl = 1.07 [5.3.1]
kz = 1.095 [5.3.2.2 and Table 2] (by interpolation)
k~ 1.0 [5.3.3.1]
=
Vz = 44x 1.07X l.095xl.o=51.55 m/s
Design Wind Pressure
For z =29
P.= o.f5 (vz)2
Pz = 29= 0.6x (VZ)2 = 0.6 x (51.55)2 = 1594.44 N/m*
The design pressure for other elevations are given in Table 10:
Table 10 Design Pressure at Different Levels
Elevation kl k2 k3 Vz (III/s) pZ (N/m2)
29 1.07 1.095 1.0 51.55 1594.44
24 1.07 1.07 1.0 50.37 1522.28
18 1.07 1.038 1.0 48.87 1432.96
12 1.07 0.99 1.0 46.61 1303.49
6 1.07 0.98 1.0 46.14 1277.34
Force Coeftlcient
Height/Breadth ratio = 29/5 = 5.8; Considering the surface of the tank as rough, V@ 26 and for this
height/breadthratio the force coefficient Cfas per [Table 23] is 0.8
Wind Load
Wind force F2g = 0.5.Cf . pd . A
= 0.5X 0.8X 1594.44 XA
= 0.5X 0.8X 1 594.44X (14.8+3)X5X 0.5 =28 381.03 N
F2d = 0.8X 1522.28X(3X3+ 22.25)=38 057 N
F18 = 0.8X 1 432.96X(6X3)=20 634.62 N
Flz = 0.8X 1303.49 X(6X3)= 18770.26 N
Fc = 0.8X 1 277.34x(6X3)= 18393.69 N
Reaction, shear force and bending moment assuming the watertank as a cantilever beam
Reaction at base= 124236.55 N
B.M. and S.F. at an elevation of 24 m = –141 904.9 N-m and 28380.98 N respectively
B.M. and S.F. at an elevation of 18 m = –540 532.78 N-m and 66437.98 N
B.M. and S.F. at an elevation of 12m = - 1062968.3 N-m and 87072.6 N
B.M. and S.F. at an elevation of 6 m = –1 698025.5 N-m and 105842.86 N
B.M. andS.F.atbase=–2443 444.8 N-m and 124236.55 N
Example 22. A multistoreyedframed building (Fig. 36).
Given:
Physical Parameters:
Length : 50.0 m
Width : 10m
Height : 60m
Height of each storey : 4m
Spacing of frames : 5 m along the length
104](https://image.slidesharecdn.com/is875-windload-111116012529-phpapp02/85/Is-875-wind-load-112-320.jpg)

![SP 64 (S & T) :2001
Wind Load Calculations
F=Aexp~xC~
a/b = 10/50= 0.2
h/b = 60/50= 1.2
C~ for these values from [Fig. 4] = 1.2
After selecting proper values of kz from the Code, the values of the design wind pressure are computed and
given in Table 11
Table 11 Wind Load at Different Floor Levels
,
Elevation (m) k2 v, (In/s) pZ(N/m2) Lateral
Force(kN)
60 1.04 52.CKI 1622.4 19.5
56 1.03 51.5 1591.5 38.2
52 1.02 51.0 1560.6 37.4
48 1.01 I 50.5 1530.2 36.7 {
44 1,00 50.0 1500.0 36.0
40 0.99 49.5 1470.2 35.3
{ ,
36 0.975 48.75 1426.0 34.2
32 0.96 48.0 1382.4 33.1
28 0.95 47.5 1353.8 32.6
24 0.93 46.5 1292.4 31.1
I I 1
20 0.91 45.5 1242.0 29.8
16 0.87 43.5 1135.0 27.3
12 0.84 42.0 1058.6 25.4
8 0.82 41.0 1008.6 24.2
4 0.82 41.0 1008.6 24.2
0 0.00 0.0 0.0 0.0
Example 23. A 30 m high self supporting square tower (Fig. 37).
Given:
Physical Parameters:
Height of tower : 30.0 m
Base width : 5.0 m
Top width : 1.50m
Number of panels :8
Panel height : Top five 3.0 m and rest three are 5.0 m each
Type of bracings : K-type with apex upwards in 5 m panels and X-type in 3 m panel
Member properties : Table 12
Wind Data
Wind zone :4 (Basic wind speed= 47 mh)
Life of structure :100 years
Topography : Flat
Design Wind Speed
Vz = V~.kl .kz.kJ
k~ = 1.36
kz = varies with height
106](https://image.slidesharecdn.com/is875-windload-111116012529-phpapp02/85/Is-875-wind-load-114-320.jpg)

![SP 64 (S & T) :2001
Solid area (Ao)= Area of legs + Area of horizontal members +Area of braces
= 0.7029 m2
Add 10 percent for gusset platesetc=0.7029 + 0.0703 = 0.7732 m2
Solidity ratio($) = 0.773 2/2.25= 0.344
Force coefficient for square lattice tower with flat members [6.33.5 and Table 30]
Cf between elevation 30 m and 28.5 m elevations = 2,58 (by interpolation)
Wind Load Calculations
F= Aexp~x C~
Fat elevation 30 m = 0.7732 x 2 806.32x 1.13x 1.13,x 2.58=7 150.06 N
Shear Force Calculations
Shear force at elevation 30 m = 7150.06 N
Bending Moment Calculations
Bending moment at elevation 30 m = 0.00
Bending moment at elevation 27 m = 7 150.06x 3.0=21 450.18 N-m
The panel loads, shear forces and bending moments have been computed for different elevations are given in
Table 13.
Table 13 Computation of Velocity, Pressure, Drag Coefflcien$ Shear Force and Bending Moments —
Wind Normal to any Face
kl = 1.07, k~ = 136, Vb = 47m/s
No. Elevation k2 VA (m/S) PA (Nlm2) Ae (mz) 4 Cf Panel
Load(N)
SF (N) BM (N-m) 1
1. 30 1.13 77.28 3584.25 0.7732 0.344 2.392 7150.06 7150.0 0.0
2. 27 1.21 76.67 3526.97 1.4390 0.320 2.462 13703,34 20853.4 21450.18
3. 24 1.112 76.05 3470.16 1.5860 0.3285 2.437 14623.26 35476.7 84010.4
4. 21 1.103 75.44 3414.72 1.9100 0.3287 2.436 17348.83 52825.5 190440.4
5. 18 1.088 74.44 3322.11 2.1935 0.3080 2.497 20112.25 72937.8 348916.8
6. 15 1.07 73,18 3213.19 3,1476 0.2727 2.624 29694.2 102632.0 567730.1
7. 10 1.03 70.45 2977.92 3.1830 0.1797 3.ot13 32237’.13 134869.1 1080890.0
8. 5 1.03 70.45 2977.92 5.4020 0.1617 3.080 56158.75 191027.9 1755235.0
9. 0 1.03 70.45 2977.92 — — — — 191027,9 2710375.0
9.3 Gust Factor Method
9.3.1 Methodology of computation of wind load by Gust Factor Method has been explained in 6. Therefore,
solved examples of structures have been given below to demonstrate the usage of the method:
9.3.2 Solved Examples Using Gust Factor Method
Example 24. Tofind design wind pressure for a rectangular clad building.
Given:
Physical Parameters:
Building : 52 m long, 8 m wide and 40 m high
Life of structure : 50 years
Terrain category :3
Topography : Flat
Location : Calcutta
108](https://image.slidesharecdn.com/is875-windload-111116012529-phpapp02/85/Is-875-wind-load-116-320.jpg)

![SP 64 (S & T) :2001
Previous Code [1S 875:1964] [Fig 1A]
pZ=210 kgf/m2 = 1960.7 N/m2 at 30 m height,
Present Code [1S 875 (Part 3) : 1987]
As per [7.1] of this Code, since the ratio of height to least lateral dimension (40/8) is 5, dynamic analysis is
required.
v~ = 50 mls
k, = 1.0 [Table 1, N = 50]
k2’ = 0.5 [Table 33]
kx = 1.0
Design Hourly Mean Wind Speed
V,’ = 50(1.0)(0.5)(1.0)= 25.0 m/s
Design Wind Pressure
P.’ = 0.6 (25.0)2= 375.0 N/m2
Computation of Gust Factor (G) [8.3]
G = 1 +gpr~[B(l +@2+SE/’~]
For the present case, from [Fig. 8]
gf. r= 1.7, L(h)= 1 150m, CY= 10; CZ= 12
Hence, ~= CYb/CZ h = 10(8.0)/12(40.0)= 0.1667
Also
C, h /L(h) = 12(40.0)/1 150= 0.4174
Background turbulence factor B = 0.76 [Fig. 9]
Calculation of reduced frequency
To calculate this parameter, one needs to know the natural frequency (/) in the ‘first mode’. Using the expression
(b) of [Note 1 of 7.1]
T= 0.09H~= 0.09 X 40.0/~= 1.73 S
f= 0.578 Hz
F. [Fig. 10]= Cz~Oh / V(h) = 12(0.578) (40,0)/33.5= 11117
Size reduction factor (S) from [Fig. 10] is 0.15
The parameter,f~ L(h) W(h)= 0.78 x 1 150/33.5= 26.78
The gust energy factor E from [Fig. 11] is then 0.07
Since the height of the building exceeds 25 m in terrain category 3, @ = O [8.3]. With the damping coefficient
~= 0.016 [Table 34],
G = 1 + 1.7 [0.76(1 + 0)2+ 0.15(0.07)/0.016}= 1 + 2.519= 3.519
Hence the design wind pressure = 3.023 (375.0)= 1319.7 N/m2 at 40 m height.
Proceeding similarly, the design wind pressure for larger life and other terrains were considered and the results
are given below at 30 m height
Location Life Years Terrain IS 875 IS 87.5:
(Part-3) : 1964
1987
Calcutta 50 3 1689.2
100 3 1970.28 1960.00
100 2 3002.08
110](https://image.slidesharecdn.com/is875-windload-111116012529-phpapp02/85/Is-875-wind-load-118-320.jpg)
![SP 64 (S & T) :2001
The large increase in the design pressure for Terrain Category 2 which is very common for tall industrial
structures outside cities is to be noted.
Example 25. A mutistoreyedfiamed building of Exzzmple 22.
Given:
Physical Parameters:
Building : 50 m long, 10 m wide and 60 m high
Life of structure : 50 years
Terrain category :3
Topography : Flat
Location : Bhubneshwar
Design Wind Velocity
As per [7.1] of this Code, Ratio of height to least lateral dimension (60/10) is 6> 5; dynamic analysis is required.
T= 0.09Hld = 0.09 X 60/~= 1.7s
Frequency (j) = 1/1.7= 0.58 Hz < 1.0 Hz; dynamic analysis is required
v~ = 5om/s
k, = 1.0 [Table 1, N = 50]
kz’ = 0.5 [Table 33]
k~ = 1.0
Design Hourly Mean Wind Speed
V; = 50 (1.0)(0.5)(1.0)= 25.0 111/S
Design Wind Pressure
p,’ = 0.6 (25.0)2= 375.0 N/m2
Computation of Gust Factor (G) [8.31
G=l+gPr~[B(l +@)2+SE@l
For the present case, from [Fig. 8]
For 60 m height, gP r= 1.5, L(h)= 1200 m, CY= 10; C,= 12
Hence, ~ = CYb/CZ h = 10(10.0)/12(60.0) = 0.138
Also
CZh/L(h)= 12(60.0)/1 200= 0.60
Background Turbulence Factor B = 0.77 [Fig. 9]
Calculation of Reduced Frequency
FO[Fig. 10]= CZfJ / V(h) = 12(0.58) (60.0)/25= 16.7
Size reduction factor (S) from [Fig. 10] is 0.28
The parameter f$ L(h)/V(h)= 0.58 x 1200/25= 27.84
The gust energy factor E from [Fig. 11] is then 0.07
Computation of Gust Factor
$ = O [8.3]. With the damping coefficient@= 0.016 [Table 34],
G = 1 + 1.5 ~[0.77 (1 + 0)2+ 0.28 (0.07)/0.016] = 3.11
Computation of wind load at different elevations of the building are given in Table 14.
111](https://image.slidesharecdn.com/is875-windload-111116012529-phpapp02/85/Is-875-wind-load-119-320.jpg)
![SP 64 (S & T) :2001
Table 14 Wind Load at Different Elevations
Level Elevation(m) kg’ v; (In/s) PZ’ Force(kN)
1 60 0.72 36.0 777.6 28,97
2 56 0.71 35.5 756.2 56.40
3 52 0.70 35.0 735.0 54.25
4 48 0,688 34.4 710.0 52.40
5 44 0.676 33.8 685.5 50.80
6 40 0.664 33.2 661.4 48.80
7 36 0.652 32.6 637.6 47.00
8 32 ‘ 0.640 32.0 614.4 45.30
9 28 0.622 31.1 580.3 42.80
10 24 0.606 30.3 540.0 39.80
11 20 0.590 29.5 522.0 38.50
12 16 0.550 27.5 453.8 33.70
13 12 0.520 26.0 405.6 30.30
14 8 0.500 25.0 375.0 28.00
15 4 0.500 25.0 375.0 28.00
16 0 O.ooa 00.0 Ooo.o CQ.00
.
Example 26. The inverted type water tank of Example 21 using Gust Factor Method.
Given:
Fundamental frequency of the structure: 0.49 Hz
For the 29 m height
Vz’ = V~.kl .k2.k~
kl = 1.07
k~ = 1.00
kz = 0.786
VZ’ = 44X 1.07X 0.786X 1.00= 37.00 Illh
Wind Load
F= = @te.p5’.G
Pz = 0.6(37) = 821.4 N/m*
A, = 0.5(14.8+ 3)5x 0.5= 22.25 m2
Cf = 0.8
Gust factor G = I+gf. r~[ll(l + 0)2 + SE@l
g~.r= 1.29 [Fig. 8]
(3 = 0.016
c, = 10, b=6, C,=12, h=29
CY.b/CZ.h=#X$=0.1724
CZ.h/L(h) = ~ = 0.309
For these values, B = 0.8 from [Fig. 9]
Size reduction factor (FO) = CZ.fO. h I V{ = 12x 0.49x 29/37= 4.61
For these values, from [Fig. 10] S = 0.45
Calculation of E (Gust energy factor)= 0.49x 1 125/37= 14.89
112](https://image.slidesharecdn.com/is875-windload-111116012529-phpapp02/85/Is-875-wind-load-120-320.jpg)
![SP 64 (S & T) :2001
E from [Fig. 11] = 0.09
@ = O in this case
G = 1+1.29 ~[0.8 + (0.45 X0.09/0.016)] = 3.35
Force = 0.8x 22.25 x 821.4x 3.35 =48 992.00 N
For the 24 m height
Vb = 44 mls
k, = 1.07
kl = 0.766
k~ = 1.00
Vz’ = 44x 1.07 x 0.766 x 1.00= 36.06 m/s
p,’ = 0.6 (36.06)2= 780.19 N/m*
Force = 780.19x 0.8x 3.35x (22.25+ 9)=65 340.91 N
For the 18 m height
kz = 0.738
Vz’ = 44X 1.07X 0.738 X 1.00= 34.74 111/S
,
= 0.6 (34.74~ = 724,12 N/m2
F%e = 724.12 x0.8 x 3.35x(9+ 9)=34 931.55 N
For the 12 m height
kz = 0.69
1,07x 0.69x 1.00= 32.48 m/s
V,’ = 44x
f
= 0.6 (32.48)Z = 632.97 N/m*
F%e = 632.97 x 0.8x 3.32x(9+9)=30 261.03 N
For the 6 m height
k~ = 0.67
V,’ = 44x 1.07x0.67x 1.00 =31.54 m/s
,
= 0.6 (31,54)2= 596.86 N/m2
F%e = 596.86 x 0.8x 3.35x 18=28 792.526 N
Treating the water tank as a cantilever beam, support reaction
R~ = 208318.02 N
B.M. and S.F. at a section x metres from point B
Reaction b’, =48 992.00 N
Moment A4x = –FB x
If.r=o A4x=o
lfx= 5 MX=–48 992x 5 =–244960 N-m
B.M. at a section x metres from point F
v, = FB + FF
— 48 992+65
— 340.91 = 114332.91 N
M, = -[FB (5 + .x) + FF(x)]
Ii- x = 6m
M, = -[48 992 X11+ 65 340.91X 6]
— -[538 912 + 392 045/46]= -930957.46 N-m
—
B.M. and S.F. at a section x metres from point E
V,= 48 992+65 340.91 +34 931.55= 149264.46 N
Mx = -[FB(ll+X) +FF(6+X)+ FE(X)]
Ifx = 6m
M. = -[48 992X 17+65 340.91 X 12+ 34931.55 x6]
= -[832 864+ 784 090.92+ 209 589.3]= -1826544.2 N-m
113](https://image.slidesharecdn.com/is875-windload-111116012529-phpapp02/85/Is-875-wind-load-121-320.jpg)
![SP 64 (S & T) :2001
B.M. and S.F. at a section x metres from point D
VX= FD + FE + FF + F’B= 179525.49 N
M, = -[48 992 (17 -+x)+65 340.91 (12 +x)+34 931.55(6 +x)+30 261.03x]
If x = 6m
M. = -[1 126 816+ 1176136.3 +419 178.6+ 181 566.48] =-2 903697.3 N-m
B.M. and S.F. at a section x metres from point C
Vx = 208318.02 N
MX = -[48 992 (23+x)+65 340.91 (18+X)+34 931.55 (12+X)+30 261.03 (6+ x)+28 792.53x]
If x = 6m
M, = -[1 420768 + 1568 181.8+ 628 767.9+ 363 132.36+ 172 755.18]
= –4 153605.2 N-m
114](https://image.slidesharecdn.com/is875-windload-111116012529-phpapp02/85/Is-875-wind-load-122-320.jpg)


![ceramic-art-and-pottery [Autosaved].pptx](https://cdn.slidesharecdn.com/ss_thumbnails/ceramic-art-and-potteryautosaved-260113113456-35c55ddb-thumbnail.jpg?width=640&height=640&fit=bounds)


