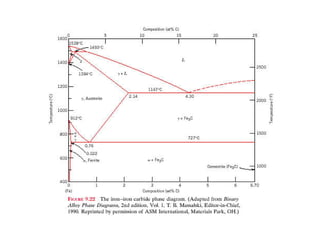
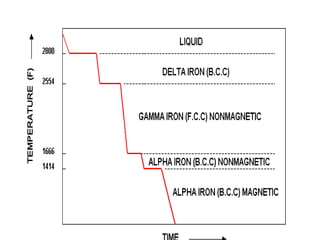
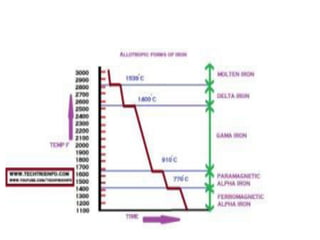
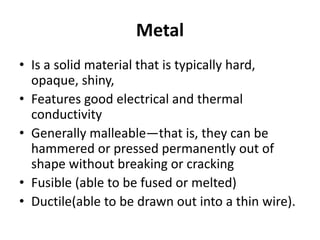
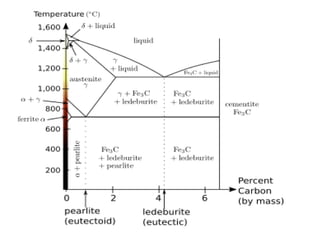
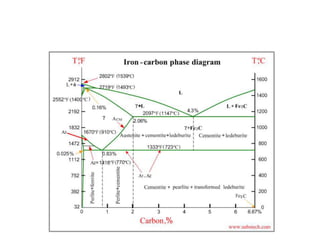
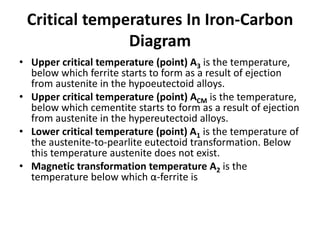
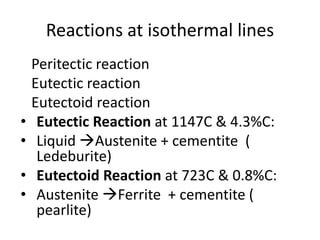
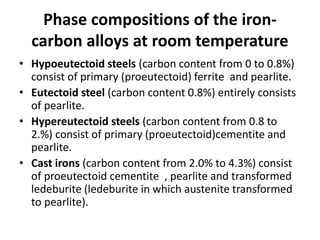
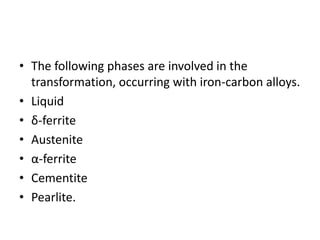
Phase Diagram and Allotropy
Phase Diagrams
• A phase diagram is a graphical way to
summarize the conditions under which the
different states of a substance are stable.
• The curves separating each area
represent the boundaries of phase
changes.
Cooling Curve for a Pure Metal
• A pure metal solidifies at a constant temperature
equal to its freezing point (same as melting point)
Figure: An ideal cooling curve for a pure metal.
Concepts…...
• Phase transformation
– Change from one phase to another
– E.g. L S, S S etc.
– Occurs because energy change is negative/goes
from high to low energy state
• Phase boundary
– Boundary between phases in a phase diagram
Solidification(cooling) curves
L
S
L
S
Pure metal Alloy
Tm
L S L + S
Solidification
complete
Soldification
begins
TL
TS
Microstructural changes during solidification
L
S
L S
T
t
Tm
L
S
Pure metal
S
Microstructural changes during solidification
L
S
Alloy
L + S
TL
TS
L
S
T
t
Results
L
S
L S
t
T
L
L + S
TL
TS S
L
L + S
TL
TS
Pure Cu
Cu-10%Ni
Cu-20%Ni
L
L S
Pure Ni
S
TNi
TCu
L
Binary isomorphous phase diagram
L+S
L
S
Composition
T
10 60 70 80 9030 40 5020
0 100
A B%B
L
L
S
T1
T2
T3
T4
CL C0 CS
Binary isomorphous phase diagram
x x
x
x
x
x
xx
x
x x
x
x x x x
x x x x
L+S
L
S
Composition
Temp
TCu
TNi
10 60 70 80 9030 40 5020
0 100
Cu Ni%Ni
Cu
Ni
Complete solubility
Notes
• This is an equilibrium phase diagram (slow
cooling)
• The phase boundary which separates the L from
the L+S region is called LIQUIDUS
• The phase boundary which separates the S from
the L+S region is called SOLIDUS
• The horizontal (isothermal) line drawn at a
specific temperature is called the TIE LINE
• The tie line can be meaningfully drawn only in a
two-phase region
• The average composition of the alloy is CO
Allotropy
• Some metals exhibited more than on crystal
structure over a certain temperature range.
• This phenomena is also known as
polymorphism
• The examples are iron, titanium, zirconium
and tin
Metal
• Is a solid material that is typically hard,
opaque, shiny,
• Features good electrical and thermal
conductivity
• Generally malleable—that is, they can be
hammered or pressed permanently out of
shape without breaking or cracking
• Fusible (able to be fused or melted)
• Ductile(able to be drawn out into a thin wire).
Alloy
• Is a mixture of two or more elements in which the
main component is a metal.
• Combining different ratios of elements as alloys
modifies the properties of pure metals to produce
desirable characteristics.
• The aim of making alloys is generally to make them less
brittle, harder, resistant to corrosion, or have a more
desirable color and luster.
• Of all the metallic alloys in use today, the alloys of iron
(steel, stainless steel, cast iron, tool steel, alloy steel)
make up the largest proportion both by quantity and
commercial value.
Introduction Delta Region
Iron-carbon phase diagram
• Describes the iron-carbon system of alloys
containing up to 6.67% of carbon,
• Discloses the Phases compositions
• Transformations occurring with the alloys
during their cooling or heating.
• Carbon content 6.67% corresponds to the
fixed composition of the iron carbide Fe3C.
Critical temperatures In Iron-Carbon
Diagram
• Upper critical temperature (point) A3 is the temperature,
below which ferrite starts to form as a result of ejection
from austenite in the hypoeutectoid alloys.
• Upper critical temperature (point) ACM is the temperature,
below which cementite starts to form as a result of ejection
from austenite in the hypereutectoid alloys.
• Lower critical temperature (point) A1 is the temperature of
the austenite-to-pearlite eutectoid transformation. Below
this temperature austenite does not exist.
• Magnetic transformation temperature A2 is the
temperature below which α-ferrite is
Reactions at isothermal lines
Peritectic reaction
Eutectic reaction
Eutectoid reaction
• Eutectic Reaction at 1147C & 4.3%C:
• Liquid Austenite + cementite (
Ledeburite)
• Eutectoid Reaction at 723C & 0.8%C:
• Austenite Ferrite + cementite (
pearlite)
Phase compositions of the iron-
carbon alloys at room temperature
• Hypoeutectoid steels (carbon content from 0 to 0.8%)
consist of primary (proeutectoid) ferrite and pearlite.
• Eutectoid steel (carbon content 0.8%) entirely consists
of pearlite.
• Hypereutectoid steels (carbon content from 0.8 to
2.%) consist of primary (proeutectoid)cementite and
pearlite.
• Cast irons (carbon content from 2.0% to 4.3%) consist
of proeutectoid cementite , pearlite and transformed
ledeburite (ledeburite in which austenite transformed
to pearlite).
• The following phases are involved in the
transformation, occurring with iron-carbon alloys.
• Liquid
• δ-ferrite
• Austenite
• α-ferrite
• Cementite
• Pearlite.
• L - Liquid solution of carbon in iron;
• δ-ferrite :Solid solution of carbon in iron. The of δ-ferrite is
BCC.
• Austenite : Intersitial solid solutionof carbon in γ-iron.
Austenite has FCC structure, permitting high solubility of
carbon – up to 2% at 1147 ºC.
• α-ferrite – Intersitial solid solution of carbon in α-iron.
ferrite has BCC crystal structure and low solubility of carbon
up to 0.025% at 723ºC. Ferrite exists at room temperature.
• Cementite – iron carbide, intermetallic compound, having
fixed composition Fe3C.
Definitions of Structures in IC Diagram
• Cementite/ Iron Carbide:
• Chemical formula Fe3c
• Contains 6.67% C by Wt.
• Hard and brittle
• orthorhombic crystal structure
• hardest material in IC diagram
Definitions of Structures in IC Diagram
• Austenite:
• solid solution of gamma f.c.c iron and carbon
• Max. solubility is 2%C at 2065F
• Not stable at room temperature
• Ferrite:
• Alpha solid solution with small amount of carbon
• max. solubility is 0.025%c by wt at 1333F
• At room temperature solubility is 0.008%
• Softest structure in IC diagram
Definitions of Structures in IC Diagram
• Ledeburite:
A eutectic mixture of austenite and cementite
Contains 4.3%C at 2065F.
• Pearlite:
Eutectoid mixture ferrite and cementite
Contains 0.08%c at 1333F on vv slow cooling
 Structure is very fine plate like
Pearlite
• It is a mixture of two phases. Ferrite and
cementite.
• Lamellar structure composed of alternating
layers of alpha-Iron and cementite.
• The eutectoid composition of austenite is
approximately 0.8% cabon.
• Steel with less carbon content will contain a
ferrite (pro eutectiod) and Pearlite
• Steels with higher carbon contents contains
cementite (Pro eutectoid) and pearlite.
• The volume fraction of pro eutectoid ferrite
and cementite can be calculated from the
iron/iron—carbide equilibrium phase diagram
using the lever rule.
• Steels with pearlitic (eutectoid composition)
or near-pearlitic microstructure (near-
eutectoid composition) can be drawn into thin
wires.
• Such wires, commercially used as piano wires
• Often bundled into ropes,for suspension
bridges,
• As steel cord for tire reinforcement.
Plain Carbon Steel
• Where alloying additions are primarily made for
steel making
• Manganeses, Silcon and Aluminum are added as
deoxider.
• Carbon from .05-2.5% and Mn from .25-1.5%
• Manganeses is also added to combine with
sulpher to form MnS.
• Aluminium is also as a grain refiner.
• Plain carbon steels are not quenched and
tempered
• They can cool to different rates to obtain a
range of structure
• They are subjected to Annealing and
Normalizing.
• The important group of plain carbon steel
contain carbon less then 0.2%.
• Used in structural shapes such as plates, I -
beams, deformed bars for structural purposes,
shafts and gears
• Used for sheet metal forming
• They are also used for casting

Allotropy and FeC diagram

  • 1.
  • 2.
    Phase Diagrams • Aphase diagram is a graphical way to summarize the conditions under which the different states of a substance are stable. • The curves separating each area represent the boundaries of phase changes.
  • 4.
    Cooling Curve fora Pure Metal • A pure metal solidifies at a constant temperature equal to its freezing point (same as melting point) Figure: An ideal cooling curve for a pure metal.
  • 5.
    Concepts…... • Phase transformation –Change from one phase to another – E.g. L S, S S etc. – Occurs because energy change is negative/goes from high to low energy state • Phase boundary – Boundary between phases in a phase diagram
  • 6.
    Solidification(cooling) curves L S L S Pure metalAlloy Tm L S L + S Solidification complete Soldification begins TL TS
  • 7.
    Microstructural changes duringsolidification L S L S T t Tm L S Pure metal S
  • 8.
    Microstructural changes duringsolidification L S Alloy L + S TL TS L S T t
  • 9.
    Results L S L S t T L L +S TL TS S L L + S TL TS Pure Cu Cu-10%Ni Cu-20%Ni L L S Pure Ni S TNi TCu
  • 10.
    L Binary isomorphous phasediagram L+S L S Composition T 10 60 70 80 9030 40 5020 0 100 A B%B L L S T1 T2 T3 T4 CL C0 CS
  • 11.
    Binary isomorphous phasediagram x x x x x x xx x x x x x x x x x x x x L+S L S Composition Temp TCu TNi 10 60 70 80 9030 40 5020 0 100 Cu Ni%Ni Cu Ni
  • 12.
  • 13.
    Notes • This isan equilibrium phase diagram (slow cooling) • The phase boundary which separates the L from the L+S region is called LIQUIDUS • The phase boundary which separates the S from the L+S region is called SOLIDUS • The horizontal (isothermal) line drawn at a specific temperature is called the TIE LINE • The tie line can be meaningfully drawn only in a two-phase region • The average composition of the alloy is CO
  • 17.
    Allotropy • Some metalsexhibited more than on crystal structure over a certain temperature range. • This phenomena is also known as polymorphism • The examples are iron, titanium, zirconium and tin
  • 20.
    Metal • Is asolid material that is typically hard, opaque, shiny, • Features good electrical and thermal conductivity • Generally malleable—that is, they can be hammered or pressed permanently out of shape without breaking or cracking • Fusible (able to be fused or melted) • Ductile(able to be drawn out into a thin wire).
  • 21.
    Alloy • Is amixture of two or more elements in which the main component is a metal. • Combining different ratios of elements as alloys modifies the properties of pure metals to produce desirable characteristics. • The aim of making alloys is generally to make them less brittle, harder, resistant to corrosion, or have a more desirable color and luster. • Of all the metallic alloys in use today, the alloys of iron (steel, stainless steel, cast iron, tool steel, alloy steel) make up the largest proportion both by quantity and commercial value.
  • 23.
  • 25.
    Iron-carbon phase diagram •Describes the iron-carbon system of alloys containing up to 6.67% of carbon, • Discloses the Phases compositions • Transformations occurring with the alloys during their cooling or heating. • Carbon content 6.67% corresponds to the fixed composition of the iron carbide Fe3C.
  • 26.
    Critical temperatures InIron-Carbon Diagram • Upper critical temperature (point) A3 is the temperature, below which ferrite starts to form as a result of ejection from austenite in the hypoeutectoid alloys. • Upper critical temperature (point) ACM is the temperature, below which cementite starts to form as a result of ejection from austenite in the hypereutectoid alloys. • Lower critical temperature (point) A1 is the temperature of the austenite-to-pearlite eutectoid transformation. Below this temperature austenite does not exist. • Magnetic transformation temperature A2 is the temperature below which α-ferrite is
  • 27.
    Reactions at isothermallines Peritectic reaction Eutectic reaction Eutectoid reaction • Eutectic Reaction at 1147C & 4.3%C: • Liquid Austenite + cementite ( Ledeburite) • Eutectoid Reaction at 723C & 0.8%C: • Austenite Ferrite + cementite ( pearlite)
  • 28.
    Phase compositions ofthe iron- carbon alloys at room temperature • Hypoeutectoid steels (carbon content from 0 to 0.8%) consist of primary (proeutectoid) ferrite and pearlite. • Eutectoid steel (carbon content 0.8%) entirely consists of pearlite. • Hypereutectoid steels (carbon content from 0.8 to 2.%) consist of primary (proeutectoid)cementite and pearlite. • Cast irons (carbon content from 2.0% to 4.3%) consist of proeutectoid cementite , pearlite and transformed ledeburite (ledeburite in which austenite transformed to pearlite).
  • 29.
    • The followingphases are involved in the transformation, occurring with iron-carbon alloys. • Liquid • δ-ferrite • Austenite • α-ferrite • Cementite • Pearlite.
  • 30.
    • L -Liquid solution of carbon in iron; • δ-ferrite :Solid solution of carbon in iron. The of δ-ferrite is BCC. • Austenite : Intersitial solid solutionof carbon in γ-iron. Austenite has FCC structure, permitting high solubility of carbon – up to 2% at 1147 ºC. • α-ferrite – Intersitial solid solution of carbon in α-iron. ferrite has BCC crystal structure and low solubility of carbon up to 0.025% at 723ºC. Ferrite exists at room temperature. • Cementite – iron carbide, intermetallic compound, having fixed composition Fe3C.
  • 31.
    Definitions of Structuresin IC Diagram • Cementite/ Iron Carbide: • Chemical formula Fe3c • Contains 6.67% C by Wt. • Hard and brittle • orthorhombic crystal structure • hardest material in IC diagram
  • 32.
    Definitions of Structuresin IC Diagram • Austenite: • solid solution of gamma f.c.c iron and carbon • Max. solubility is 2%C at 2065F • Not stable at room temperature • Ferrite: • Alpha solid solution with small amount of carbon • max. solubility is 0.025%c by wt at 1333F • At room temperature solubility is 0.008% • Softest structure in IC diagram
  • 33.
    Definitions of Structuresin IC Diagram • Ledeburite: A eutectic mixture of austenite and cementite Contains 4.3%C at 2065F. • Pearlite: Eutectoid mixture ferrite and cementite Contains 0.08%c at 1333F on vv slow cooling  Structure is very fine plate like
  • 34.
    Pearlite • It isa mixture of two phases. Ferrite and cementite. • Lamellar structure composed of alternating layers of alpha-Iron and cementite. • The eutectoid composition of austenite is approximately 0.8% cabon.
  • 35.
    • Steel withless carbon content will contain a ferrite (pro eutectiod) and Pearlite • Steels with higher carbon contents contains cementite (Pro eutectoid) and pearlite. • The volume fraction of pro eutectoid ferrite and cementite can be calculated from the iron/iron—carbide equilibrium phase diagram using the lever rule.
  • 36.
    • Steels withpearlitic (eutectoid composition) or near-pearlitic microstructure (near- eutectoid composition) can be drawn into thin wires. • Such wires, commercially used as piano wires • Often bundled into ropes,for suspension bridges, • As steel cord for tire reinforcement.
  • 37.
    Plain Carbon Steel •Where alloying additions are primarily made for steel making • Manganeses, Silcon and Aluminum are added as deoxider. • Carbon from .05-2.5% and Mn from .25-1.5% • Manganeses is also added to combine with sulpher to form MnS. • Aluminium is also as a grain refiner.
  • 38.
    • Plain carbonsteels are not quenched and tempered • They can cool to different rates to obtain a range of structure • They are subjected to Annealing and Normalizing.
  • 39.
    • The importantgroup of plain carbon steel contain carbon less then 0.2%. • Used in structural shapes such as plates, I - beams, deformed bars for structural purposes, shafts and gears • Used for sheet metal forming • They are also used for casting