IRJET- Modelling of Sediment Load for Selected Inflow Rivers of Loktak Lake, Manipur
•
0 likes•6 views

https://www.irjet.net/archives/V6/i7/IRJET-V6I7380.pdf

Recommended
Recommended
More Related Content
Similar to IRJET- Modelling of Sediment Load for Selected Inflow Rivers of Loktak Lake, Manipur
Similar to IRJET- Modelling of Sediment Load for Selected Inflow Rivers of Loktak Lake, Manipur (20)
More from IRJET Journal
More from IRJET Journal (20)
Recently uploaded
Recently uploaded (20)
IRJET- Modelling of Sediment Load for Selected Inflow Rivers of Loktak Lake, Manipur
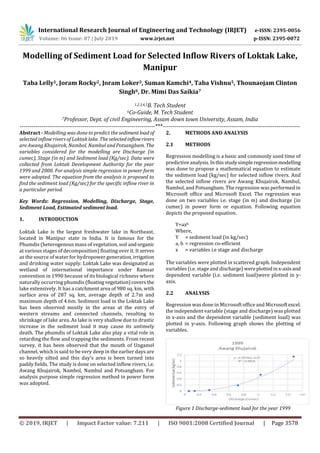
- 1. International Research Journal of Engineering and Technology (IRJET) e-ISSN: 2395-0056 Volume: 06 Issue: 07 | July 2019 www.irjet.net p-ISSN: 2395-0072 © 2019, IRJET | Impact Factor value: 7.211 | ISO 9001:2008 Certified Journal | Page 3578 Modelling of Sediment Load for Selected Inflow Rivers of Loktak Lake, Manipur Taba Lelly1, Joram Rocky2, Joram Loker3, Suman Kamchi4, Taba Vishnu5, Thounaojam Clinton Singh6, Dr. Mimi Das Saikia7 1,2,3,4,5B. Tech Student 6Co-Guide, M. Tech Student 7Professor, Dept. of civil Engineering, Assam down town University, Assam, India ---------------------------------------------------------------------***---------------------------------------------------------------------- Abstract - Modelling was done to predict the sedimentload of selected inflow rivers of Loktak lake. The selectedinflowrivers are Awang Khujairok, Nambol, Nambul and Potsangbam. The variables considered for the modelling are Discharge (in cumec), Stage (in m) and Sediment load (Kg/sec). Data were collected from Loktak Development Authority for the year 1999 and 2000. For analysis simple regression in power form were adopted. The equation from the analysis is proposed to find the sediment load (Kg/sec) for the specific inflow river in a particular period. Key Words: Regression, Modelling, Discharge, Stage, Sediment Load, Estimated sediment load. 1. INTRODUCTION Loktak Lake is the largest freshwater lake in Northeast, located in Manipur state in India. It is famous for the Phumdis (heterogenous mass of vegetation, soil andorganic at various stages of decomposition) floating over it. It serves as the source of water for hydropower generation,irrigation and drinking water supply. Loktak Lake was designated as wetland of international importance under Ramsar convention in 1990 because of its biological richness where naturally occurring phumdis (floatingvegetation)coversthe lake extensively. It has a catchment area of 980 sq. km, with surface area of 287 sq. km, average depth of 2.7m and maximum depth of 4.6m. Sediment load in the Loktak Lake has been observed mostly in the areas at the entry of western streams and connected channels, resulting to shrinkage of lake area. As lake is very shallow due to drastic increase in the sediment load it may cause its untimely death. The phumdis of Loktak Lake also play a vital role in retarding the flow and trapping the sediments. From recent survey, it has been observed that the mouth of Ungamel channel, which is said to be very deep in the earlier days are so heavily silted and this day’s area is been turned into paddy fields. The study is done on selected inflow rivers, i.e. Awang Khujairok, Nambol, Nambul and Potsangbam. For analysis purpose simple regression method in power form was adopted. 2. METHODS AND ANALYSIS 2.1 METHODS Regression modelling is a basic and commonly used time of predictive analysis.Inthisstudysimpleregressionmodelling was done to propose a mathematical equation to estimate the sediment load (kg/sec) for selected inflow rivers. And the selected inflow rivers are Awang Khujairok, Nambul, Nambol, and Potsangbam. The regression was performed in Microsoft office and Microsoft Excel. The regression was done on two variables i.e. stage (in m) and discharge (in cumec) in power form or equation. Following equation depicts the proposed equation. Y=axb Where, Y = sediment load (in kg/sec) a, b = regression co-efficient x = variables i.e stage and discharge The variables were plotted in scattered graph. Independent variables (i.e. stage and discharge)wereplottedinx-axisand dependent variable (i.e. sediment load)were plotted in y- axis. 2.2 ANALYSIS Regression was done in Microsoft office and Microsoftexcel. the independent variable (stage and discharge) was plotted in x-axis and the dependent variable (sediment load) was plotted in y-axis. Following graph shows the plotting of variables. Figure 1 Discharge-sediment load for the year 1999
- 2. International Research Journal of Engineering and Technology (IRJET) e-ISSN: 2395-0056 Volume: 06 Issue: 07 | July 2019 www.irjet.net p-ISSN: 2395-0072 © 2019, IRJET | Impact Factor value: 7.211 | ISO 9001:2008 Certified Journal | Page 3579 Figure 1 shows the graph plotted between discharge (in cumec) and sediment load (kg/sec) from January to December 1999. Statistical regression has been done for the given data set. And it has been observedthatthe relationship between sediment load (kg/sec) and discharge (in cumec) gives the best fit curve in powerequation. The equation here, has been proposed as y = 0.4378x2.2177 and R2= 0.9958. where y = sediment load (in kg/sec) and x = discharge (in cumec). Figure 2 stage-sediment load for the year 2000 Figure 2 shows the graph plotted between stage (in meter) and sediment load (kg/sec) fromJanuarytoDecember 1999. Statistical regression has been done for the given data set. And it has been observed that the relationship between sediment load (kg/sec) and stage (in meter)givesthebest fit curve in power equation. The equation here, has been proposed as y = 62.524x6.0345and R2= 0.965. Where y = sediment load (in kg/sec) and x = stage (in meter). Same procedures were adopted for rest of the selected inflows rivers for the year 1999 and 2000. Following table depicts the proposed equations which were obtained after regression analysis for stage-sediment load and discharge- sediment load for the year 1999 and 2000. Table 1 Proposed Equation. Sl. No. Year Inflow river Regression equation (Proposed equation) R² 1 1999 Awang Khujairok y = 0.4378x2.2177 0.9958 2 1999 Nambol y = 0.1476x 1.6034 0.9931 3 1999 Nambul y = 0.0895x 1.4478 0.9981 4 1999 Potsangbam y = 0.4287x2.7457 0.9514 5 2000 Awang Khujairok y = 0.4541x2.4361 0.9514 6 2000 Nambol y = 0.142x1.6075 0.9954 7 2000 Nambul y = 0.0923x1.4088 0.992 8 2000 Potsangbam y = 0.3454x 2.652 0.9663 9 1999 Awang Khujairok y = 62.524x6.0345 0.965 10 1999 Nambol y = 0.0323x5.3303 0.8311 11 1999 Nambul y = 0.9661x1.1249 0.8239 12 1999 Potsangbam y = 0.7865x2.7953 0.8685 13 2000 Awang Khujairok y = 16.852x 4.8609 0.656 14 2000 Nambol y = 0.0826x 4.1682 0.6433 15 2000 Nambul y = 0.4383x2.9519 0.8958 16 2000 Potsangbam y = 2.7566x4.3739 0.797 Discharge-Sediment Load Stage-Sediment Load 2.2.1 VALIDATION OF THE PROPOSED MATHEMATICAL MODEL For validation of the equationstheEstimatedsedimentloads are compared with the observed sediment loads. The comparisons are presented and plotted in the following tables and graphs respectively. Graphs are plotted for the Discharge-sediment load, Stage-sediment load and actual sediment load for the year 1999 and 2000. Table 2 Observed sediment loads and Estimated sediment loads for the year 1999. Month Month Observed Sedimentload (Kg/sec) Estimated Sedimentload forstage- Sedimentload (Kg/sec) Estimated Sedimentload forDischarge- sedimentload (kg/sec) Observed Sediment load (Kg/sec) Estimated Sediment loadforstage- sediment load(Kg/sec) Estimated Sedimentload forDischarge- sedimentload (kg/sec) Jan Jan 0.001 0.004299164 0.001133936 Feb Feb Mar Mar April April May May 0.886 0.055529349 0.487955804 June June 3.507 1.668454828 3.189527198 July 1.139 0.435009661 1.042831586 July 3.614 7.122960671 4.328432036 Aug 0.538 0.876055234 0.468467535 Aug 5.941 8.158808057 7.023215662 Sept 0.188 0.229991575 0.21324888 Sept 4.623 8.712664629 5.629710149 Oct 0.035 0.04461247 0.038466998 Oct 3.052 1.781777289 2.74604784 Nov 0.004 0.004937073 0.005075234 Nov 0.121 0.140730307 0.13434404 Dec 0.001 0.000813024 0.000792374 Dec 0.022 0.049649983 0.02245359 Month Month Observed Sedimentload (Kg/sec) Estimated Sedimentload forstage- sedimentload (Kg/sec) Estimated Sedimentload forDischarge- sedimentload (kg/sec) Observed Sediment load (Kg/sec) Estimated Sediment loadforstage- sediment load(Kg/sec) Estimated Sedimentload forDischarge- sedimentload (kg/sec) Jan 0.034 0.862414301 0.03589202 Jan Feb 0.016 0.962840314 0.017038722 Feb Mar 0.016 1.241755682 0.017271936 Mar April April May 4.769 2.246081317 4.309874635 May 0.167 0.462489501 0.195298118 June 1.48 1.144966297 1.173435225 June 2.748 3.210487806 4.175171996 July 3.597 2.350178235 3.933337217 July 2.301 2.79502723 2.95499492 Aug 3.661 2.386193941 3.882500798 Aug 0.84 0.79754192 0.33189682 Sept 2.127 2.243694479 2.502806263 Sept 0.907 0.52099038 0.849789604 Oct 1.567 1.677298047 1.546331497 Oct 0.591 0.179102649 0.439377141 Nov 0.037 0.399384893 0.032429586 Nov 0.057 0.038551541 0.063566478 Dec 0.008 0.004228711 0.007777397 Dec 0.008 0.018212675 0.011416302 Year:-1999 ObservedSedimentload,Estimatedstage-sedimentload,Estimateddischarge-Sedimentload (Kg/sec) AwangKhujairok Nambol Nambul Potsangbam
- 3. International Research Journal of Engineering and Technology (IRJET) e-ISSN: 2395-0056 Volume: 06 Issue: 07 | July 2019 www.irjet.net p-ISSN: 2395-0072 © 2019, IRJET | Impact Factor value: 7.211 | ISO 9001:2008 Certified Journal | Page 3580 Table 3 Observed sediment loads and Estimated sediment loads for the year 2000. Month Month Observed Sedimentload (Kg/sec) Estimated Sedimentload forstage- Sedimentload (Kg/sec) Estimated Sedimentload forDischarge- sediment (kg/sec) Observed Sediment load (Kg/sec) Estimated Sediment loadforstage- sediment load(Kg/sec) Estimated Sedimentload forDischarge- sediment (kg/sec) Jan 0.000352921 2.91087E-05 Jan 0.009 0.08681074 0.010088387 Feb Feb Mar 0.01 0.03007097 0.011865627 Mar 0.053 0.016858247 0.04555539 April 0.253 0.574312664 0.486851594 April 1.909 0.08788845 1.233261465 May 0.328 0.137753812 0.241755302 May 4.505 3.286996607 4.711479706 June 0.079 0.067270052 0.0656197 June 2.873 2.277109444 2.927687213 July 0.294 0.343760276 0.319844464 July 3.982 2.976127493 4.06975536 Aug 0.331 0.101011674 0.240232388 Aug 1.274 1.013855209 1.437070616 Sept 0.188 0.351267688 0.206062188 Sept 6.504 6.750001418 7.822169943 Oct 0.29 0.115880419 0.222397837 Oct 5.028 3.783071597 4.925057961 Nov 0.012 0.01845219 0.01292459 Nov 0.103 0.359392253 0.105654158 Dec 0.002144883 0.000138089 Dec 0.017 0.128574256 0.01834826 Month Month Observed Sedimentload (Kg/sec) Estimated Sedimentload forstage- sedimentload (Kg/sec) Estimated Sedimentload forDischarge- sediment (kg/sec) Observed Sediment load (Kg/sec) Estimated Sediment loadforstage- sediment load(Kg/sec) Estimated Sedimentload forDischarge- sediment (kg/sec) Jan 0.012 0.028246617 0.013761267 Jan Feb 0.016 0.029532033 0.017565962 Feb 0.006 0.005076747 0.006927971 Mar 0.065 0.071481964 0.066691245 Mar 0.109 0.136477784 0.118005988 April 0.163 0.022553362 0.09022631 April 1.779 1.816085624 1.852835555 May 2.35 1.374957135 2.15511151 May 2.036 0.977684784 0.935462321 June 2.53 2.829695839 2.701420627 June 0.883 1.067417584 0.945720418 July 1.513 1.729367128 1.687398395 July 0.042 0.153889872 0.037983575 Aug 1.62 1.601173658 1.778445289 Aug 1.021 0.924633104 0.762535255 Sept 5.024 6.537693809 5.597243388 Sept 1.293 1.432465054 1.695495406 Oct 4.096 2.78112628 3.609396585 Oct 1.123 0.436043136 1.223318959 Nov 0.094 0.133797139 0.099265604 Nov 0.384 0.095886341 0.719799484 Dec 0.032 0.052089846 0.036042511 Dec 0.054 0.241304962 0.04663649 Year:-2000ObservedSedimentload,Estimatedstage-sedimentload,Estimateddischarge-Sedimentload (Kg/sec) AwangKhujairok Nambol Nambul Potsangbam Figure 3 Observed sediment loads and Estimated sediment loads for the year 1999 Graph represents observed and estimated sediments loads from the proposed equation. The trend followed by the estimated sediment load by both the prediction equation, i.e. sediment load vs stage and sediment load vs discharge follow the same pattern with the observedone.Thevalues of sediment load by the proposed equation are estimated to be little higher than the observed sediment load. The predictions in the equation give the value to higher side. A comparison of estimated values with respect to the observe values has been presented graphically in figure 3. 2.2.2 RESULTS The data collected for the inflow rivers to the Loktak lakefor the year 1999 and 2000 simple regressions analysis has been adopted to find a relationship between the sediment load vs stage and sediment load vs discharge. These relationships will be helpful for prediction of sediment load when the known variables are discharge and stage. With the help of the proposed equation, sediment loads for the stage and discharge has been estimated. When the estimated sediment load for both (i.e. stage and discharge) are plotted. It has been observed that the value of estimated sediment loads are higher than the observed sediment load, little high but it maintains the same trend for the peak of the graph has been presented here. The detailed data has been analysed. And required mathematical modelling has been done and proposed. 3. CONCLUSION In this project an effort has been made to propose a mathematical modelling to predict the sediment load of the Inflow Rivers of Loktak lake in relation to Discharge and stage for the rivers Awang Khujairok, Nambol, Nambul, and Potsangbam. The data were collected from Loktak Development Authority for the year 1999 and 2000. For analysis purpose simple regression in power equation has been adopted, as the power equation gives the closest value of R2 to 1. The proposed equation has been validated by comparing the observed sediment load to estimated
- 4. International Research Journal of Engineering and Technology (IRJET) e-ISSN: 2395-0056 Volume: 06 Issue: 07 | July 2019 www.irjet.net p-ISSN: 2395-0072 © 2019, IRJET | Impact Factor value: 7.211 | ISO 9001:2008 Certified Journal | Page 3581 sediment load of the all the inflow rivers for the year 1999 and 2000. It has been observed thatthe calculatedsediment load is higher than the actual sediment load. Nevertheless, the pattern in graph follows the same pattern. Hence the proposed mathematical modelling can beusedtopredictthe sediment load when value of Discharge and stage are provided. ACKNOWLEDGEMENT We take this opportunity to thank Prof. Lakshmi Prasad Saikia, Dean, Faculty of Engineering and Technology, Assam down town University for his approbationofthisproject. We are extremely indebted to our guide Prof. (Dr.) Mimi Das Saikia (ProfessorinCIVIL ENGINEERINGDepartment,Assam down town University) for her guidance, valuable advice, constructive criticism and her extensive discussion around our work. We are also thankful to Mr. Thounaojam Clinton Singh for his constant support, valuable advice and for collection of data from Loktak Development Authority, Manipur. REFERENCES 1. "Loktak Lake". Ramsar Sites Information Service. Retrieved 25 April 2018. 2. "Integrated Wetland and River BasinManagement – A Case Study of Loktak Lake". Wetlands International - South Asia, New Delhi, India. Archived from the original on 22 March 2012. Retrieved 2009-04-03. 3. Khwairakpam Gajananda; Thokchom Sundari Chanu. "The Fate of Loktak Lake". Retrieved 2009-04- 03. 4. "Loktak Lake". WWF India. Archived from the original on 2010-02-21. 5. "Bishnupur: The Land of the Dancing Deer". National Informatics Centre, Government of India. Retrieved 7 December2018. 6. "Developmental Activities and their Impacts on Wetlands". Archived from the original on 2011-07-27. Retrieved 2009-04-03. 7. "Loktak Lake Environment Information system (ENVIS)". Archived from the original on 2007-12-16. Retrieved 2009-04-03. 8. "The Montreux Record". The Ramsar Convention. 2009-09-08. Retrieved 2009-04-04. 9. State of Environment Report, Manipur. "Environment and Ecology Office Government of Manipur, Chapter X" (PDF). pp. 125–126. Archivedfrom the original (PDF) on 2009-04-10. Retrieved 2009-04- 01. 10. "TheManipurLoktak Lake(Protection)Amendment Act, 2007(Manipur Act No. 5 of 2007)" (PDF). Manipur Gazette. 2009-04-02. Archived from the original (PDF) on 2009-04-10. Retrieved 2009-04-02.