Download to read offline

![International Research Journal of Engineering and Technology (IRJET) e-ISSN: 2395-0056
Volume: 05 Issue: 10 | Oct 2018 www.irjet.net p-ISSN: 2395-0072
© 2018, IRJET | Impact Factor value: 7.211 | ISO 9001:2008 Certified Journal | Page 1590
3.0 METHDODLOGY
3.1 Incremental dynamic analysis
Incremental dynamic analysisisanonlineartimehistoryanalysisofstructuresbasedonthestructuralperformancewhichstates
the behavior of the structures in a range of different intensities of earthquake. In this method a structural model subjected to
one (or more) ground motion record(s), each scaled to multiple levels of intensity, thus producing one (or more) curve(s) of
response parameterized versus intensity level. Due to thedynamicandnon-linearnatureoftheearthquake,certainlytheresults
of this method in comparisonto the other types of analysesare closer to therealityofstructuralbehavior.However,thismethod
is a timeconsuming methodand like other kind of timehistory methods, is too dependentontherecords.Moreover,selectionof
intensity measures and engineering demandparametersareimportantissuesinincrementaldynamicanalysis.Thismethodhas
accepted by the guidelines of Federal Emergency Management Agency (FEMA) and can be used as a method in order to
determine the potential collapse capacity of the entire structure.
For incremental dynamic analysis past earthquake records of El-centro earthquake, Bhuj earthquake and Chamoli earthquake
were used. This earthquake records (PGA) were scaled from .1g to 1.1g for this analysis using seismosignal software.
Table-2 Earthquake data used for analysis
3.2 Pushover analysis
In Pushover analysis, a statichorizontal force profile, usually proportional to the design force profiles specifiedinthecodes,
is applied to the structure. The force profile is then incremented in small stepsand the structure is analyzed at each step. As the
loads are increased, the building undergoes yielding at a few locations. Every time such yielding takes place, the structural
properties are modified approximately to reflect the yielding. The analysis is continued till the structure collapses, or the
building reachescertainlevel of lateral displacement. It providesaloadversusdeflectioncurveofthestructurestartingfromthe
state of rest to the ultimate failure of the structure. The load is representative of the equivalent static load of the fundamental
mode of the structure. It is generally taken as the total base shear of the structureand the deflection is selected as the top-story
deflection. The selection of appropriate lateral load distribution is an important step. The first step then is to select a
displacement shape and the vector of lateral loads is determined as
{F } = p[ m]{Φ} (1)
Where {Φ} is the assumed displacement shape,and p is the magnitude of the lateral loads. From equation (1), it followsthat the
lateral force at anylevel is proportional to the assumed displacement shapeand storymass. If the assumeddisplacementshape
was exact and remained constant during ground shaking, then distribution of lateral forces would be equal to distribution of
effective earthquake forces.
4.0 RESULTS AND DISCUSSION
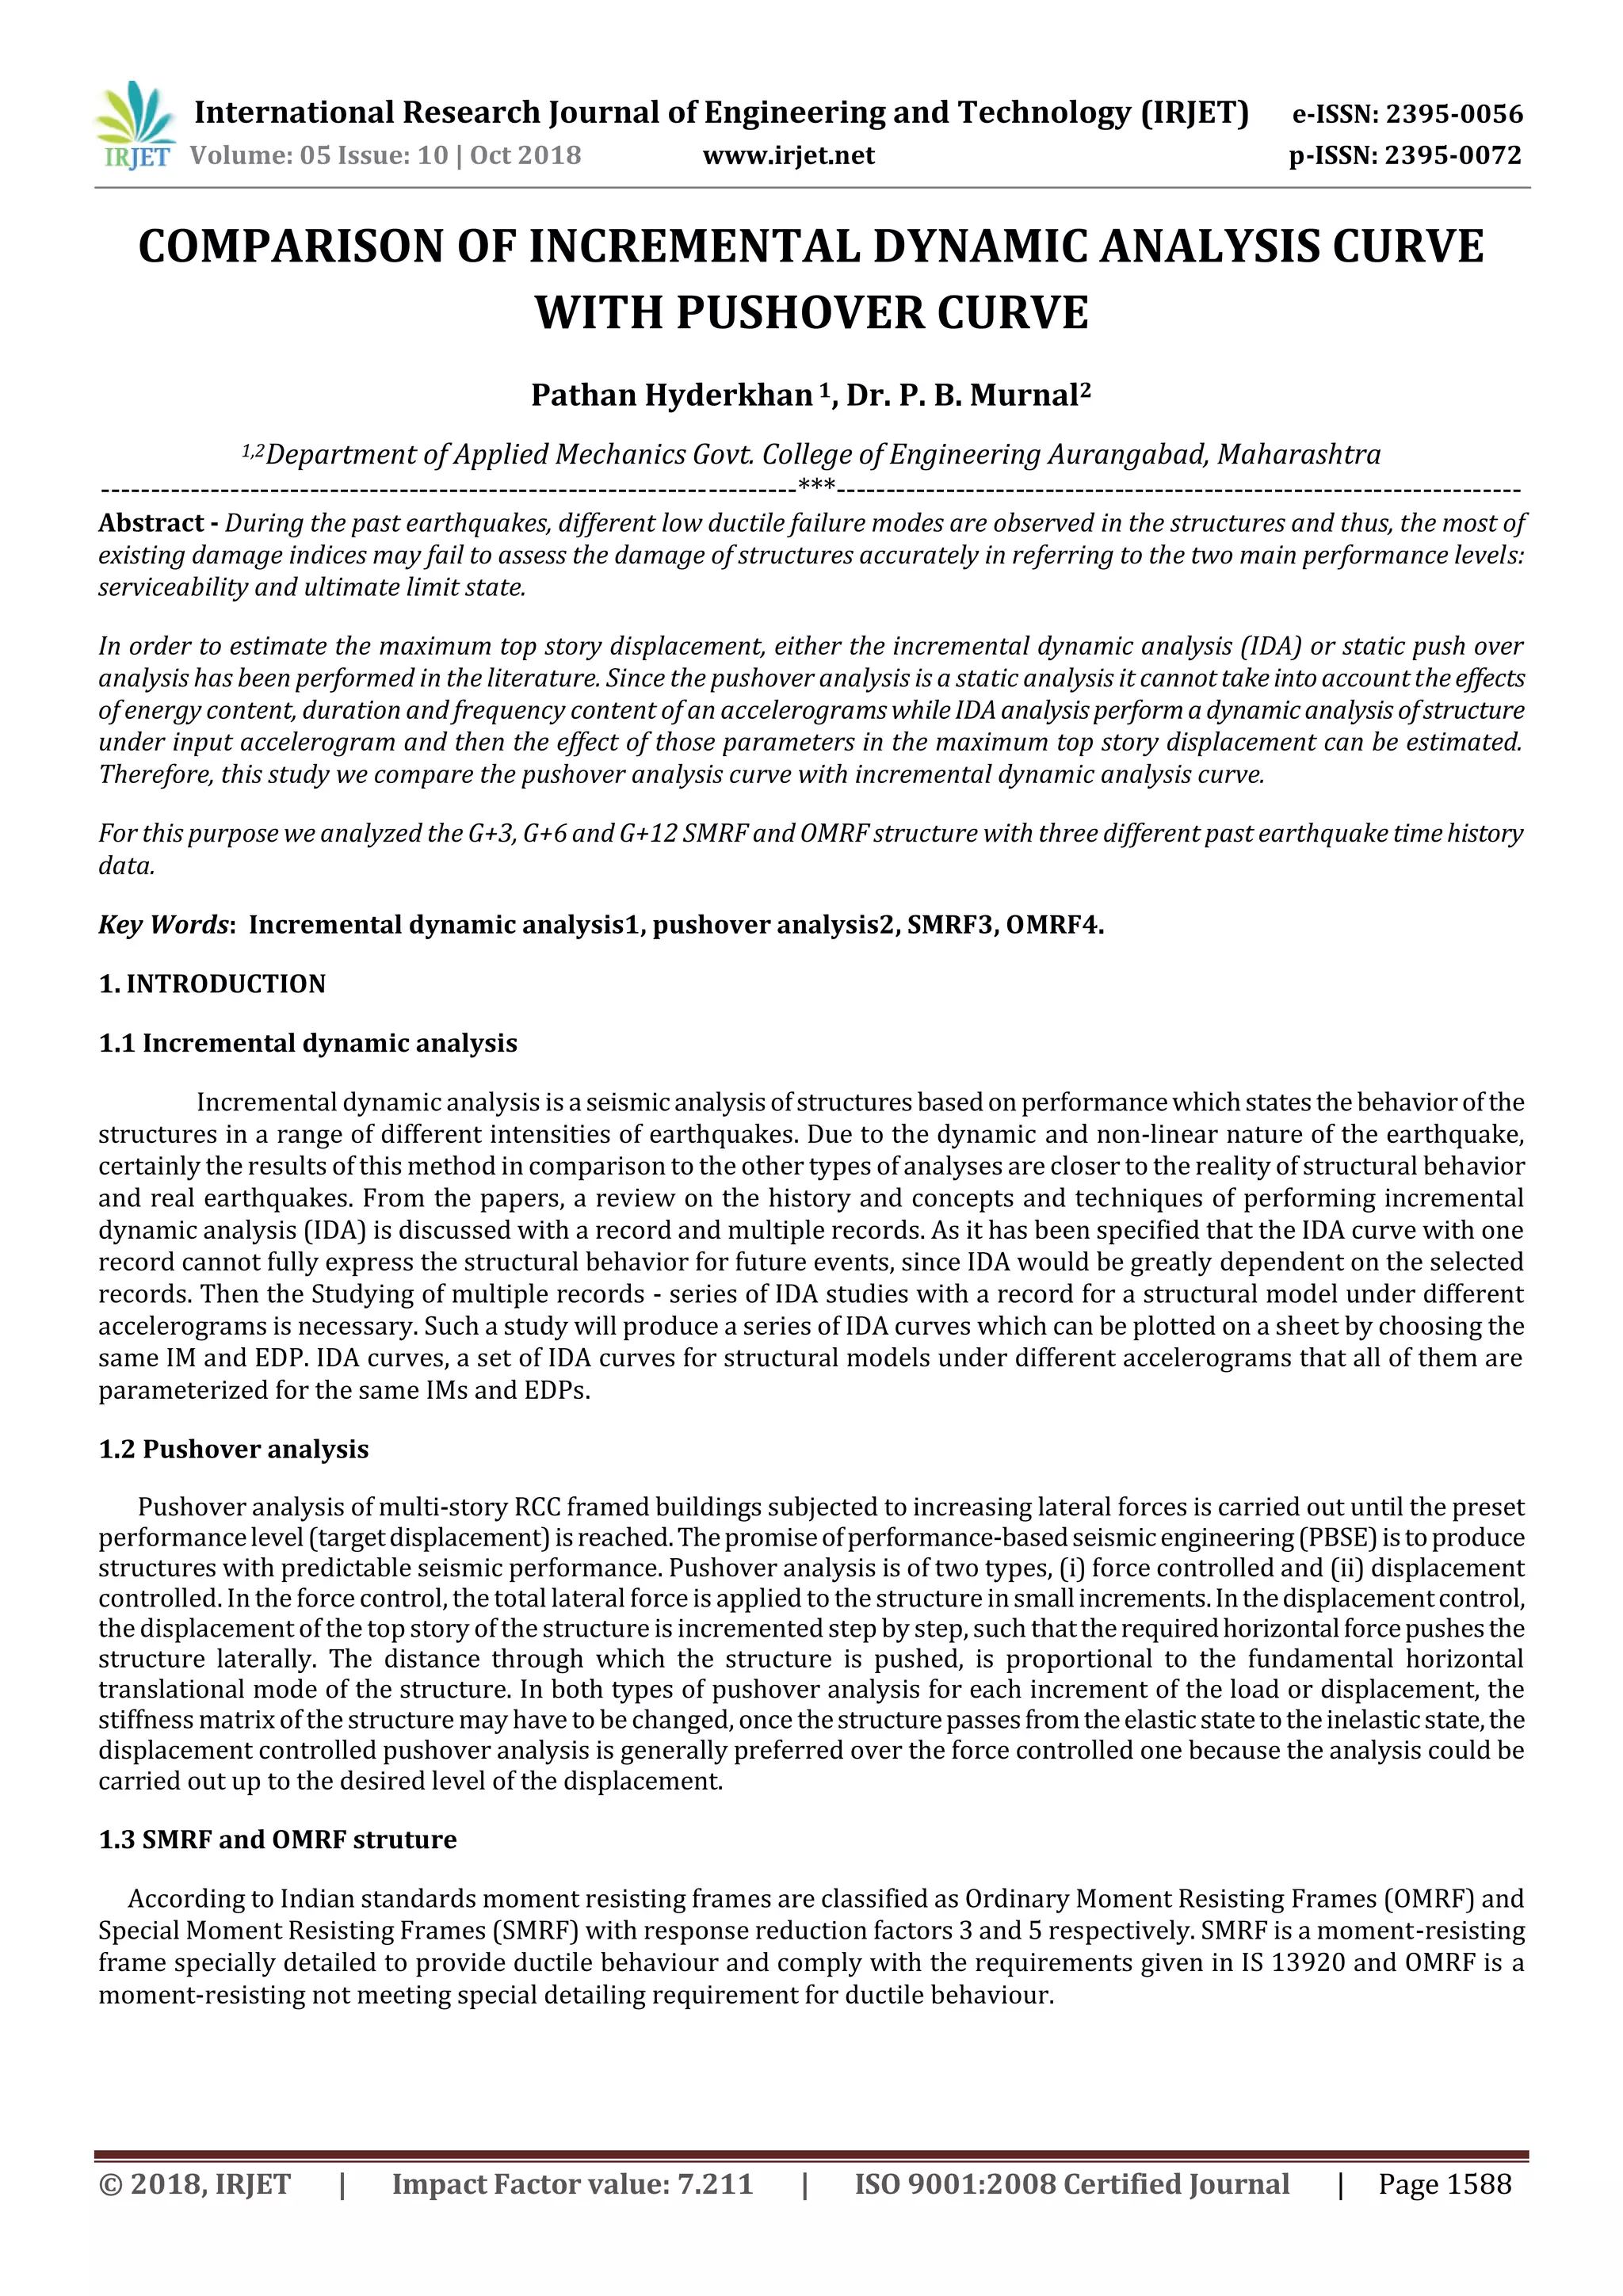
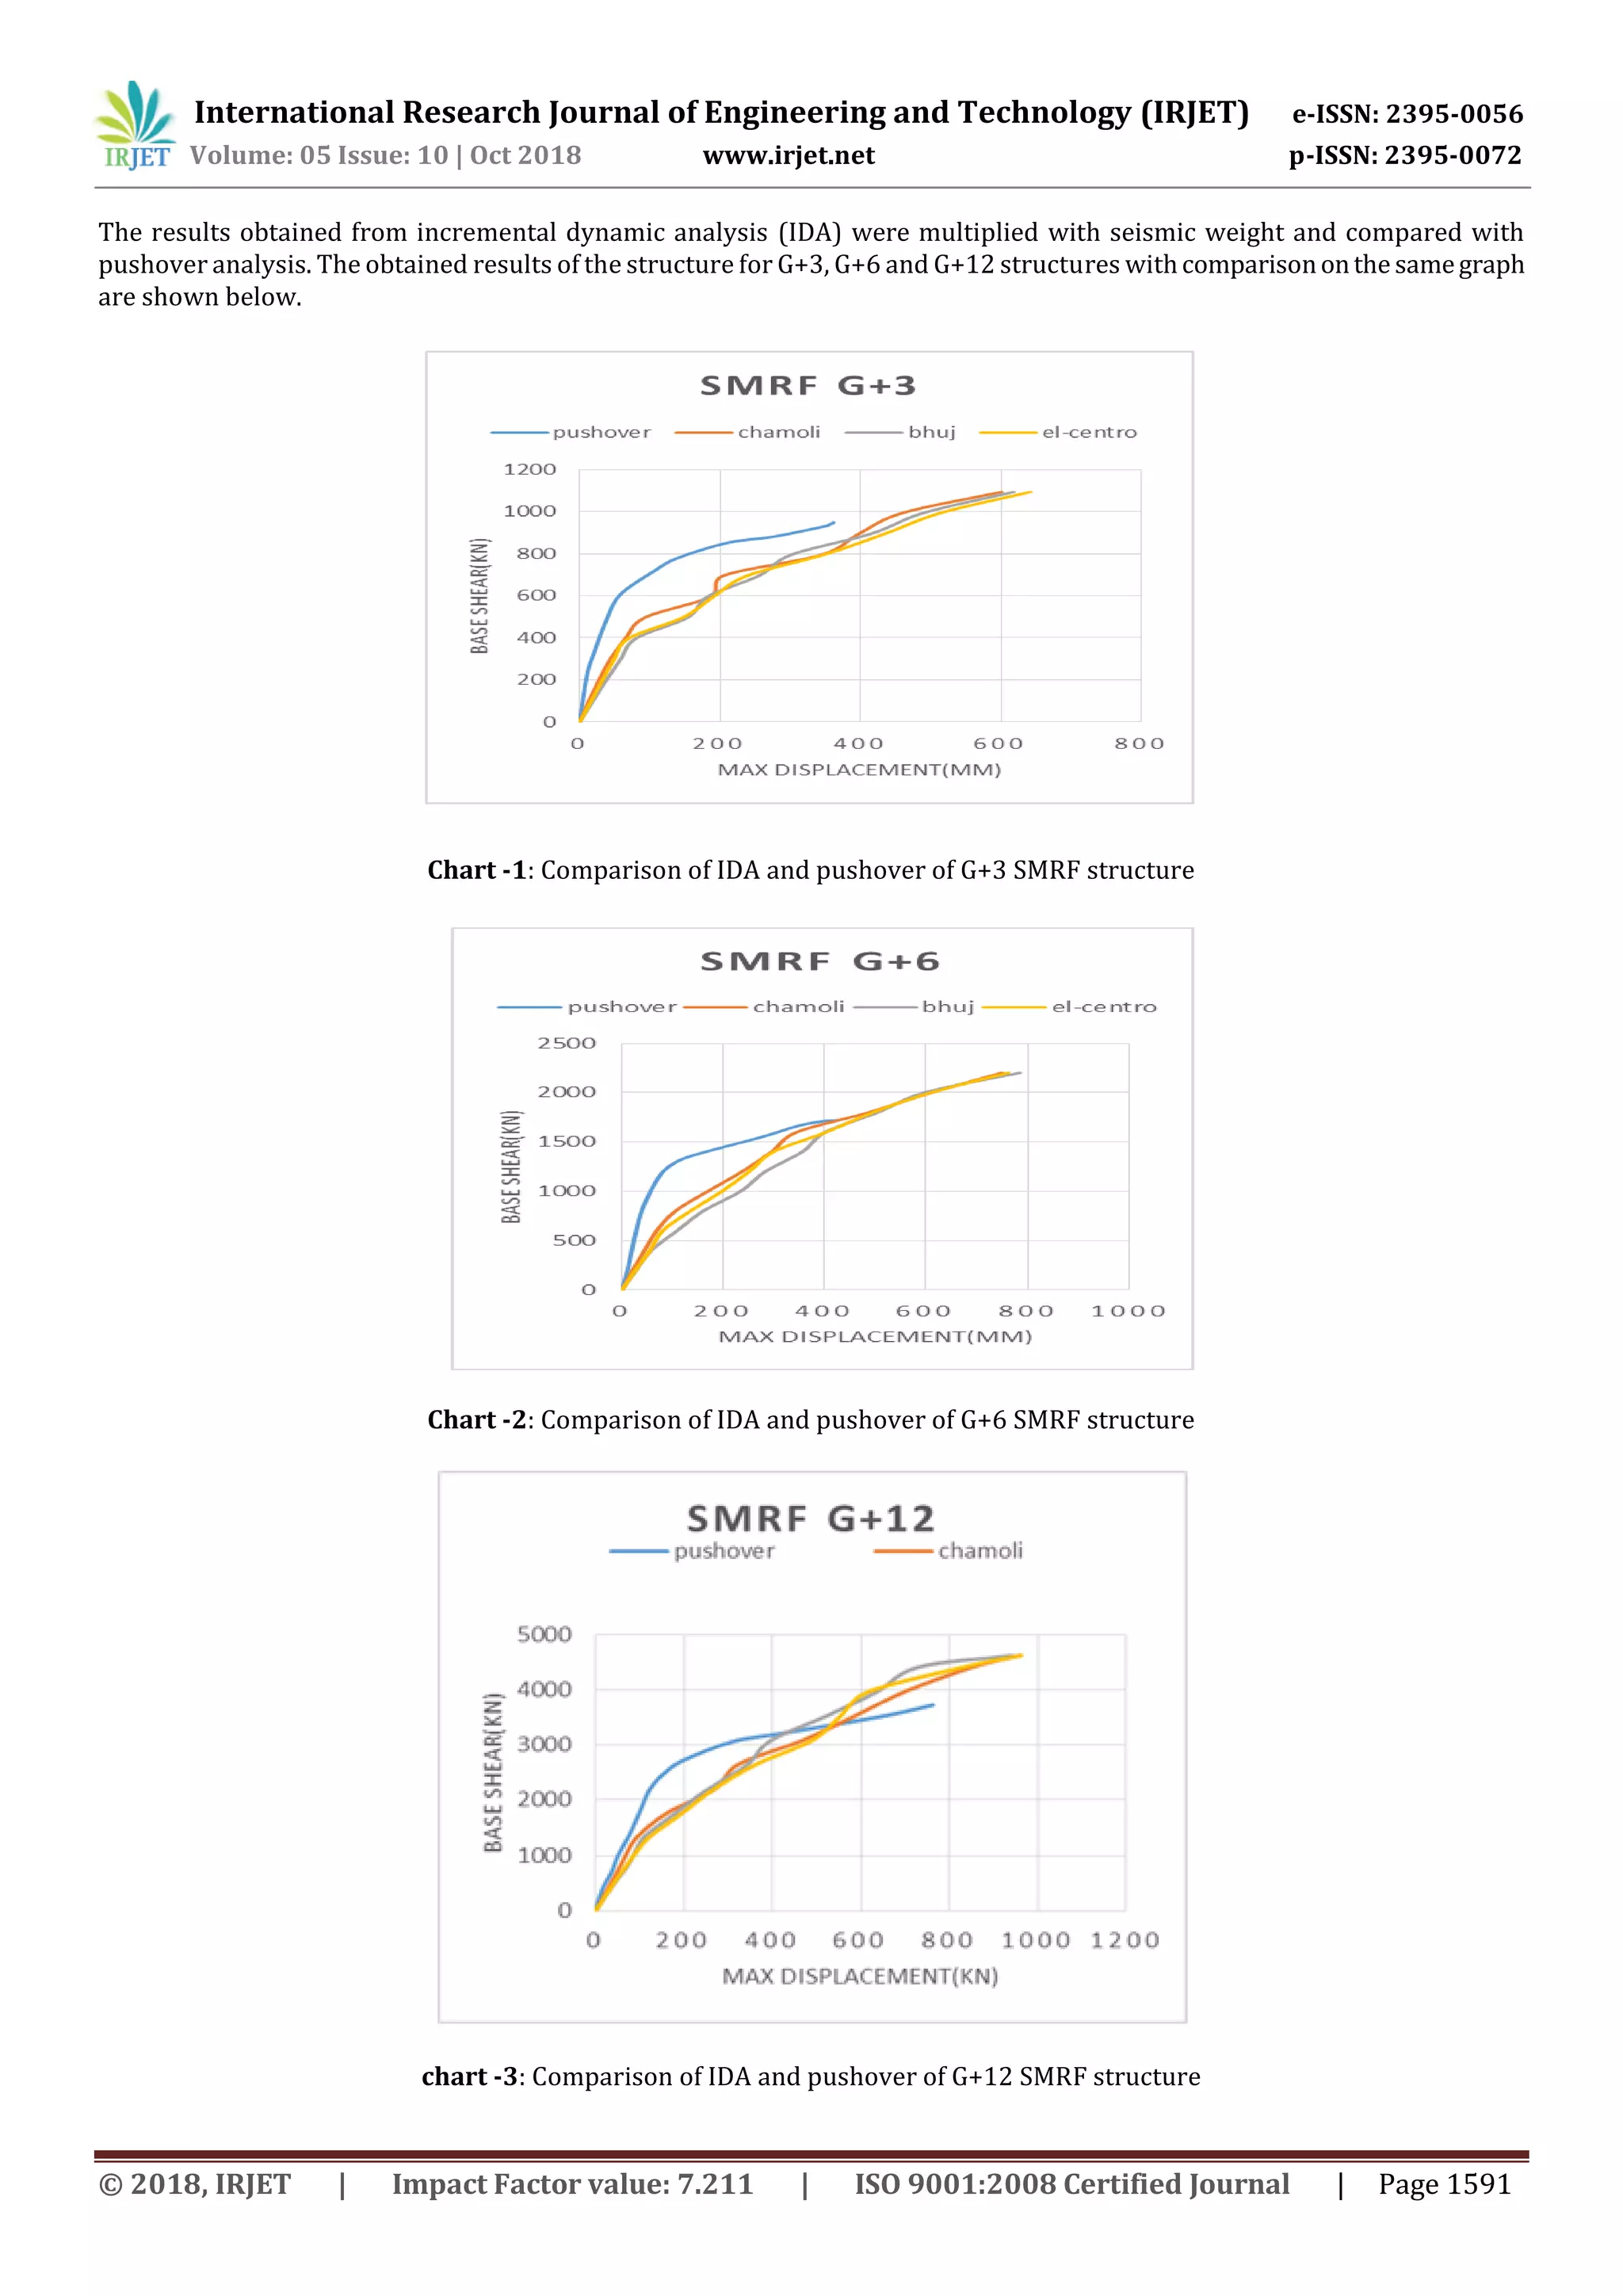
To compare the incremental dynamic analysis with pushover analysis the PGA values of incremental dynamic analysis are
multiplied with the seismic weight of the structure. The calculated seismic weight of structures are shown in table below
Table 3 Seismic weight of Structures
Serial number Frame Seismic Weight(kN/g)
1 G+3 993.7883
2 G+6 2000.669
3 G+12 4401.574
Name of Earthquake Date PGA(g)
El-Centro 18-5-1940 Scaled from .1g to 1.1g
Bhuj 26-01-2001 Scaled from .1g to 1.1g
Chamoli 29-3-1999 Scaled from .1g to 1.1g](https://image.slidesharecdn.com/irjet-v5i10302-181108101922/75/IRJET-Comparison-of-Incremental-Dynamic-Analysis-Curve-with-Pushover-Curve-3-2048.jpg)
![International Research Journal of Engineering and Technology (IRJET) e-ISSN: 2395-0056
Volume: 05 Issue: 10 | Oct 2018 www.irjet.net p-ISSN: 2395-0072
© 2018, IRJET | Impact Factor value: 7.211 | ISO 9001:2008 Certified Journal | Page 1593
The comparison of pushover and incremental dynamic analysis shows that for G+3 structure the maximum top story
displacement fortimehistory analysis is 77.58% and 68.19%morecomparetopushoveranalysisforSMRFandOMRFstructure
respectively. For G+12 structure this value decreased to 26.15% and 17.57% for SMRF and OMRF respectively. The base shear
values for time history analysis are 15.28% and 22.15% more as compare to pushover analysis for G+3 SMRF and OMRF
respectively. And forG+12 structuresthebaseshearvaluesfortimehistoryanalysisare24.22%and30.68%moreascompareto
pushover analysis forSMRF and OMRFstructure. It alsoshows that the displacement valueswithincrementaldynamicanalysis
are always more as compare to pushover analysis.
5. CONCLUSIONS
Incremental dynamic analysis and pushover analysis were conductedforG+3,G+6and G+12withSMRFandOMRFframes
considered in the study in-order to evaluate their seismic performance in terms ofmaximumtopstorydisplacement.Fromthe
obtained results it can be concluded as:
The response of structures for the same base shear value is more from incremental dynamic analysis as compare to
pushover analysis.
The values obtained from incremental dynamic analysis are more realistic and higher as compared with nonlinear
static pushover analysis
REFERENCES
[1] Hamed Arshadi, “An Overview on The Concepts And Methodologies of Incremental Dynamic Analysis IDA (With A
Single Record and Multiple Records)” Journal of A Structural Congress (2016), Vol. 3, pp. 168-176.
[2] J. Marasingha, K.K. Wijesundara and U.I. Dissanayake “Comparison of Incremental Dynamic Analysis Curve with
Pushover Curve”, Journals of Symposium on Engineering Advancements (2013), Vol. 2, pp. 155-158.
[3] Athanasia Zacharenaki, Michalis Fragiadakis, Dominic Assimaki and Manolis Papadrakakis “Bias Assessment in
Incremental Dynamic Analysis due to Record Scaling” Journal of Soil Dynamics and Earthquake Engineering
(September 2014) Vol.37, pp. 236-248, Elsevier Science Ltd.
[4] Asghar Bahramirad, Mohsen Tehranizadeh and Amir Moshref, “Equating Incremental Dynamic Analysis with Static
Nonlinear Analysis at Near-Field Excitation” Journal of Earthquake Engineering and Engineering Vibration
(September, 2015) Vol.14, No.3, pp. 789-801.
[5] FEMA (2000) “Prestandard and Commentary for the Seismic Rehabilitation of buildings”, FEMA 356, Federal
Emergency Management Agency, Washington.](https://image.slidesharecdn.com/irjet-v5i10302-181108101922/75/IRJET-Comparison-of-Incremental-Dynamic-Analysis-Curve-with-Pushover-Curve-6-2048.jpg)

This document compares the results of incremental dynamic analysis (IDA) and pushover analysis for G+3, G+6, and G+12 special moment resisting frame (SMRF) and ordinary moment resisting frame (OMRF) structures. IDA involves subjecting a structural model to scaled earthquake records to generate response curves, while pushover analysis applies monotonically increasing lateral loads. The document finds that IDA predicts higher maximum displacements and base shears compared to pushover analysis, with differences decreasing with building height. IDA results are considered more realistic since it accounts for earthquake frequency and duration effects not captured by static pushover analysis.