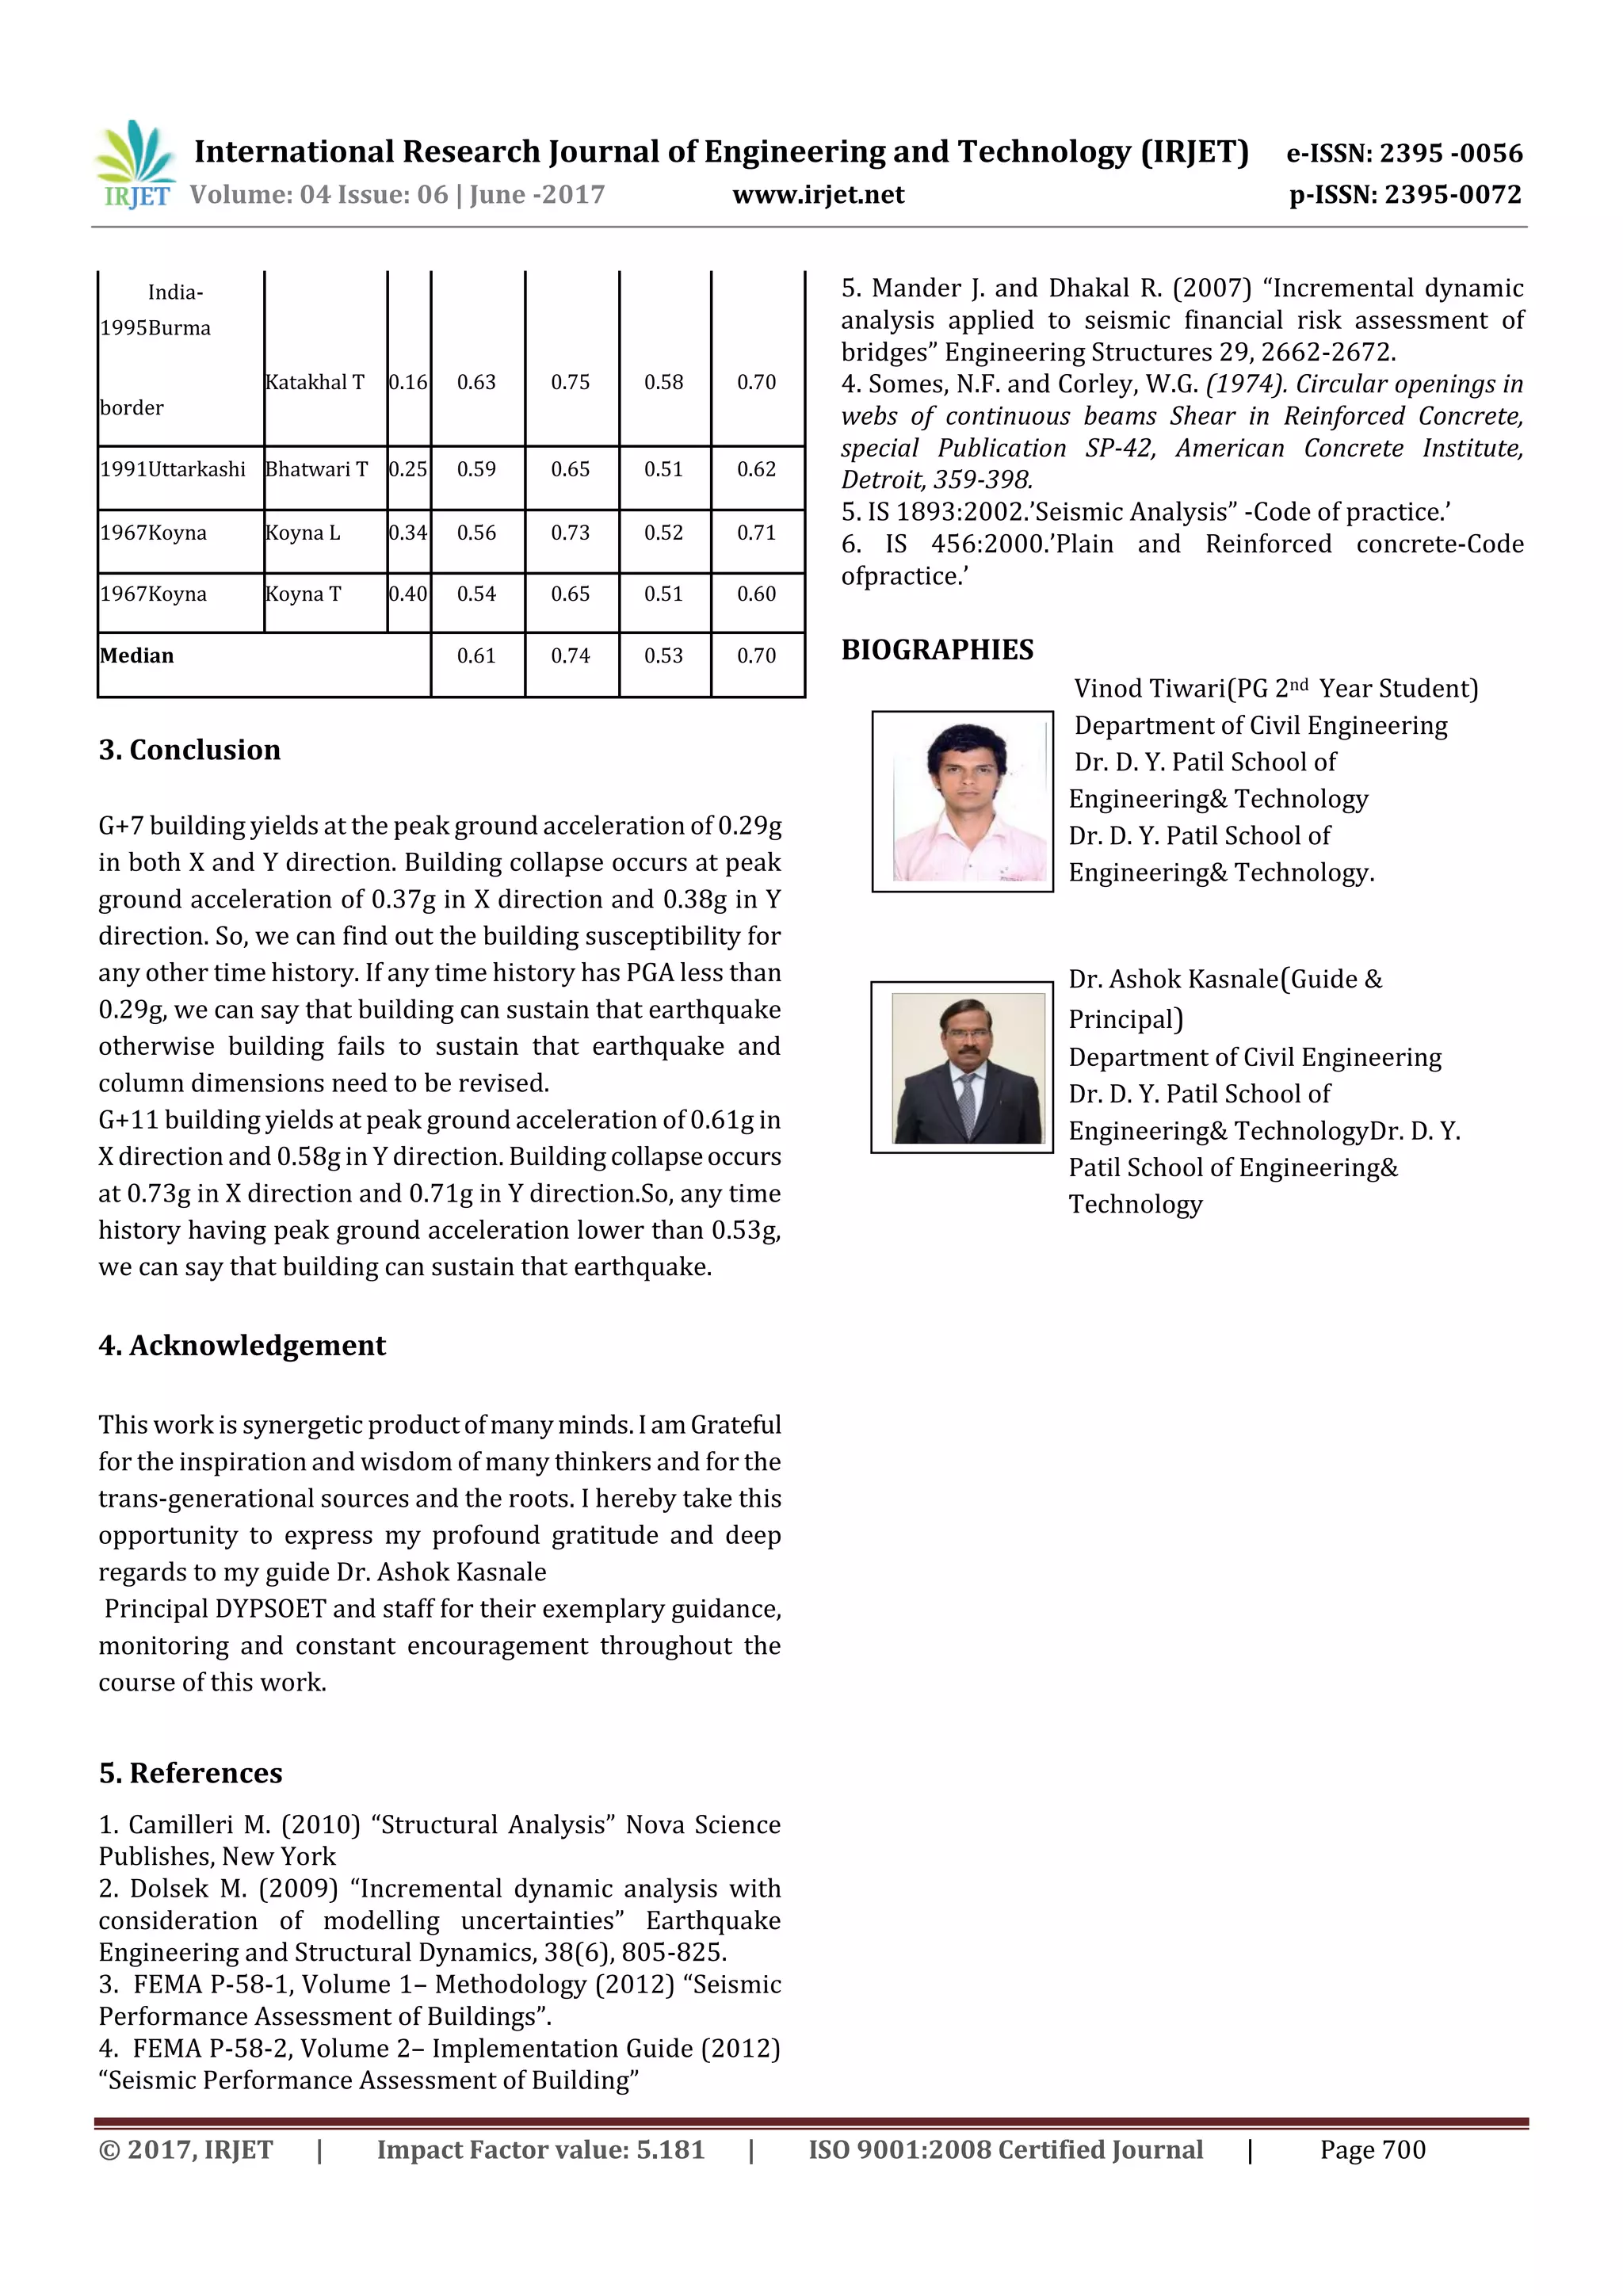
Download to read offline
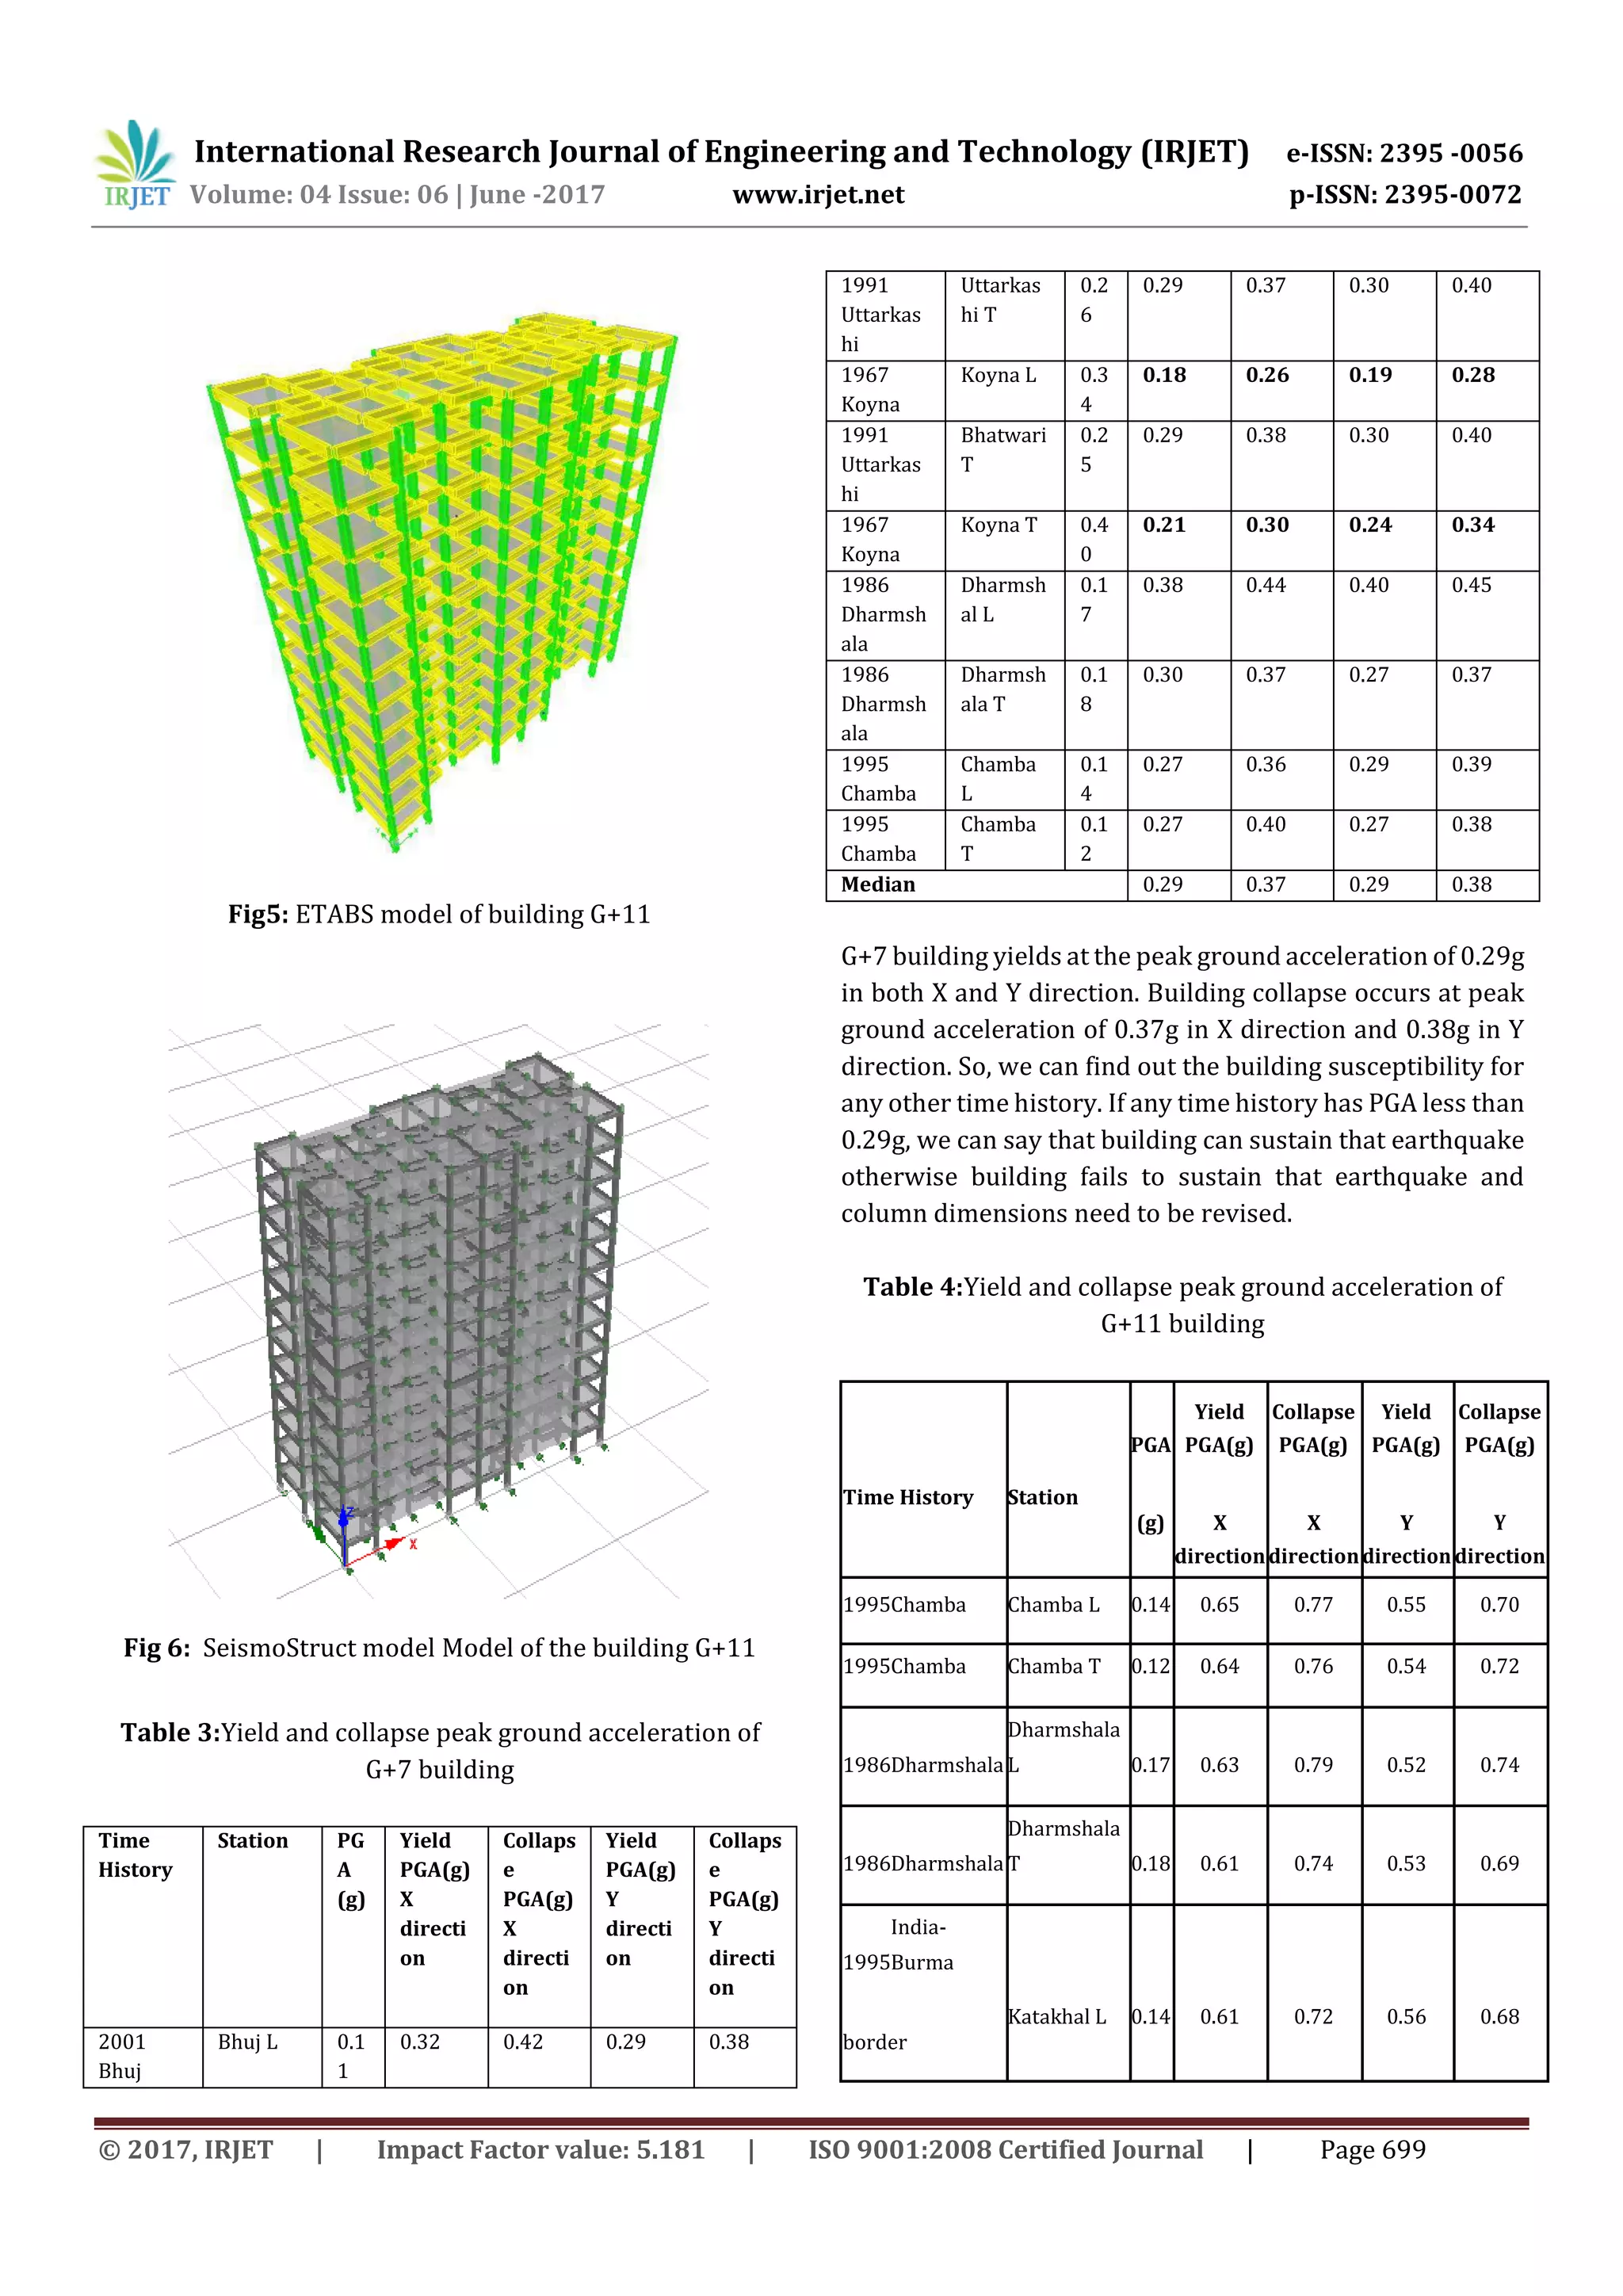

This document presents an incremental dynamic analysis of reinforced concrete buildings with 7 and 11 stories. IDA involves applying earthquake ground motions of increasing intensity to structural models until collapse. The 7-story building was found to yield at 0.29g and collapse at 0.37g, while the 11-story building yielded at 0.61g and collapsed at 0.73g. The analysis was conducted using SeismoStruct to model the buildings and evaluate response parameters like interstory drift ratio and base shear.
The analysis presents methodologies and findings on incremental dynamic analysis (IDA) of G+7 and G+11 buildings under seismic conditions.