Download to read offline
![International Research Journal of Engineering and Technology (IRJET) e-ISSN: 2395-0056
Volume: 09 Issue: 05 | May 2022 www.irjet.net p-ISSN: 2395-0072
© 2022, IRJET | Impact Factor value: 7.529 | ISO 9001:2008 Certified Journal | Page 287
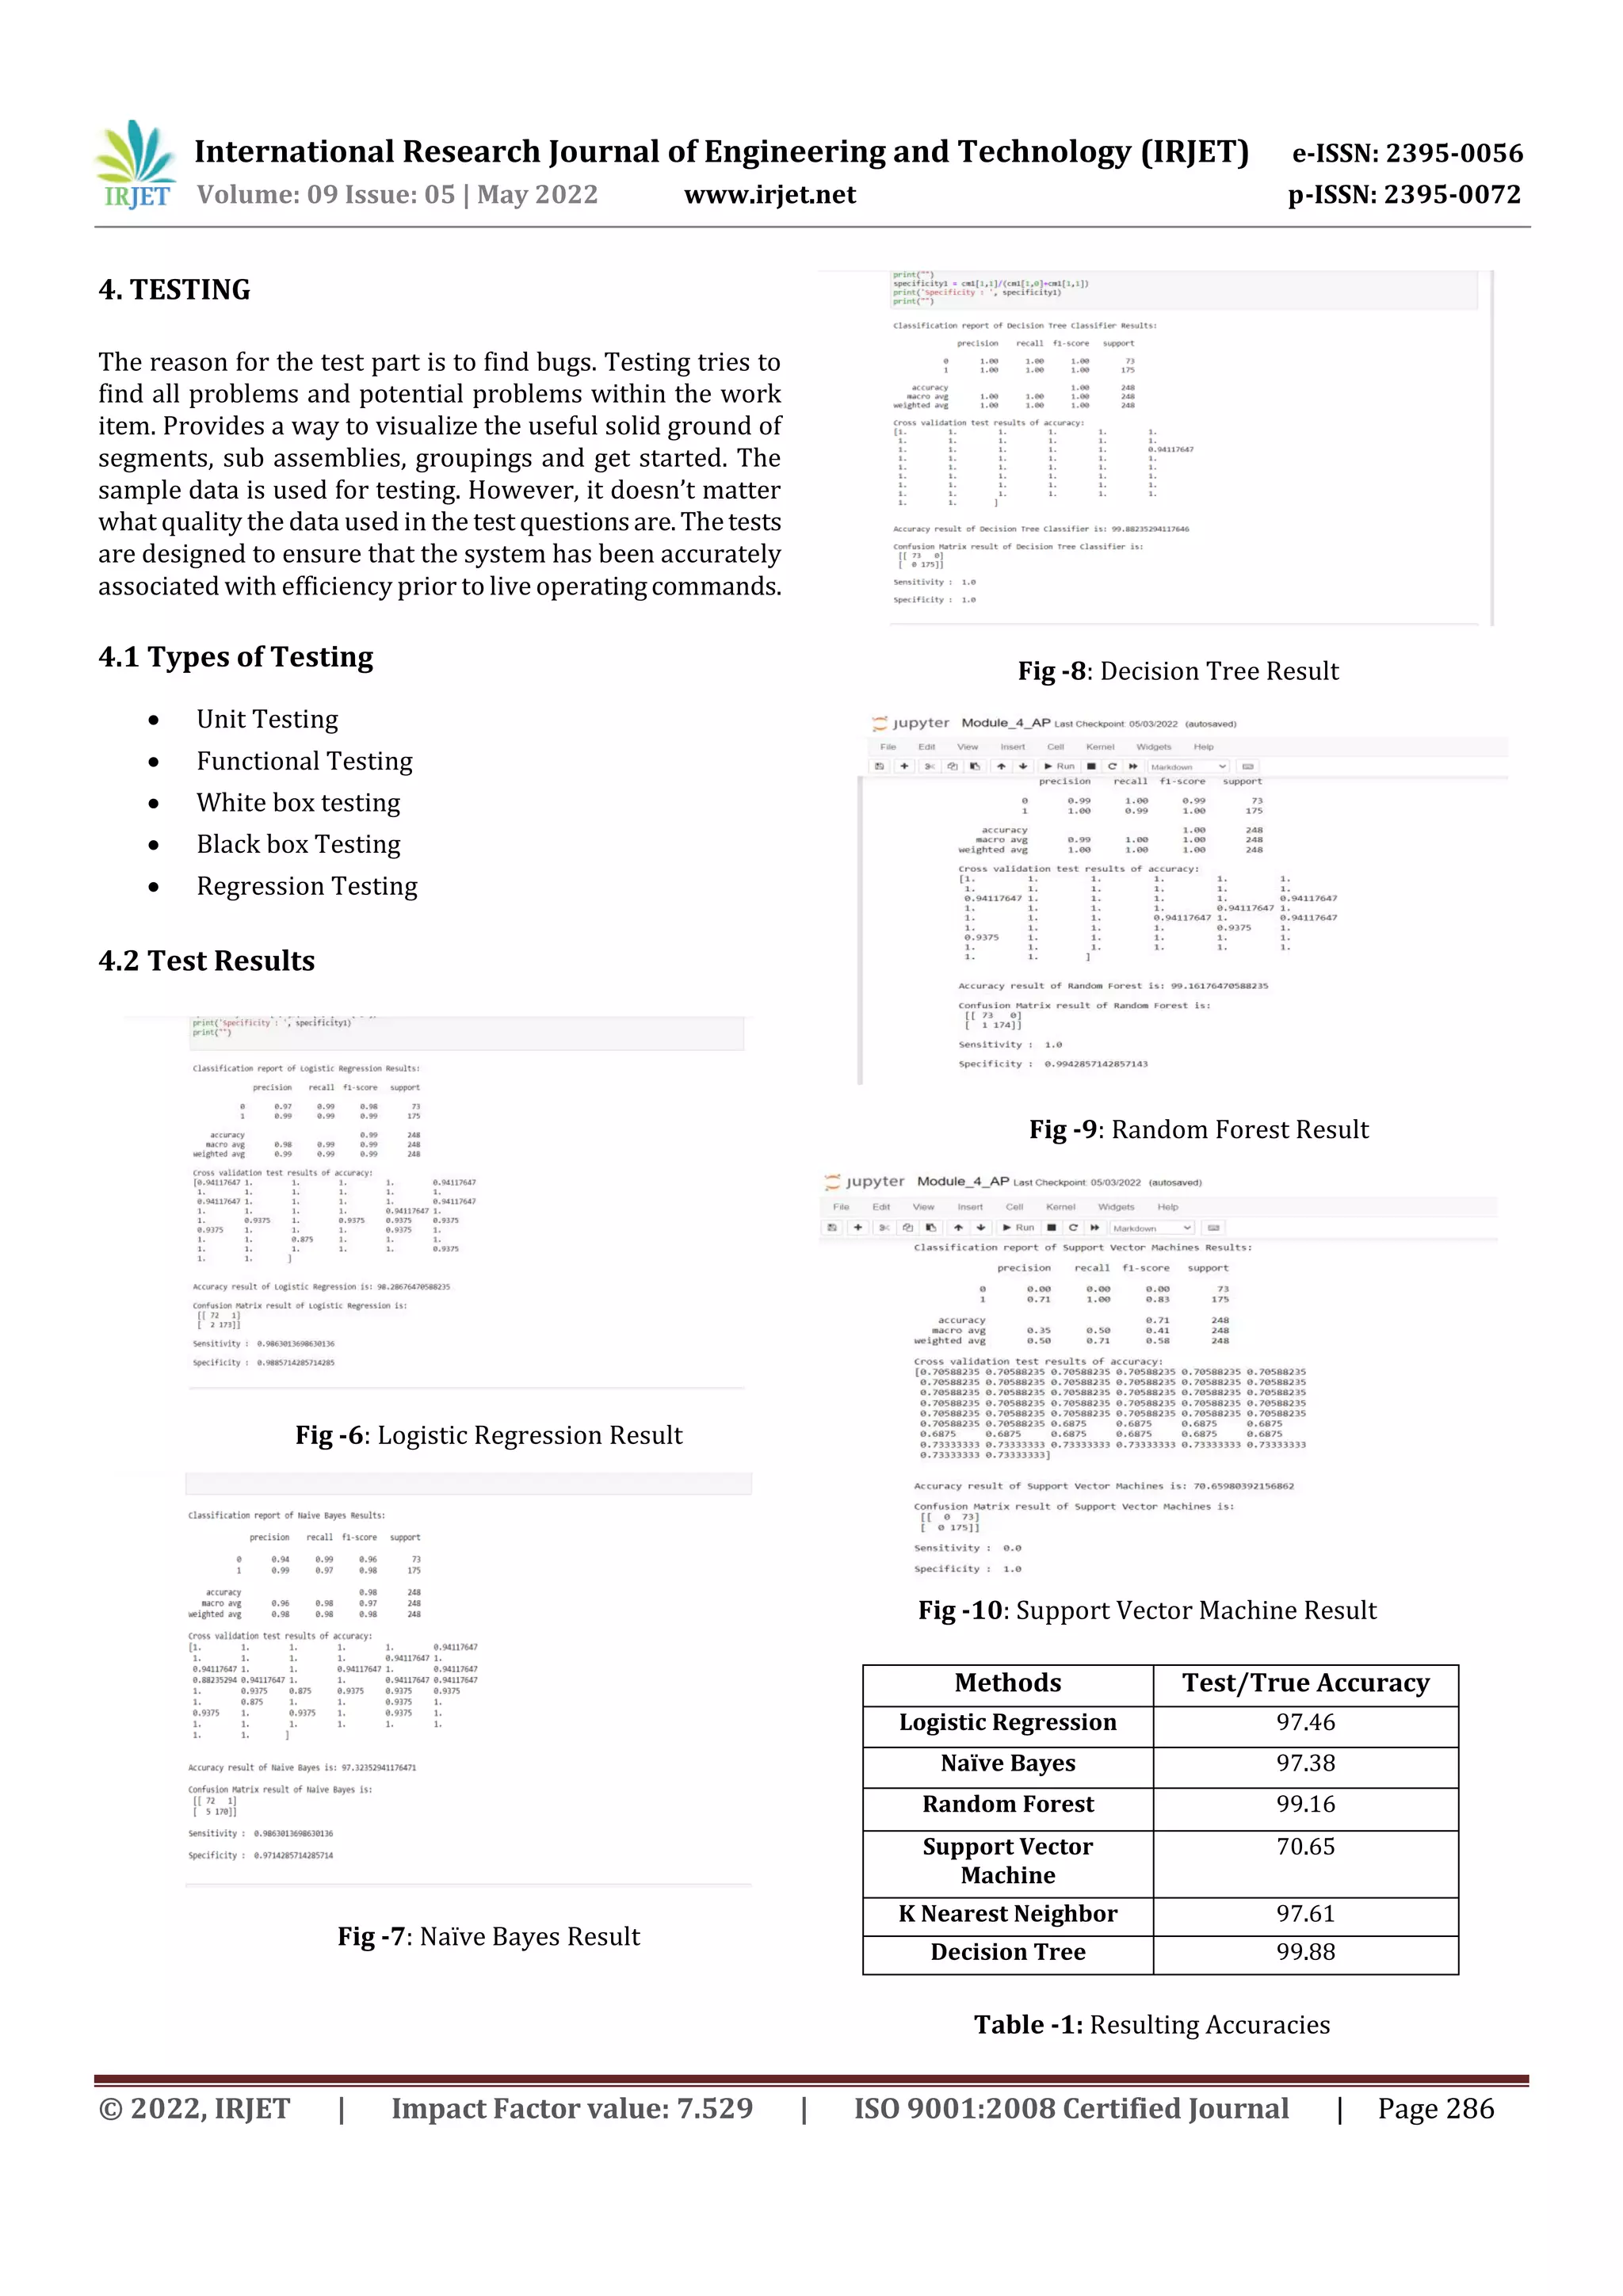
5. RESULTS AND DISCUSSIONS
The development of this novel system is to provide the
higher efficacy in detecting the air quality. By means of this
new system, an individual can have an opportunity toassess
the air quality to gain the knowledge of the air quality in the
location. The designed new system uses the classification
based algorithm for the prediction of air quality. For the
efficacy terms, it is compared with five diverse sets of
classification based algorithms of machine learning such as
Logistic regression, Naive bayes, KNN, Random Forest and
Support Vector Machine. The performance of the proposed
system is at a pinnacle than the rest of thecomparedmodels.
The developed model uses the decision tree to classify the
data, which provide the output of the air quality data by
taking input data. There are different classification
techniques are evolved, since differentalgorithmshave been
developed to work with different sets of data, as there is no
exact method that works on all data set. As stated in
literature works, the goal of classification is to allocate the
new samples to classes by using the pre-labeled samples.
6. CONCLUSION AND FUTURE ENHANCEMENTS
Prevention of air pollution is the need of the hour, so a
influential machinelearning systemwasestablishedwith the
help of prediction model. Prediction of pollution events has
become most important issue in major cities in India due to
the increased expansion ofthepopulationandtheassociated
impact of traffic capacities. Data from a variety of
heterogeneous capitals were used and involved collection
and cleansing for use in machine learning algorithms. The
number of model parameters and optimized outputs were
reduced with help of structure regularization which in turn,
alleviated model complexity. The Decision Tree Algorithm
gave the best results among all the algorithms, with an
overall accuracy of 99.8.
REFERENCES
[1] Acharjya, Debi Prasanna, and Kauser Ahmed (2019), ”A
survey on big data analytics: challenges, open research
issues and tools.” International Journal of Advanced
Computer Science and Applications, vol.7,no.2, pp.511-
518.
[2] A. Gnana Soundari, J. Gnana Jeslin, Akshaya A.C
(2019),”Indian Air Quality Prediction And Analysis
Using Machine Learning”, International Journal of
Computer Applications Technology and Research
,Volume 8,Issue 09, 367-370.
[3] Abed Al Ahad M, Sullivan F, Demsar U, Melhem M, Kulu
H(2020),” The Effect Of Air-pollution And Weather
Exposure On Mortality And Hospital Admission And
Implications For Further Research: A Systematic
Scoping Review”. PLoS ONE 15(10): e0241415.
[4] D. Qin, J. Yu, G. Zou, R. Yong, Q. Zhao and B. Zhang
(2019), ”A Novel Combined PredictionSchemeBasedon
CNN and LSTM for Urban PM2.5 Concentration,”inIEEE
Access, vol.7, pp.20050-20059.
[5] G. Yue, K. Gu and J. Qiao (2019), ”Effective and Efficient
Photo-Based PM2.5 Concentration Estimation,” in IEEE
Transactions on Instrumentation and Measurement,
vol.68, no.10, pp. 3962-3971.
[6] T. Zhang and R. P. Dick (2020), ”Estimation of Multiple
Atmospheric Pollutants Through Image Analysis,” IEEE
International Conference on Image Processing (ICIP),
Taipei, Taiwan, pp. 2060-2064,
doi:10.1109/ICIP.2019.8803130.
[7] S. Y. Muhammad, M. Makhtar, A. Rozaimee,A.Abdul,and
A. A. Jamal (2019), “Classification model for air quality
using machine learning techniques,” International
Journal of Software EngineeringandItsApplications,pp.
45-52.
Many efforts from both local and state administrations are
done in order to understand and predict air quality index
aiming to improve community health. With the progression
of IoT substructures, big data knowledges, and machine
learning techniques, real-time air quality monitor and
evaluation is desirable for upcoming smart cities. In futurea
close working between authorities and also applying them
with MLT background, which may provide boosting in
prediction. This can be achieved by building operational
models that adapt automatically to changes in environment.
Also, more data can be included to increase data seasonality.](https://image.slidesharecdn.com/irjet-v9i5132-220929072123-d178c2a6/75/ENVIRONMENTAL-QUALITY-PREDICTION-AND-ITS-DEPLOYMENT-5-2048.jpg)

This document presents research on using machine learning models to predict environmental quality by analyzing data from environmental sensors. The researchers implemented classification algorithms like decision trees, logistic regression, naive bayes, random forest and support vector machines to predict air quality using metrics like accuracy. They found that the decision tree algorithm achieved the highest accuracy of 99.8% among the other models. The proposed system aims to develop a more effective machine learning model for air quality prediction compared to existing image-based techniques, in order to help monitor pollution levels and protect public health.