Download to read offline


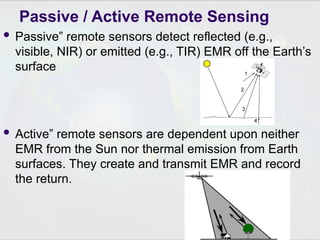
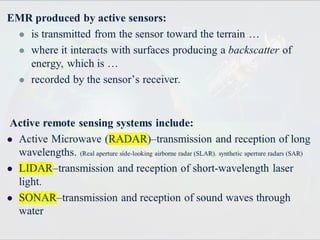


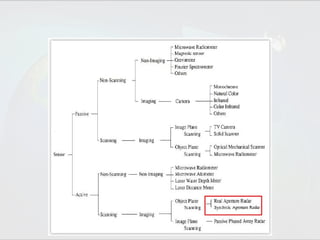
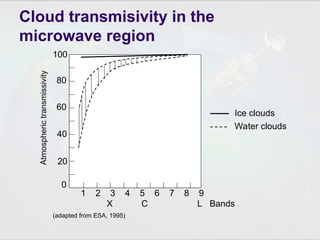
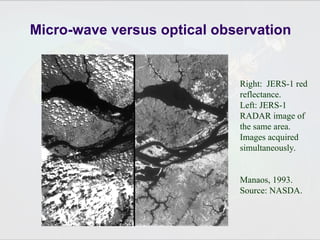
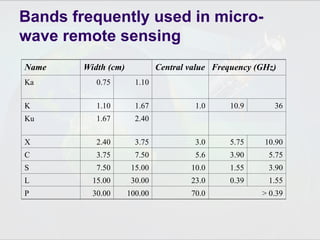
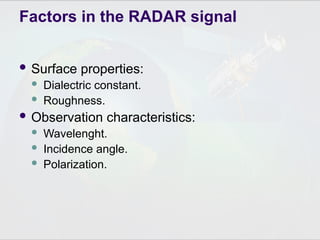
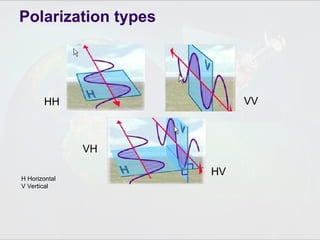
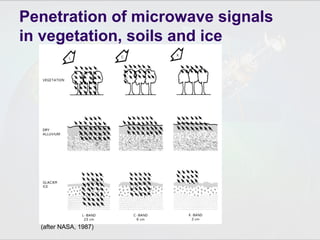

The document introduces radar remote sensing, outlining its components and the differences between passive and active remote sensing. It highlights the advantages of radar, including its ability to penetrate cloud cover, operate at night, and provide insights into surface properties. Additionally, it discusses various factors affecting radar signal and backscatter, including surface characteristics and polarization types.