Download to read offline

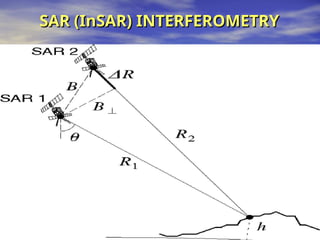
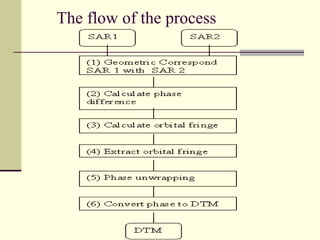
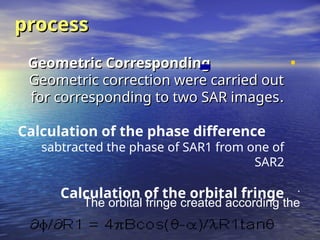

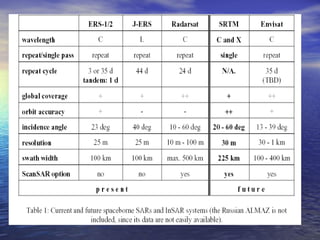


The document discusses Digital Terrain Model (DTM) generation using interferometry, focusing on the techniques and challenges of synthetic aperture radar (InSAR) for generating accurate elevation data. It outlines the importance of phase measurement accuracy, imaging geometry, and wave propagation conditions in determining DTM accuracy, while also addressing potential errors from system noise and atmospheric influences. Various methodologies for calculating phase differences and converting these to elevation values are explored, along with strategies for error assessment in DTM creation.


