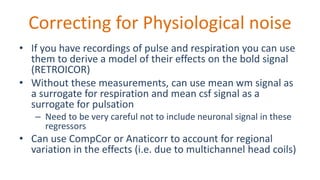
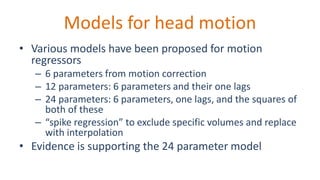
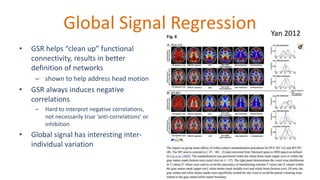
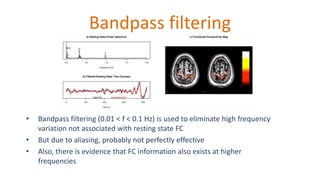
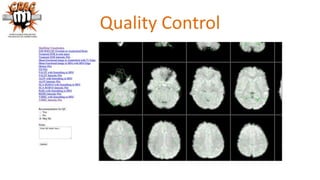
Building Functional
Connectomes
Cameron Craddock, PhD
Computational Neuroimaging Lab
Associate Professor of Diagnostic Medicine
The University of Texas at Austin, Dell Medical School
The Human Connectome
• The sum total of all of the brain’s
connections
– Structural connections: synapses and
fibers
• Diffusion MRI
– Functional connections: synchronized
physiological activity
• Resting state functional MRI
• Nodes are brain areas
• Edges are connections
Craddock et al. Nature Methods, 2013.
Brain Mapping with fMRI
Resting State Functional Connectivity
Biswal et al. MRM 1995
Intrinsic activity is ‘‘ongoing neural and metabolic
activity which is not directly associated with
subjects’ performance of a task’’-Raichle TICS 2010
Todays lecture
“Best practice” r-fMRI preprocessing: 45
minutes
Do your own processing: the remaining time
Configurable Pipeline for the Analysis of
Connectomes (CPAC)
• Pipeline to automate preprocessing and analysis
of large-scale datasets
• Most cutting edge functional connectivity
preprocessing and analysis algorithms
• Configurable to enable “plurality” – evaluate
different processing parameters and strategies
• Automatically identifies and takes advantage of
parallelism on multi-threaded, multi-core, and
cluster architectures
• “Warm restarts” – only re-compute what has
changed
• Open science – open source
• http://fcp-indi.github.io
Nypipe
Forking Example
Raw EPI
Slice time correction
Motion realignment
Friston 24-Parameter
model
Calculate motion
statistics
Calculate mean EPI
Calculate EPI mask
Apply mask to
mean EPI
Apply mask to
realigned EPI
Raw anatomical
Reorient, de-oblique,
and skull-strip
Calculate anatomical
to MNI registration
Anatomical
segmentation
Calculate EPI to
anatomical registration
using BB-reg
Nuisance correction
Warp motion and
nuisnace-corrected EPI to MNI
Band-pass filt er
Warp fil
t
ered , motion
and nuisnace-corrected EPI to MNI
Centrality mask
Calculate network
centrality (no filt er)
Smooth centrality
output (no filt er)
Calculate network
centrality (filt ered)
Smooth centrality
output (filt ered)
Graphical User Interface
Subject Specification
Defining the Pipeline
No consensus on preprocessing
Non-white noise in fMRI: Does modelling have an impact?
Torben E. Lund,a,* Kristoffer H. Madsen,a,b
Karam Sidaros,a
Wen-Lin Luo,c
and Thomas E. Nicholsd
a
Danish Research Centre for Magnetic Resonance, Copenhagen University Hospital, Hvidoure, Kettegaard Alle´ 30, 2650 Hvidovre, Denmark
b
Informatics and Mathematical Modelling, Technical University of Denmark, Lyngby, Denmark
c
Merck & Co., Inc., Whitehouse Station, New Jersey 08889-0100, USA
d
Department of Biostatistics, University of Michigan, Ann Arbor, Michigan 48109-2029, USA
Received 16 December 2004; revised 1 July 2005; accepted 6 July 2005
Available online 11 August 2005
The sources of non-white noise in Blood Oxygenation Level Dependent
(BOLD) functional magnetic resonance imaging (fMRI) are many.
Familiar sources include low-frequency drift due to hardware
imperfections, oscillatory noisedueto respiration and cardiac pulsation
and residual movement artefacts not accounted for by rigid body
registration. These contributions give rise to temporal autocorrelation
in theresidualsof thefMRI signal and invalidate thestatistical analysis
as the errors are no longer independent. The low-frequency drift is
often removed by high-pass filtering, and other effects are typically
modelled as an autoregressive (AR) process. In this paper, we propose
an alternative approach: Nuisance Variable Regression (NVR). By
identically normally distributed (i.i.d.), thisobservation isimportant
and hashad largeimpact on paradigm design and dataanalyses.
With non-white noise, the i.i.d. assumption is no longer
fulfilled, and if this is ignored, the estimated standard deviations
will typically be negatively biased, resulting in invalid (liberal)
statistical inferences. Another consequence is the difficulty in
detecting signals when covered in noise. As we are normally
interested in the GM signal, it is problematic that this is the region
where structured noise is most pronounced. With physiological
noise increasing with field strength (Kru¨ger and Glover, 2001;
www.elsevier.com/locate/ynimg
NeuroImage 29 (2006) 54 – 66
e noise in fMRI: Does modelling have an impact?
nd,a,* Kristoffer H. Madsen,a,b
Karam Sidaros,a
c
and Thomas E. Nicholsd
tre for Magnetic Resonance, Copenhagen University Hospital, Hvidoure, Kettegaard Alle´ 30, 2650 Hvidovre, Denmark
ematical Modelling, Technical University of Denmark, Lyngby, Denmark
hitehouse Station, New Jersey 08889-0100, USA
istics, University of Michigan, Ann Arbor, Michigan 48109-2029, USA
r 2004; revised 1 July 2005; accepted 6 July 2005
ugust 2005
hite noisein Blood Oxygenation Level Dependent
magnetic resonance imaging (fMRI) are many.
clude low-frequency drift due to hardware
identically normally distributed (i.i.d.), thisobservation isimportant
andhashadlargeimpact onparadigmdesignanddataanalyses.
www.elsevier.com/locate/ynimg
NeuroImage 29 (2006) 54 – 66
A component based noise correction method (CompCor) for BOLD
and perfusion based fMRI
Yashar Behzadi,a,b
Khaled Restom,a
Joy Liau,a,b
and Thomas T. Liua,⁎
a
UCSD Center for Functional Magnetic Resonance Imaging and Department of Radiology, 9500 Gilman Drive, MC 0677, La Jolla, CA 92093-0677, USA
b
Department of Bioengineering, University of California San Diego, La Jolla, CA, USA
Received 18 December 2006; revised 23 April 2007; accepted 25 April 2007
Available online 3 May 2007
A component based method (CompCor) for the reduction of noise in
both blood oxygenation level-dependent (BOLD) and perfusion-
based functional magnetic resonance imaging (fMRI) data is
presented. In the proposed method, significant principal components
are derived from noise regions-of-inter est (ROI) in which the time
series data are unlikely to be modulated by neural activity. These
components are then included as nuisance parameters within general
linear models for BOLD and perfusion-based fMRI time series data.
Two approaches for the determination of the noise ROI are
neurovascular coupling mechanisms (Hoge et al., 1999). However,
as the fMRI community has moved to higher field strengths,
physiological noise has become an increasingly important
confound limiting the sensitivity and the application of fMRI
studies (Kruger and Glover, 2001; Liu et al., 2006).
Physiological fluctuations have been shown to be a significant
source of noise in BOLD fMRI experiments, with an even greater
effect in perfusion-based fMRI utilizing arterial spin labeling
www.elsevier.com/locate/ynimg
NeuroImage 37 (2007) 90– 101
This is particularly complicated for “post-hoc” aggregated datasets
Anatomical Processing
• Information from
structural MRI images
are required for:
– Warping images into a
common space
– Calculating tissue maps
for data cleaning
operations
Anatomical Pipeline
sMRI
Skull StrippingsMRI Template
Calculate sMRI->Template
Linear Transform
WM Template
Calculate WM Mask
LV Template
Calculate CSF Mask
Image Segmentation
Calculate sMRI->Template
Non-linear Warp
Skullstripping
• Remove “non-brain” tissue from
the image that may interfere with
spatial normalization and
segmentation
– When skull-stripping is good, it can
substantially improve the quality of
alignment
– When it is bad, it will substantially
degrade the quality of alignment to
worse that what is obtainable with
skull-on
– No “silver bullet” that seems to
work robustly for all datasets
Spatial Normalization
• Quality of alignment
between resultant images
are determined by:
– Algorithm
– Quality of the template
– Initial starting orientation
of the individual images
Optimizing Spatial Normalization
• Choose a template based on
your population – there are
a variety of templates for
different age groups
• Consider a lower resolution
template to reduce
processing time and
memory requirements
– 2mm for fMRI
– 1mm for VBM
fNIRT ANTs
DPARSF 3dQWarp
Segmentation
• Calculate tissue specific masks for sMRI – fMRI
co-registration and extracting nuisance
regressors (WM and CSF) for denoising
Functional Preprocessing
1. Distortion correction
2. Drop first N TRs
3. Slice timing correction
4. Motion coregistration
5. Calculate EPI-T1 transform
6. Nuisance Variable Regression
7. Bandpass filter
8. Calculate derivative (fc map)
9. Copy into template space
10. Spatial Smoothing
Distortion Correction
• Echo-planar imaging can produce
large geometric image distortions
near areas of high magnetic
susceptibility (air/tissue interfaces)
• This can be mathematically corrected
using information from field maps
and blip up/down acquisitions
• In practice results are fairly subtle
https://fsl.fmrib.ox.ac.uk/fslcourse/lectures/reg.pdf
Discarding the first few scans
• First few TRs have different
signal profile than the
remainder
• This may have been
automatically discarded by
the scanner, if not discard
before analysis
• The number of frames to
discard is determined by the
flip angle
Slice Timing Correction
• Slices of an fMRI volume are
acquired at different times,
resulting in delays between BOLD
time courses from different parts
of the brain
• Corrected by interpolating time
points to the same sampling grid
• Interacts with head motion
correction
• May not be needed for low-TR
sequences or if bandpass filtering
Motion Co-registration
• Motion that occurs
between the acquisitions of
fMRI volumes can be
corrected by co-registration
• Motion that occurs
between slices in an volume
cannot be accounted for so
easily
– Maybe drop the frames and
replaces with interpolation??
Motion induced intensity modulations
• Head motion also induces
variations in the fMRI signal
– Spin-history effects
– Partial voluming
• Can be excluded by scrubbing
(deleting volumes and
interpolating) motion peaks
• Or including head motion in
the nuisance regression
(discussed later)
EPI – T1 Transform
• To calculate an EPI – MNI space transform,
the data are first co-registered to the T1
and the resulting transform is combined
with the T1-MNI transform
• Boundary based registration relies on
information from the white – grey matter
boundary for a better alignment
• Requires good WM segmentation
• Also requires good contrast in EPI
volumes, may make registration worse for
images with poor contrast (multiband
data?)
Nuisance Variable Regression
• fMRI signal is a combination of neuronal signal, cardiac
pulse, respiration, motion induced variations, scanner
drifts, and other noise sources
• Can fit a regression model to estimate the contributions of
the nuisance signals and subtract them out
• The quality of the denoising is dependent on the quality of
models of the various components
Cardiac and Respiration
• Cardiac pulsation induces
micro-movements in the brain
• Variations in abdominal
oxygen content due to
breathing causes variations in
the magnetic field that create
global intensity variations
• Long term changes in depth
and rate of breathing change
brain oxygenation level and
can effect BOLD response
Correcting for Physiological noise
• If you have recordings of pulse and respiration you can use
them to derive a model of their effects on the bold signal
(RETROICOR)
• Without these measurements, can use mean wm signal as
a surrogate for respiration and mean csf signal as a
surrogate for pulsation
– Need to be very careful not to include neuronal signal in these
regressors
• Can use CompCor or Anaticorr to account for regional
variation in the effects (i.e. due to multichannel head coils)
Models for head motion
• Various models have been proposed for motion
regressors
– 6 parameters from motion correction
– 12 parameters: 6 parameters and their one lags
– 24 parameters: 6 parameters, one lags, and the squares of
both of these
– “spike regression” to exclude specific volumes and replace
with interpolation
• Evidence is supporting the 24 parameter model
Global Signal Regression
• GSR helps “clean up” functional
connectivity, results in better
definition of networks
– shown to help address head motion
• GSR always induces negative
correlations
– Hard to interpret negative correlations,
not necessarily true ‘anti-correlations’ or
inhibition
• Global signal has interesting inter-
individual variation
Yan 2012
Bandpass filtering
• Bandpass filtering (0.01 < f < 0.1 Hz) is used to eliminate high frequency
variation not associated with resting state FC
• But due to aliasing, probably not perfectly effective
• Also, there is evidence that FC information also exists at higher
frequencies
A variety of analyses
Derivatives
• Seed-based correlation – multiple regression
• Time series extraction – eigen or mean, many atlases pre-loaded
• ALFF/fALFF
• Regional homogeneity
• Voxel-mirrored homotopic connectivity
• Network centrality (degree, eign, lfcd) – optimized for efficiency
• Dual regression
• Bootstrap analysis of stable clusters
• Group-level analyses (ANOVA/ANCOVA)
• Multivariate Distance Matrix Regression
Copy to MNI space and smooth
• To reduce the amount of “blob spread” due to spatial
smoothing, results are written into MNI space after
derivative calculation
– iFC, dual regression, ReHo, f/alff
• Other derivatives are calculated in MNI space
– Centrality, VMHC
• Smoothing is employed to improve SNR, correspondence
between individuals, and to make the data more consistent
with group-level modeling assumptions
Standardizing results
Quality Control
Open resources for connectomes
research
Introduction to resting state fMRI preprocessing and analysis

Introduction to resting state fMRI preprocessing and analysis

  • 2.
    Building Functional Connectomes Cameron Craddock,PhD Computational Neuroimaging Lab Associate Professor of Diagnostic Medicine The University of Texas at Austin, Dell Medical School
  • 3.
    The Human Connectome •The sum total of all of the brain’s connections – Structural connections: synapses and fibers • Diffusion MRI – Functional connections: synchronized physiological activity • Resting state functional MRI • Nodes are brain areas • Edges are connections Craddock et al. Nature Methods, 2013.
  • 4.
  • 5.
    Resting State FunctionalConnectivity Biswal et al. MRM 1995 Intrinsic activity is ‘‘ongoing neural and metabolic activity which is not directly associated with subjects’ performance of a task’’-Raichle TICS 2010
  • 6.
    Todays lecture “Best practice”r-fMRI preprocessing: 45 minutes Do your own processing: the remaining time
  • 7.
    Configurable Pipeline forthe Analysis of Connectomes (CPAC) • Pipeline to automate preprocessing and analysis of large-scale datasets • Most cutting edge functional connectivity preprocessing and analysis algorithms • Configurable to enable “plurality” – evaluate different processing parameters and strategies • Automatically identifies and takes advantage of parallelism on multi-threaded, multi-core, and cluster architectures • “Warm restarts” – only re-compute what has changed • Open science – open source • http://fcp-indi.github.io Nypipe
  • 8.
    Forking Example Raw EPI Slicetime correction Motion realignment Friston 24-Parameter model Calculate motion statistics Calculate mean EPI Calculate EPI mask Apply mask to mean EPI Apply mask to realigned EPI Raw anatomical Reorient, de-oblique, and skull-strip Calculate anatomical to MNI registration Anatomical segmentation Calculate EPI to anatomical registration using BB-reg Nuisance correction Warp motion and nuisnace-corrected EPI to MNI Band-pass filt er Warp fil t ered , motion and nuisnace-corrected EPI to MNI Centrality mask Calculate network centrality (no filt er) Smooth centrality output (no filt er) Calculate network centrality (filt ered) Smooth centrality output (filt ered)
  • 9.
  • 10.
  • 11.
  • 12.
    No consensus onpreprocessing Non-white noise in fMRI: Does modelling have an impact? Torben E. Lund,a,* Kristoffer H. Madsen,a,b Karam Sidaros,a Wen-Lin Luo,c and Thomas E. Nicholsd a Danish Research Centre for Magnetic Resonance, Copenhagen University Hospital, Hvidoure, Kettegaard Alle´ 30, 2650 Hvidovre, Denmark b Informatics and Mathematical Modelling, Technical University of Denmark, Lyngby, Denmark c Merck & Co., Inc., Whitehouse Station, New Jersey 08889-0100, USA d Department of Biostatistics, University of Michigan, Ann Arbor, Michigan 48109-2029, USA Received 16 December 2004; revised 1 July 2005; accepted 6 July 2005 Available online 11 August 2005 The sources of non-white noise in Blood Oxygenation Level Dependent (BOLD) functional magnetic resonance imaging (fMRI) are many. Familiar sources include low-frequency drift due to hardware imperfections, oscillatory noisedueto respiration and cardiac pulsation and residual movement artefacts not accounted for by rigid body registration. These contributions give rise to temporal autocorrelation in theresidualsof thefMRI signal and invalidate thestatistical analysis as the errors are no longer independent. The low-frequency drift is often removed by high-pass filtering, and other effects are typically modelled as an autoregressive (AR) process. In this paper, we propose an alternative approach: Nuisance Variable Regression (NVR). By identically normally distributed (i.i.d.), thisobservation isimportant and hashad largeimpact on paradigm design and dataanalyses. With non-white noise, the i.i.d. assumption is no longer fulfilled, and if this is ignored, the estimated standard deviations will typically be negatively biased, resulting in invalid (liberal) statistical inferences. Another consequence is the difficulty in detecting signals when covered in noise. As we are normally interested in the GM signal, it is problematic that this is the region where structured noise is most pronounced. With physiological noise increasing with field strength (Kru¨ger and Glover, 2001; www.elsevier.com/locate/ynimg NeuroImage 29 (2006) 54 – 66 e noise in fMRI: Does modelling have an impact? nd,a,* Kristoffer H. Madsen,a,b Karam Sidaros,a c and Thomas E. Nicholsd tre for Magnetic Resonance, Copenhagen University Hospital, Hvidoure, Kettegaard Alle´ 30, 2650 Hvidovre, Denmark ematical Modelling, Technical University of Denmark, Lyngby, Denmark hitehouse Station, New Jersey 08889-0100, USA istics, University of Michigan, Ann Arbor, Michigan 48109-2029, USA r 2004; revised 1 July 2005; accepted 6 July 2005 ugust 2005 hite noisein Blood Oxygenation Level Dependent magnetic resonance imaging (fMRI) are many. clude low-frequency drift due to hardware identically normally distributed (i.i.d.), thisobservation isimportant andhashadlargeimpact onparadigmdesignanddataanalyses. www.elsevier.com/locate/ynimg NeuroImage 29 (2006) 54 – 66 A component based noise correction method (CompCor) for BOLD and perfusion based fMRI Yashar Behzadi,a,b Khaled Restom,a Joy Liau,a,b and Thomas T. Liua,⁎ a UCSD Center for Functional Magnetic Resonance Imaging and Department of Radiology, 9500 Gilman Drive, MC 0677, La Jolla, CA 92093-0677, USA b Department of Bioengineering, University of California San Diego, La Jolla, CA, USA Received 18 December 2006; revised 23 April 2007; accepted 25 April 2007 Available online 3 May 2007 A component based method (CompCor) for the reduction of noise in both blood oxygenation level-dependent (BOLD) and perfusion- based functional magnetic resonance imaging (fMRI) data is presented. In the proposed method, significant principal components are derived from noise regions-of-inter est (ROI) in which the time series data are unlikely to be modulated by neural activity. These components are then included as nuisance parameters within general linear models for BOLD and perfusion-based fMRI time series data. Two approaches for the determination of the noise ROI are neurovascular coupling mechanisms (Hoge et al., 1999). However, as the fMRI community has moved to higher field strengths, physiological noise has become an increasingly important confound limiting the sensitivity and the application of fMRI studies (Kruger and Glover, 2001; Liu et al., 2006). Physiological fluctuations have been shown to be a significant source of noise in BOLD fMRI experiments, with an even greater effect in perfusion-based fMRI utilizing arterial spin labeling www.elsevier.com/locate/ynimg NeuroImage 37 (2007) 90– 101 This is particularly complicated for “post-hoc” aggregated datasets
  • 13.
    Anatomical Processing • Informationfrom structural MRI images are required for: – Warping images into a common space – Calculating tissue maps for data cleaning operations
  • 14.
    Anatomical Pipeline sMRI Skull StrippingsMRITemplate Calculate sMRI->Template Linear Transform WM Template Calculate WM Mask LV Template Calculate CSF Mask Image Segmentation Calculate sMRI->Template Non-linear Warp
  • 15.
    Skullstripping • Remove “non-brain”tissue from the image that may interfere with spatial normalization and segmentation – When skull-stripping is good, it can substantially improve the quality of alignment – When it is bad, it will substantially degrade the quality of alignment to worse that what is obtainable with skull-on – No “silver bullet” that seems to work robustly for all datasets
  • 16.
    Spatial Normalization • Qualityof alignment between resultant images are determined by: – Algorithm – Quality of the template – Initial starting orientation of the individual images
  • 17.
    Optimizing Spatial Normalization •Choose a template based on your population – there are a variety of templates for different age groups • Consider a lower resolution template to reduce processing time and memory requirements – 2mm for fMRI – 1mm for VBM fNIRT ANTs DPARSF 3dQWarp
  • 18.
    Segmentation • Calculate tissuespecific masks for sMRI – fMRI co-registration and extracting nuisance regressors (WM and CSF) for denoising
  • 19.
    Functional Preprocessing 1. Distortioncorrection 2. Drop first N TRs 3. Slice timing correction 4. Motion coregistration 5. Calculate EPI-T1 transform 6. Nuisance Variable Regression 7. Bandpass filter 8. Calculate derivative (fc map) 9. Copy into template space 10. Spatial Smoothing
  • 20.
    Distortion Correction • Echo-planarimaging can produce large geometric image distortions near areas of high magnetic susceptibility (air/tissue interfaces) • This can be mathematically corrected using information from field maps and blip up/down acquisitions • In practice results are fairly subtle https://fsl.fmrib.ox.ac.uk/fslcourse/lectures/reg.pdf
  • 21.
    Discarding the firstfew scans • First few TRs have different signal profile than the remainder • This may have been automatically discarded by the scanner, if not discard before analysis • The number of frames to discard is determined by the flip angle
  • 22.
    Slice Timing Correction •Slices of an fMRI volume are acquired at different times, resulting in delays between BOLD time courses from different parts of the brain • Corrected by interpolating time points to the same sampling grid • Interacts with head motion correction • May not be needed for low-TR sequences or if bandpass filtering
  • 23.
    Motion Co-registration • Motionthat occurs between the acquisitions of fMRI volumes can be corrected by co-registration • Motion that occurs between slices in an volume cannot be accounted for so easily – Maybe drop the frames and replaces with interpolation??
  • 24.
    Motion induced intensitymodulations • Head motion also induces variations in the fMRI signal – Spin-history effects – Partial voluming • Can be excluded by scrubbing (deleting volumes and interpolating) motion peaks • Or including head motion in the nuisance regression (discussed later)
  • 25.
    EPI – T1Transform • To calculate an EPI – MNI space transform, the data are first co-registered to the T1 and the resulting transform is combined with the T1-MNI transform • Boundary based registration relies on information from the white – grey matter boundary for a better alignment • Requires good WM segmentation • Also requires good contrast in EPI volumes, may make registration worse for images with poor contrast (multiband data?)
  • 26.
    Nuisance Variable Regression •fMRI signal is a combination of neuronal signal, cardiac pulse, respiration, motion induced variations, scanner drifts, and other noise sources • Can fit a regression model to estimate the contributions of the nuisance signals and subtract them out • The quality of the denoising is dependent on the quality of models of the various components
  • 27.
    Cardiac and Respiration •Cardiac pulsation induces micro-movements in the brain • Variations in abdominal oxygen content due to breathing causes variations in the magnetic field that create global intensity variations • Long term changes in depth and rate of breathing change brain oxygenation level and can effect BOLD response
  • 28.
    Correcting for Physiologicalnoise • If you have recordings of pulse and respiration you can use them to derive a model of their effects on the bold signal (RETROICOR) • Without these measurements, can use mean wm signal as a surrogate for respiration and mean csf signal as a surrogate for pulsation – Need to be very careful not to include neuronal signal in these regressors • Can use CompCor or Anaticorr to account for regional variation in the effects (i.e. due to multichannel head coils)
  • 29.
    Models for headmotion • Various models have been proposed for motion regressors – 6 parameters from motion correction – 12 parameters: 6 parameters and their one lags – 24 parameters: 6 parameters, one lags, and the squares of both of these – “spike regression” to exclude specific volumes and replace with interpolation • Evidence is supporting the 24 parameter model
  • 30.
    Global Signal Regression •GSR helps “clean up” functional connectivity, results in better definition of networks – shown to help address head motion • GSR always induces negative correlations – Hard to interpret negative correlations, not necessarily true ‘anti-correlations’ or inhibition • Global signal has interesting inter- individual variation Yan 2012
  • 31.
    Bandpass filtering • Bandpassfiltering (0.01 < f < 0.1 Hz) is used to eliminate high frequency variation not associated with resting state FC • But due to aliasing, probably not perfectly effective • Also, there is evidence that FC information also exists at higher frequencies
  • 32.
    A variety ofanalyses
  • 33.
    Derivatives • Seed-based correlation– multiple regression • Time series extraction – eigen or mean, many atlases pre-loaded • ALFF/fALFF • Regional homogeneity • Voxel-mirrored homotopic connectivity • Network centrality (degree, eign, lfcd) – optimized for efficiency • Dual regression • Bootstrap analysis of stable clusters • Group-level analyses (ANOVA/ANCOVA) • Multivariate Distance Matrix Regression
  • 34.
    Copy to MNIspace and smooth • To reduce the amount of “blob spread” due to spatial smoothing, results are written into MNI space after derivative calculation – iFC, dual regression, ReHo, f/alff • Other derivatives are calculated in MNI space – Centrality, VMHC • Smoothing is employed to improve SNR, correspondence between individuals, and to make the data more consistent with group-level modeling assumptions
  • 35.
  • 36.
  • 37.
    Open resources forconnectomes research