Download to read offline


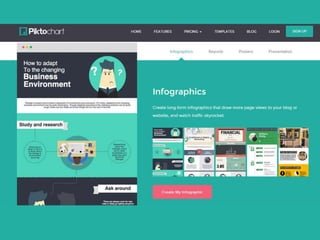


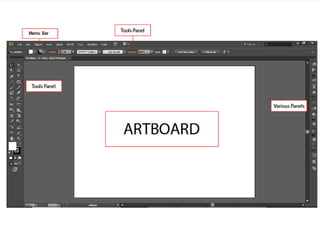
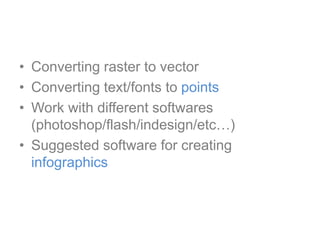


This document discusses how to create infographics using Adobe Illustrator. It defines infographics as visual representations of information designed to convey data quickly. Illustrator is recommended for infographic design because it allows for smaller file sizes, faster loading times, and effective data visualization through vector graphics that can be scaled without quality loss. The document outlines Illustrator's vector tools and environment which empower designers to convert raster images and text to editable vector points for customization across programs like Photoshop and InDesign, making it a powerful and versatile software for infographic creation.


![5G Explained! A High Level Overview [Introduction]](https://cdn.slidesharecdn.com/ss_thumbnails/5gexplainedahighleveloverview-260119165306-cc137a3e-thumbnail.jpg?width=640&height=640&fit=bounds)


