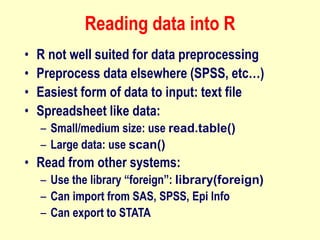
R is a free software environment for statistical analysis and graphics. It allows importing, cleaning, analyzing, and visualizing data. Key features include its ability to handle many types of data, produce high-quality graphs, and implement a wide variety of statistical techniques like regression. R has a steep learning curve but a strong user community and implements advanced statistical methods. It can effectively store, manipulate, and summarize data.

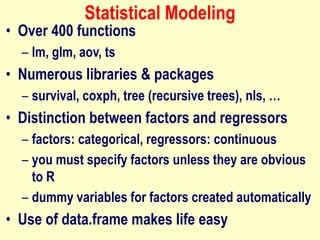
![Accessing Variables
• edit(<mydataobject>)
• Subscripts essential tools
– x[1] identifies first element in vector x
– y[1,] identifies first row in matrix y
– y[,1] identifies first column in matrix y
• $ sign for lists and data frames
– myframe$age gets age variable of myframe
– attach(dataframe) -> extract by variable name](https://image.slidesharecdn.com/17641-231015173043-c246df39/85/17641-ppt-18-320.jpg)
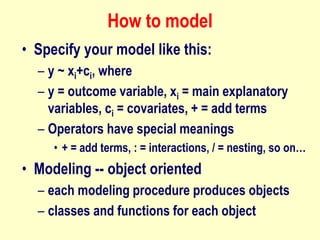
![Subset Data
• Using subset function
– subset() will subset the dataframe
• Subscripting from data frames
– myframe[,1] gives first column of myframe
• Specifying a vector
– myframe[1:5] gives first 5 rows of data
• Using logical expressions
– myframe[myframe[,1], < 5,] gets all rows of the
first column that contain values less than 5](https://image.slidesharecdn.com/17641-231015173043-c246df39/85/17641-ppt-19-320.jpg)
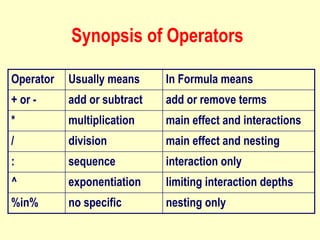
![Multivariate Techniques
• Several Libraries available
– mva, hmisc, glm,
– MASS: discriminant analysis and multidim
scaling
• Econometrics packages
– dse (multivariate time series, state-space
models), ineq: for measuring inequality, poverty
estimation, its: for irregular time series, sem:
structural equation modeling, and so on…
[http://www.mayin.org/ajayshah/]](https://image.slidesharecdn.com/17641-231015173043-c246df39/85/17641-ppt-30-320.jpg)