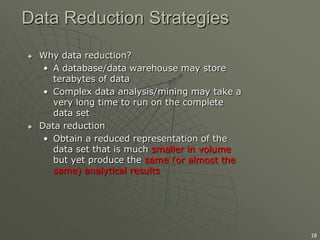
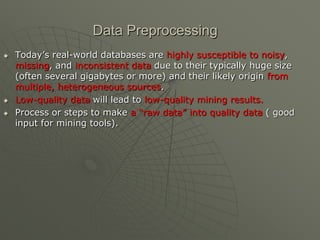
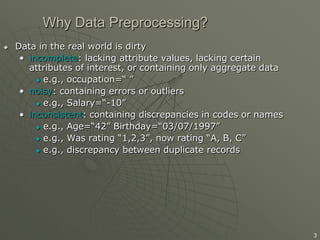
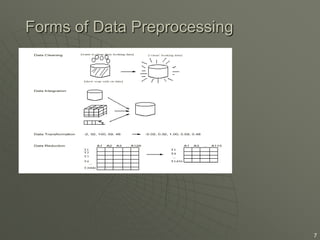
Data Preprocessing

1
Data Preprocessing





Today’s real-world databases are highly susceptible to noisy,
missing, and inconsistent data due to their typically huge size
(often several gigabytes or more) and their likely origin from
multiple, heterogeneous sources.
Low-quality data will lead to low-quality mining results.
Process or steps to make a “raw data” into quality data ( good
input for mining tools).
Why Data Preprocessing?


Data in the real world is dirty
• incomplete: lacking attribute values, lacking certain
attributes of interest, or containing only aggregate data
 e.g., occupation=“ ”
• noisy: containing errors or outliers
 e.g., Salary=“-10”
• inconsistent: containing discrepancies in codes or names
 e.g., Age=“42” Birthday=“03/07/1997”
 e.g., Was rating “1,2,3”, now rating “A, B, C”
 e.g., discrepancy between duplicate records

3
Why Is Data Preprocessing
Important?


No quality data, no quality mining results!
• Quality decisions must be based on quality data


e.g., duplicate or missing data may cause incorrect or even
misleading statistics.

• Data warehouse needs consistent integration of quality data


Data extraction, cleaning, and transformation involves the majority
of the work of building a data warehouse (90%).

4
DATA PROBLEMS
Major Tasks in Data
Preprocessing










Data cleaning
• Fill in missing values, smooth noisy data, identify or remove
outliers, and resolve inconsistencies
Data integration
• Integration of multiple databases, data cubes, or files
Data transformation
• Normalization and aggregation
Data reduction
• Obtains reduced representation in volume but produces the
same or similar analytical results
Data discretization
• Part of data reduction but with particular importance, especially
for numerical data

6
Forms of Data Preprocessing

7
Data Cleaning




Importance
• “Data cleaning is the number one problem in data
warehousing”—DCI survey
Data cleaning tasks
• Fill in missing values
• Identify outliers and smooth out noisy data

• Correct inconsistent data
• Resolve redundancy caused by data integration

8
Noisy Data



Noise: random error or variance in a measured variable
Incorrect attribute values may due to
• faulty data collection instruments
• data entry problems
• data transmission problems

9
Conti….





Noise: random error or variance in a measured variable
Incorrect attribute values may due to
• faulty data collection instruments
• data entry problems
• data transmission problems
• technology limitation
• inconsistency in naming convention
Other data problems which requires data cleaning
• duplicate records
• incomplete data
• inconsistent data

10
How to Handle Noisy Data?


Binning

• first sort data and partition into (equal-frequency)
bins
• then one can smooth by bin means, smooth by bin
median, smooth by bin boundaries, etc.



Regression

• smooth by fitting the data into regression functions



Clustering

• detect and remove outliers



Combined computer and human inspection

• detect suspicious values and check by human (e.g.,
deal with possible outliers)

11
Cluster Analysis

12
Data Integration


Data integration:

• Combines data from multiple sources into a coherent
store





Schema integration: Integrate metadata from
different sources

Entity identification problem:

• Identify real world entities from multiple data
sources, e.g., Bill Clinton = William Clinton
• metadata can be used to help avoid errors in schema
integration



Detecting and resolving data value conflicts

• For the same real world entity, attribute values
from different sources are different
• Possible reasons: different
representations, different scales, e.g., Kg vs.
Pound

13
Handling Redundancy in Data Integration


Redundant data occur often when integration of
multiple databases
• Object identification: The same attribute or
object may have different names in
different databases
• Derivable data: One attribute may be a
“derived” attribute in another table, e.g.,
annual revenue





Redundant attributes may be able to be
detected by correlation analysis

Careful integration of the data from multiple
sources may help reduce/avoid redundancies
and inconsistencies and improve mining speed
and quality

14
Descriptive Data Summarization










For data preprocessing to be successful, you have an
overall picture of your data.
It can be used to identify the typical properties of your
data and highlight which data values should be treated
as noise or outliers.
Measures of central tendency include
mean, median, mode, and midrange
Midrange : It is the average of the largest and smallest
values in the set.
measures of data dispersion include
quartiles, interquartile range (IQR), and variance.

March 6, 2014

15
Data Transformation


Smoothing: remove noise from data(binning,
regression, and clustering)



Aggregation: summarization, data cube construction



Generalization: concept hierarchy climbing



Normalization: scaled to fall within a small, specified
range
• min-max normalization

• z-score normalization
• normalization by decimal scaling


Attribute/feature construction
• New attributes constructed from the given ones

16
Min-max normalization
Suppose that min_A and max_A are the minimum
and maximum values of an attribute A.
Min-max normalization maps a value v of A to v’ in
the range [new_min_A, new_max_A]

March 6, 2014

17
Data Reduction Strategies




Why data reduction?
• A database/data warehouse may store
terabytes of data
• Complex data analysis/mining may take a
very long time to run on the complete
data set
Data reduction
• Obtain a reduced representation of the
data set that is much smaller in volume
but yet produce the same (or almost the
same) analytical results

18
Data Reduction










1. Data cube aggregation, where aggregation operations are
applied to the data in the construction of a data cube.
2. Attribute subset selection, where irrelevant, weakly
relevant, or redundant attributes or dimensions may be detected
and removed.
3. Dimensionality reduction, where encoding mechanisms are
used to reduce the data set size.
Numerosity reduction: where the data are replaced or
estimated by alternative, smaller data representations
4. Discretization and concept hierarchy generation, where
raw data values for attributes are replaced by ranges or higher
conceptual levels.
• Data discretization is a form of multiplicity reduction that is
very useful for the automatic generation of concept
hierarchies.
• Discretization and concept hierarchy generation are powerful
tools for data mining, in that they allow the mining of data at
multiple levels of abstraction.

19
Data Cube Aggregation

March 6, 2014

20
Cluster Analysis


Clustering can be used to generate a
concept hierarchy for A by following
either a top-down splitting strategy
or a bottom-up merging strategy.

March 6, 2014

21
Concept Hierarchy Generation
for Categorical Data
Specification of a partial ordering of
attributes explicitly at the schema
level by users or experts
 Specification of a portion of a
hierarchy by explicit data grouping:


March 6, 2014

22

Data pre processing

  • 1.
  • 2.
    Data Preprocessing    Today’s real-worlddatabases are highly susceptible to noisy, missing, and inconsistent data due to their typically huge size (often several gigabytes or more) and their likely origin from multiple, heterogeneous sources. Low-quality data will lead to low-quality mining results. Process or steps to make a “raw data” into quality data ( good input for mining tools).
  • 3.
    Why Data Preprocessing?  Datain the real world is dirty • incomplete: lacking attribute values, lacking certain attributes of interest, or containing only aggregate data  e.g., occupation=“ ” • noisy: containing errors or outliers  e.g., Salary=“-10” • inconsistent: containing discrepancies in codes or names  e.g., Age=“42” Birthday=“03/07/1997”  e.g., Was rating “1,2,3”, now rating “A, B, C”  e.g., discrepancy between duplicate records 3
  • 4.
    Why Is DataPreprocessing Important?  No quality data, no quality mining results! • Quality decisions must be based on quality data  e.g., duplicate or missing data may cause incorrect or even misleading statistics. • Data warehouse needs consistent integration of quality data  Data extraction, cleaning, and transformation involves the majority of the work of building a data warehouse (90%). 4
  • 5.
  • 6.
    Major Tasks inData Preprocessing      Data cleaning • Fill in missing values, smooth noisy data, identify or remove outliers, and resolve inconsistencies Data integration • Integration of multiple databases, data cubes, or files Data transformation • Normalization and aggregation Data reduction • Obtains reduced representation in volume but produces the same or similar analytical results Data discretization • Part of data reduction but with particular importance, especially for numerical data 6
  • 7.
    Forms of DataPreprocessing 7
  • 8.
    Data Cleaning   Importance • “Datacleaning is the number one problem in data warehousing”—DCI survey Data cleaning tasks • Fill in missing values • Identify outliers and smooth out noisy data • Correct inconsistent data • Resolve redundancy caused by data integration 8
  • 9.
    Noisy Data   Noise: randomerror or variance in a measured variable Incorrect attribute values may due to • faulty data collection instruments • data entry problems • data transmission problems 9
  • 10.
    Conti….    Noise: random erroror variance in a measured variable Incorrect attribute values may due to • faulty data collection instruments • data entry problems • data transmission problems • technology limitation • inconsistency in naming convention Other data problems which requires data cleaning • duplicate records • incomplete data • inconsistent data 10
  • 11.
    How to HandleNoisy Data?  Binning • first sort data and partition into (equal-frequency) bins • then one can smooth by bin means, smooth by bin median, smooth by bin boundaries, etc.  Regression • smooth by fitting the data into regression functions  Clustering • detect and remove outliers  Combined computer and human inspection • detect suspicious values and check by human (e.g., deal with possible outliers) 11
  • 12.
  • 13.
    Data Integration  Data integration: •Combines data from multiple sources into a coherent store   Schema integration: Integrate metadata from different sources Entity identification problem: • Identify real world entities from multiple data sources, e.g., Bill Clinton = William Clinton • metadata can be used to help avoid errors in schema integration  Detecting and resolving data value conflicts • For the same real world entity, attribute values from different sources are different • Possible reasons: different representations, different scales, e.g., Kg vs. Pound 13
  • 14.
    Handling Redundancy inData Integration  Redundant data occur often when integration of multiple databases • Object identification: The same attribute or object may have different names in different databases • Derivable data: One attribute may be a “derived” attribute in another table, e.g., annual revenue   Redundant attributes may be able to be detected by correlation analysis Careful integration of the data from multiple sources may help reduce/avoid redundancies and inconsistencies and improve mining speed and quality 14
  • 15.
    Descriptive Data Summarization      Fordata preprocessing to be successful, you have an overall picture of your data. It can be used to identify the typical properties of your data and highlight which data values should be treated as noise or outliers. Measures of central tendency include mean, median, mode, and midrange Midrange : It is the average of the largest and smallest values in the set. measures of data dispersion include quartiles, interquartile range (IQR), and variance. March 6, 2014 15
  • 16.
    Data Transformation  Smoothing: removenoise from data(binning, regression, and clustering)  Aggregation: summarization, data cube construction  Generalization: concept hierarchy climbing  Normalization: scaled to fall within a small, specified range • min-max normalization • z-score normalization • normalization by decimal scaling  Attribute/feature construction • New attributes constructed from the given ones 16
  • 17.
    Min-max normalization Suppose thatmin_A and max_A are the minimum and maximum values of an attribute A. Min-max normalization maps a value v of A to v’ in the range [new_min_A, new_max_A] March 6, 2014 17
  • 18.
    Data Reduction Strategies   Whydata reduction? • A database/data warehouse may store terabytes of data • Complex data analysis/mining may take a very long time to run on the complete data set Data reduction • Obtain a reduced representation of the data set that is much smaller in volume but yet produce the same (or almost the same) analytical results 18
  • 19.
    Data Reduction      1. Datacube aggregation, where aggregation operations are applied to the data in the construction of a data cube. 2. Attribute subset selection, where irrelevant, weakly relevant, or redundant attributes or dimensions may be detected and removed. 3. Dimensionality reduction, where encoding mechanisms are used to reduce the data set size. Numerosity reduction: where the data are replaced or estimated by alternative, smaller data representations 4. Discretization and concept hierarchy generation, where raw data values for attributes are replaced by ranges or higher conceptual levels. • Data discretization is a form of multiplicity reduction that is very useful for the automatic generation of concept hierarchies. • Discretization and concept hierarchy generation are powerful tools for data mining, in that they allow the mining of data at multiple levels of abstraction. 19
  • 20.
  • 21.
    Cluster Analysis  Clustering canbe used to generate a concept hierarchy for A by following either a top-down splitting strategy or a bottom-up merging strategy. March 6, 2014 21
  • 22.
    Concept Hierarchy Generation forCategorical Data Specification of a partial ordering of attributes explicitly at the schema level by users or experts  Specification of a portion of a hierarchy by explicit data grouping:  March 6, 2014 22