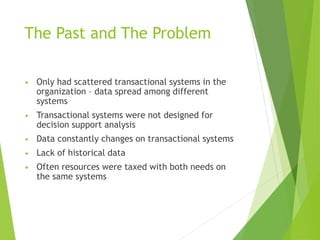
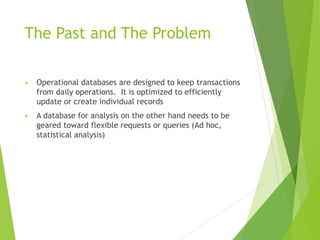
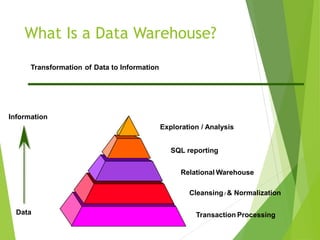
The document discusses various applications of data warehousing. It begins by describing problems with traditional transactional systems and how data warehouses address these issues. It then defines key components of a data warehouse including the extraction, transformation, and loading of data from various sources. The document outlines how online analytical processing (OLAP) tools, metadata repositories, and data mining techniques analyze and explore the collected data. Finally, it weighs the benefits of a data warehouse against the costs of implementation and maintenance.
Database systems that were based on the object data model were known originally as object-oriented databases (OODBs).These are mainly used for complex objects
The objective is to explain how a software design may be represented as a set of interacting objects that manage their own state and operations and to introduce various models that describe an object-oriented design.
For more detail visit : https://techforboost.blogspot.com
https://youtu.be/OcQZVc7pZZA
A multimedia database is a database that include one or more primary media file types such as .txt (documents), .jpg (images), .swf (videos), .mp3 (audio), etc.
Type constructor concepts where the examples are clearly described and points are easy to understand. Every point is clearly connected once we go through ppts.
Chapter 2 The Object Model
2.1 The Evolution of the Object Model
2.2 Foundations of the Object Model
2.3 Elements of the Object Model
2.4 Applying the Object Model
Presents the basic difference between "Flow chart" and "DFD". These are important tools for analysis and presentation of functionality of any system/software.
• What is MapReduce?
• What are MapReduce implementations?
Facing these questions I have make a personal research, and realize a synthesis, which has help me to clarify some ideas. The attached presentation does not intend to be exhaustive on the subject, but could perhaps bring you some useful insights.
This presentation is about the following points,
1. Introduction to ETL testing,
2. What is use of testing
3. What is quality & standards
4. Responsibilities of a ETL Tester
Introduction about Data Stage ,
Difference between Data Stage 7.5.2 and 8.0.1,
What's new in Data Stage 8.0.1? ,
What is way ahead in Data Stage? ,
IBM Information Server architecture ,
Datastage within the IBM Information Server architecture ,
Difference between Server Jobs and Parallel Jobs
Difference between Pipeline Parallelism and Partition, Parallelism ,
Partition techniques (Round Robin, Random,
As Europe's leading economic powerhouse and the fourth-largest hashtag#economy globally, Germany stands at the forefront of innovation and industrial might. Renowned for its precision engineering and high-tech sectors, Germany's economic structure is heavily supported by a robust service industry, accounting for approximately 68% of its GDP. This economic clout and strategic geopolitical stance position Germany as a focal point in the global cyber threat landscape.
In the face of escalating global tensions, particularly those emanating from geopolitical disputes with nations like hashtag#Russia and hashtag#China, hashtag#Germany has witnessed a significant uptick in targeted cyber operations. Our analysis indicates a marked increase in hashtag#cyberattack sophistication aimed at critical infrastructure and key industrial sectors. These attacks range from ransomware campaigns to hashtag#AdvancedPersistentThreats (hashtag#APTs), threatening national security and business integrity.
🔑 Key findings include:
🔍 Increased frequency and complexity of cyber threats.
🔍 Escalation of state-sponsored and criminally motivated cyber operations.
🔍 Active dark web exchanges of malicious tools and tactics.
Our comprehensive report delves into these challenges, using a blend of open-source and proprietary data collection techniques. By monitoring activity on critical networks and analyzing attack patterns, our team provides a detailed overview of the threats facing German entities.
This report aims to equip stakeholders across public and private sectors with the knowledge to enhance their defensive strategies, reduce exposure to cyber risks, and reinforce Germany's resilience against cyber threats.
Data Centers - Striving Within A Narrow Range - Research Report - MCG - May 2...pchutichetpong
M Capital Group (“MCG”) expects to see demand and the changing evolution of supply, facilitated through institutional investment rotation out of offices and into work from home (“WFH”), while the ever-expanding need for data storage as global internet usage expands, with experts predicting 5.3 billion users by 2023. These market factors will be underpinned by technological changes, such as progressing cloud services and edge sites, allowing the industry to see strong expected annual growth of 13% over the next 4 years.
Whilst competitive headwinds remain, represented through the recent second bankruptcy filing of Sungard, which blames “COVID-19 and other macroeconomic trends including delayed customer spending decisions, insourcing and reductions in IT spending, energy inflation and reduction in demand for certain services”, the industry has seen key adjustments, where MCG believes that engineering cost management and technological innovation will be paramount to success.
MCG reports that the more favorable market conditions expected over the next few years, helped by the winding down of pandemic restrictions and a hybrid working environment will be driving market momentum forward. The continuous injection of capital by alternative investment firms, as well as the growing infrastructural investment from cloud service providers and social media companies, whose revenues are expected to grow over 3.6x larger by value in 2026, will likely help propel center provision and innovation. These factors paint a promising picture for the industry players that offset rising input costs and adapt to new technologies.
According to M Capital Group: “Specifically, the long-term cost-saving opportunities available from the rise of remote managing will likely aid value growth for the industry. Through margin optimization and further availability of capital for reinvestment, strong players will maintain their competitive foothold, while weaker players exit the market to balance supply and demand.”
Show drafts
volume_up
Empowering the Data Analytics Ecosystem: A Laser Focus on Value
The data analytics ecosystem thrives when every component functions at its peak, unlocking the true potential of data. Here's a laser focus on key areas for an empowered ecosystem:
1. Democratize Access, Not Data:
Granular Access Controls: Provide users with self-service tools tailored to their specific needs, preventing data overload and misuse.
Data Catalogs: Implement robust data catalogs for easy discovery and understanding of available data sources.
2. Foster Collaboration with Clear Roles:
Data Mesh Architecture: Break down data silos by creating a distributed data ownership model with clear ownership and responsibilities.
Collaborative Workspaces: Utilize interactive platforms where data scientists, analysts, and domain experts can work seamlessly together.
3. Leverage Advanced Analytics Strategically:
AI-powered Automation: Automate repetitive tasks like data cleaning and feature engineering, freeing up data talent for higher-level analysis.
Right-Tool Selection: Strategically choose the most effective advanced analytics techniques (e.g., AI, ML) based on specific business problems.
4. Prioritize Data Quality with Automation:
Automated Data Validation: Implement automated data quality checks to identify and rectify errors at the source, minimizing downstream issues.
Data Lineage Tracking: Track the flow of data throughout the ecosystem, ensuring transparency and facilitating root cause analysis for errors.
5. Cultivate a Data-Driven Mindset:
Metrics-Driven Performance Management: Align KPIs and performance metrics with data-driven insights to ensure actionable decision making.
Data Storytelling Workshops: Equip stakeholders with the skills to translate complex data findings into compelling narratives that drive action.
Benefits of a Precise Ecosystem:
Sharpened Focus: Precise access and clear roles ensure everyone works with the most relevant data, maximizing efficiency.
Actionable Insights: Strategic analytics and automated quality checks lead to more reliable and actionable data insights.
Continuous Improvement: Data-driven performance management fosters a culture of learning and continuous improvement.
Sustainable Growth: Empowered by data, organizations can make informed decisions to drive sustainable growth and innovation.
By focusing on these precise actions, organizations can create an empowered data analytics ecosystem that delivers real value by driving data-driven decisions and maximizing the return on their data investment.
Techniques to optimize the pagerank algorithm usually fall in two categories. One is to try reducing the work per iteration, and the other is to try reducing the number of iterations. These goals are often at odds with one another. Skipping computation on vertices which have already converged has the potential to save iteration time. Skipping in-identical vertices, with the same in-links, helps reduce duplicate computations and thus could help reduce iteration time. Road networks often have chains which can be short-circuited before pagerank computation to improve performance. Final ranks of chain nodes can be easily calculated. This could reduce both the iteration time, and the number of iterations. If a graph has no dangling nodes, pagerank of each strongly connected component can be computed in topological order. This could help reduce the iteration time, no. of iterations, and also enable multi-iteration concurrency in pagerank computation. The combination of all of the above methods is the STICD algorithm. [sticd] For dynamic graphs, unchanged components whose ranks are unaffected can be skipped altogether.
Levelwise PageRank with Loop-Based Dead End Handling Strategy : SHORT REPORT ...Subhajit Sahu
Abstract — Levelwise PageRank is an alternative method of PageRank computation which decomposes the input graph into a directed acyclic block-graph of strongly connected components, and processes them in topological order, one level at a time. This enables calculation for ranks in a distributed fashion without per-iteration communication, unlike the standard method where all vertices are processed in each iteration. It however comes with a precondition of the absence of dead ends in the input graph. Here, the native non-distributed performance of Levelwise PageRank was compared against Monolithic PageRank on a CPU as well as a GPU. To ensure a fair comparison, Monolithic PageRank was also performed on a graph where vertices were split by components. Results indicate that Levelwise PageRank is about as fast as Monolithic PageRank on the CPU, but quite a bit slower on the GPU. Slowdown on the GPU is likely caused by a large submission of small workloads, and expected to be non-issue when the computation is performed on massive graphs.
1. Various Applications of Data
Warehouse
Rafiul Hasan Khan
ID: 1220617
420-DF1-GC-Datawarehouse
2. Introduction
• The Past and The Problem
• What is a Data Warehouse?
• Components of a Data Warehouse
• OLAP, Metadata, Data Mining
• Getting the Data in
• Benefits vs. Costs
• Conclusion
3. The Past and The Problem
• Only had scattered transactional systems in the
organization – data spread among different
systems
• Transactional systems were not designed for
decision support analysis
• Data constantly changes on transactional systems
• Lack of historical data
• Often resources were taxed with both needs on
the same systems
4. The Past and The Problem
• Operational databases are designed to keep transactions
from daily operations. It is optimized to efficiently
update or create individual records
• A database for analysis on the other hand needs to be
geared toward flexible requests or queries (Ad hoc,
statistical analysis)
5. What is a Data Warehouse?
Data warehousing is an architectural model designed to
gather data from various sources into a single unified
data model for analysis purposes.
6. What Is a Data Warehouse?
Term was introduced in 1990 by William Immon
A managed database in which the data is:
• Subject Oriented
• Integrated
• Time Variant
• Non Volatile
7. Subject Oriented
• Organized around major subject areas in the enterprise
(Sales, Inventory, Financial, etc.)
• Only includes data which is used in the decision making
processes
• Elements used for transactional processing are removed
8. Integrated
• Data from different sources are brought together and
consolidated
• The data is cleaned and made consistent
Example – Bank Systems using Different
Codes
Loan Department – COMM
Transactional System - C
9. Time Variant
• Data in a Data Warehouse contains both current and
historical information
• Operational Systems contain only current data
Systems typically retain data:
Operational Systems – 60 to 90 Days
Data Warehouse – 5 to 10 Years
10. Non Volatile
• Operational systems have continually changing data
• Data Warehouses continually absorb current data and
integrates it with its existing data (Aggregate or
Summary tables)
Example of volatile data would be an account
balance at a bank
11. What Is a Data Warehouse?
• Not a product, it is a process
• Combination of hardware and software
• Concept of a Data Warehouse is not new, but the
technology that allows it is
12. What Is a Data Warehouse?
Can often be set up as one VLDB (Very Large Database) or a
collection of subject areas called Data Marts.
There are now tools which “unify” these Data Marts and
make it appear as a single database.
13. What Is a Data Warehouse?
Transformation of Data to Information
Transaction Processing
Cleansing / & Normalization
Relational Warehouse
SQL reporting
Exploration / Analysis
Data
Information
14. Components of a Data
Warehouse
Four General Components:
• Hardware
• DBMS - Database Management System
• Front End Access Tools
• Other Tools
In all components scalability is vital
Scalability is the ability to grow as your data and
processing needs increase
15. Components of a Data
Warehouse - Hardware
• Power - # of Processors, Memory, I/O
Bandwidth, and Speed of the Bus
• Availability – Redundant equipment
• Disk Storage - Speed and enough
storage for the loaded data set
• Backup Solution - Automated and be
able to allow for incremental backups
and archiving older data
16. Components of a Data
Warehouse - DBMS
• Physical storage capacity of the DBMS
• Loading, indexing, and processing speed
• Availability
• Handle your data needs
• Operational integrity, reliability, and manageability
17. Components of a Data Warehouse
- Front End & Other Tools
• Query Tools (SQL & GUI based)
• Report Writers
• Metadata Repositories
• OLAP (Online Analytical Processing)
• Data Mining Products
18. Components of a Data Warehouse
– Metadata Repositories
Metadata is Data about Data. Users and
Developers often need a way to find
information on the data they use.
Information can include:
• Source System(s) of the Data, contact
information
• Related tables or subject areas
• Programs or Processes which use the data
• Population rules (Update or Insert and
how often)
• Status of the Data Warehouse’s processing
and condition
19. Components of a Data
Warehouse – OLAP Tools
OLAP - Online Analytical Processing. It works by
aggregating detail data and looks at it by
dimensions
• Gives the ability to “Drill Down” in to the detail
data
• Decision Support Analysis Tool
• Multidimensional DB focusing on retrieval of
precalculated data
• Ends the “big reports” with large amounts of
detailed data
• These tools are often graphical and can run on a
“thin client” such as a web browser
20. Components of a Data
Warehouse – Data Mining
• Answers the questions you didn’t know to ask
• Analyzes great amounts of data (usually contained in a
Data Warehouse) and looks for trends in the data
• Technology now allows us to do this better than in the
past
21. Components of a Data
Warehouse – Data Mining
• Most famous example is the Huggies - Heineken case
• Used in Retail sector to analyze buying habits
• Used in financial areas to detect fraud
• Used in the stock market to find trends
• Used in scientific research
• Used in national security
22. Getting the Data In
• Data will come from multiple databases and files within
the organization
• Also can come from outside sources
• Examples:
•Weather Reports
•Demographic information
by Zip Code
23. Getting the Data In
Three Steps :
1. Extraction Phase
2. Transformation Phase
3. Loading Phase
24. Getting the Data In
Extraction Phase:
• Source systems export data via files or populates
directly when the databases can “talk” to each other
• Transfers them to the Data Warehouse server and puts it
into some sort of staging area
25. Getting the Data In
Transformation Phase:
• Takes data and turns it into a form that is
suitable for insertion into the warehouse
• Combines related data
• Removes redundancies
• Common Codes (Commercial Customer)
• Spelling Mistakes (Lozenges)
• Consistency (PA,Pa,Penna,Pennsylvania)
• Formatting (Addresses)
26. Getting the Data In
Loading Phase:
• Places the cleaned data into the DBMS in its final,
useable form
• Compare data from source systems and the Data
Warehouse
• Document the load information for the users
28. Benefits
• Creates a single point for all data
• System is optimized and designed specifically for
analysis
• Access data without impacting the operational systems
• Users can access the data directly without the direct
help from IT dept
29. Costs
• Cost of implementation & maintenance (hardware,
software, and staffing)
• Lack of compatibility between components
• Data from many sources are hard to combine, data
integrity issues
• Bad designs and practices can lead to costly failures
30. Conclusion
• What is a Data Warehouse?
• Components of a Data Warehouse
• How the Data Gets In
• OLAP, Metadata, and Data Mining
• Benefits vs. Costs