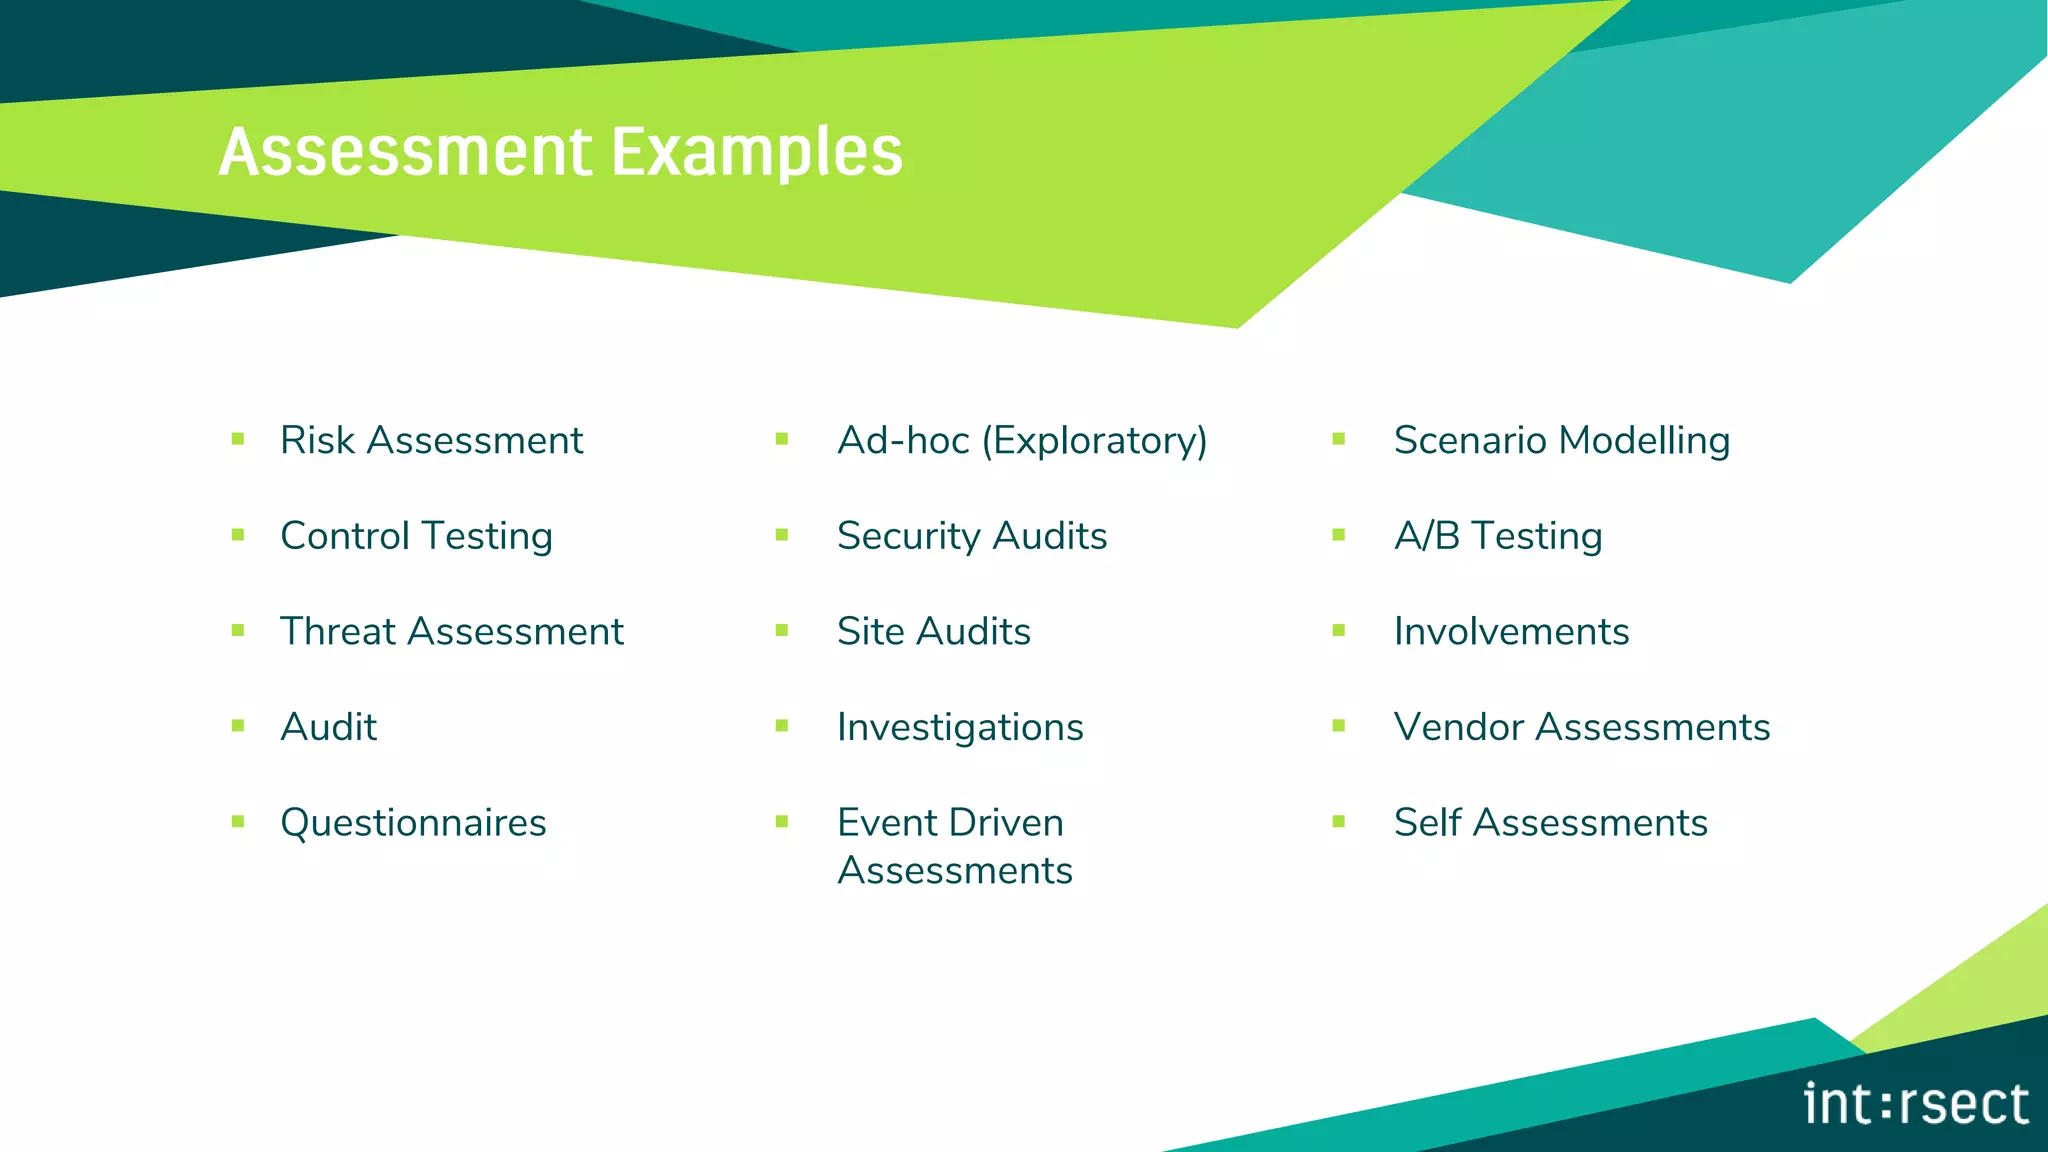
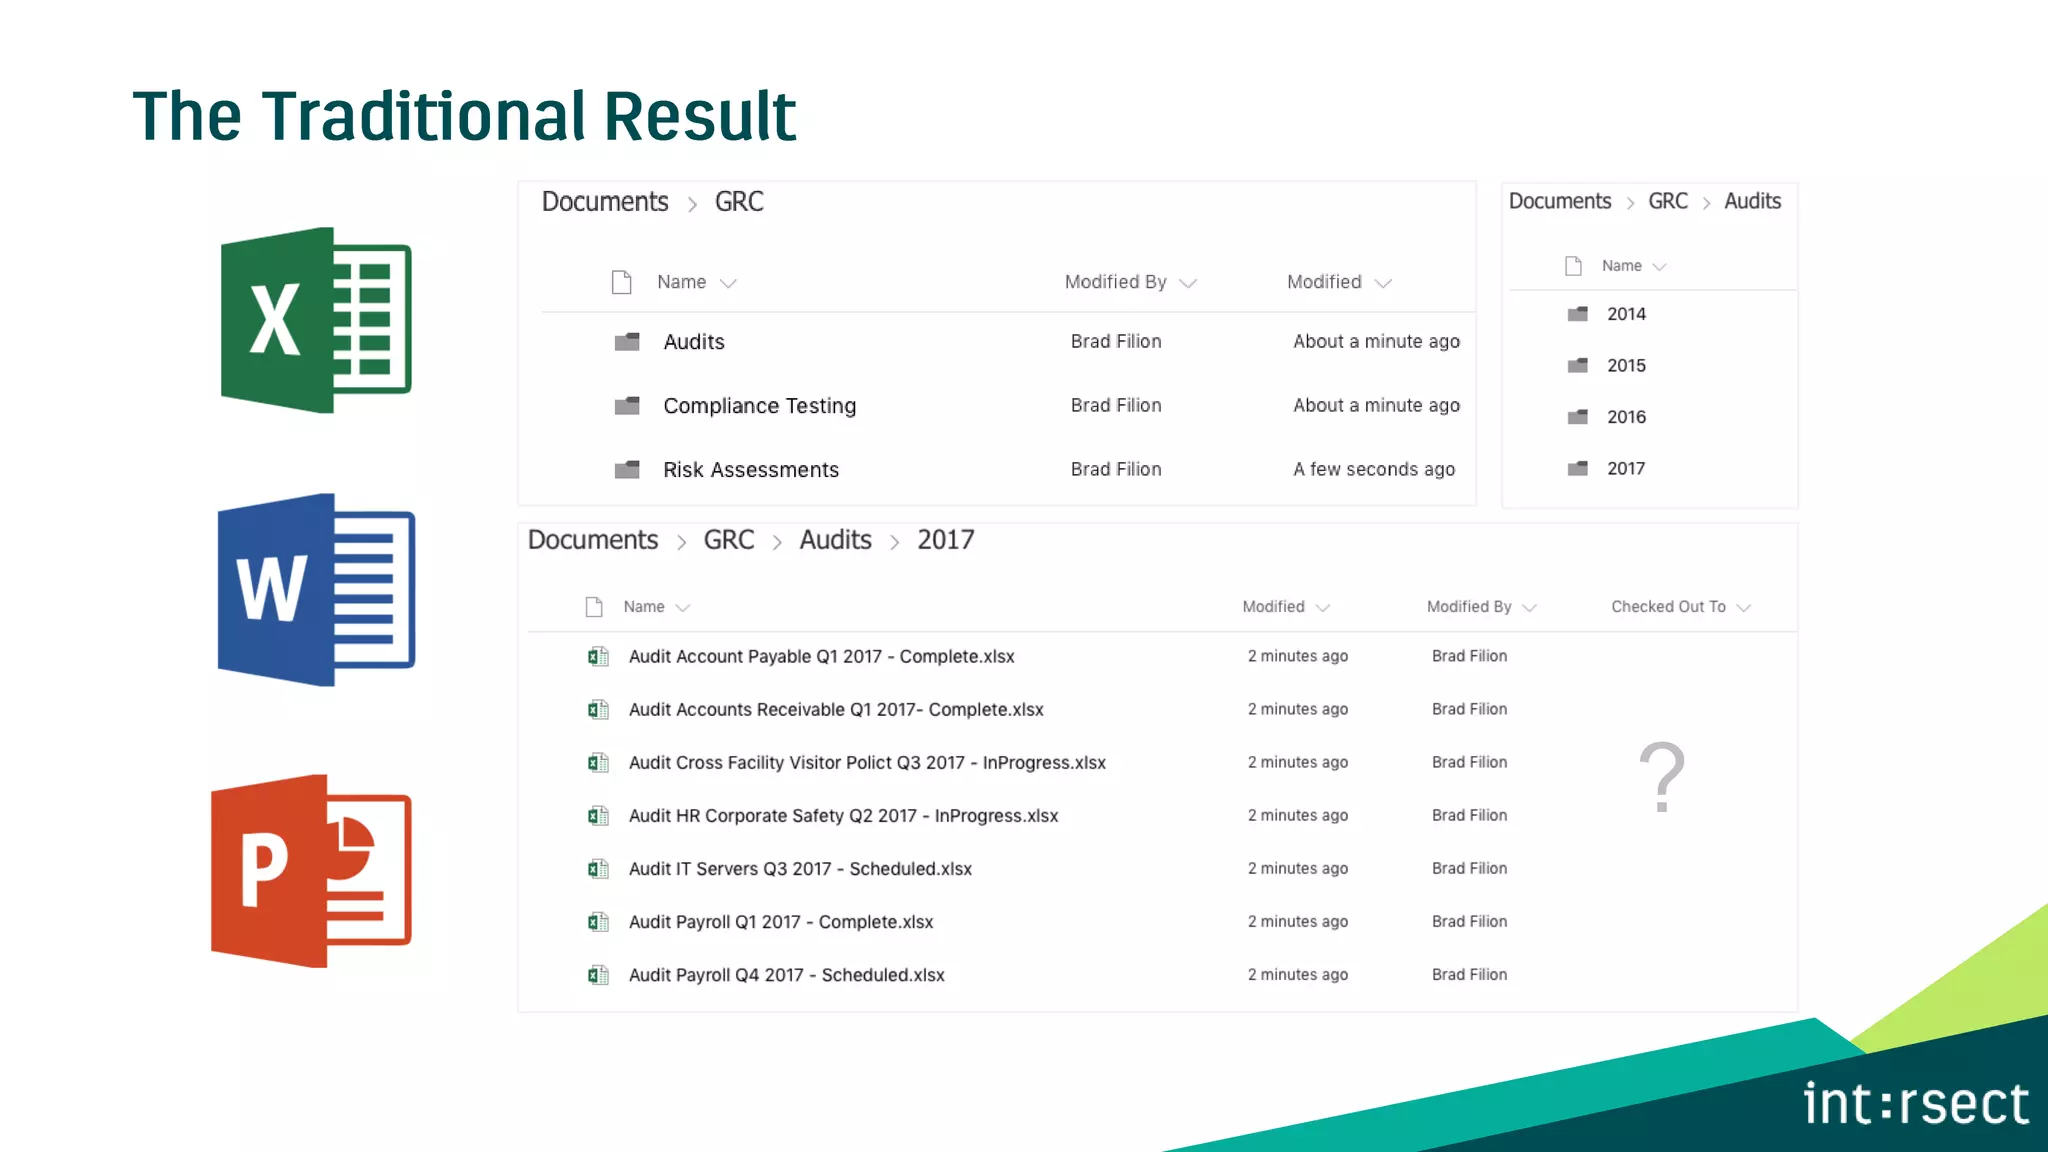
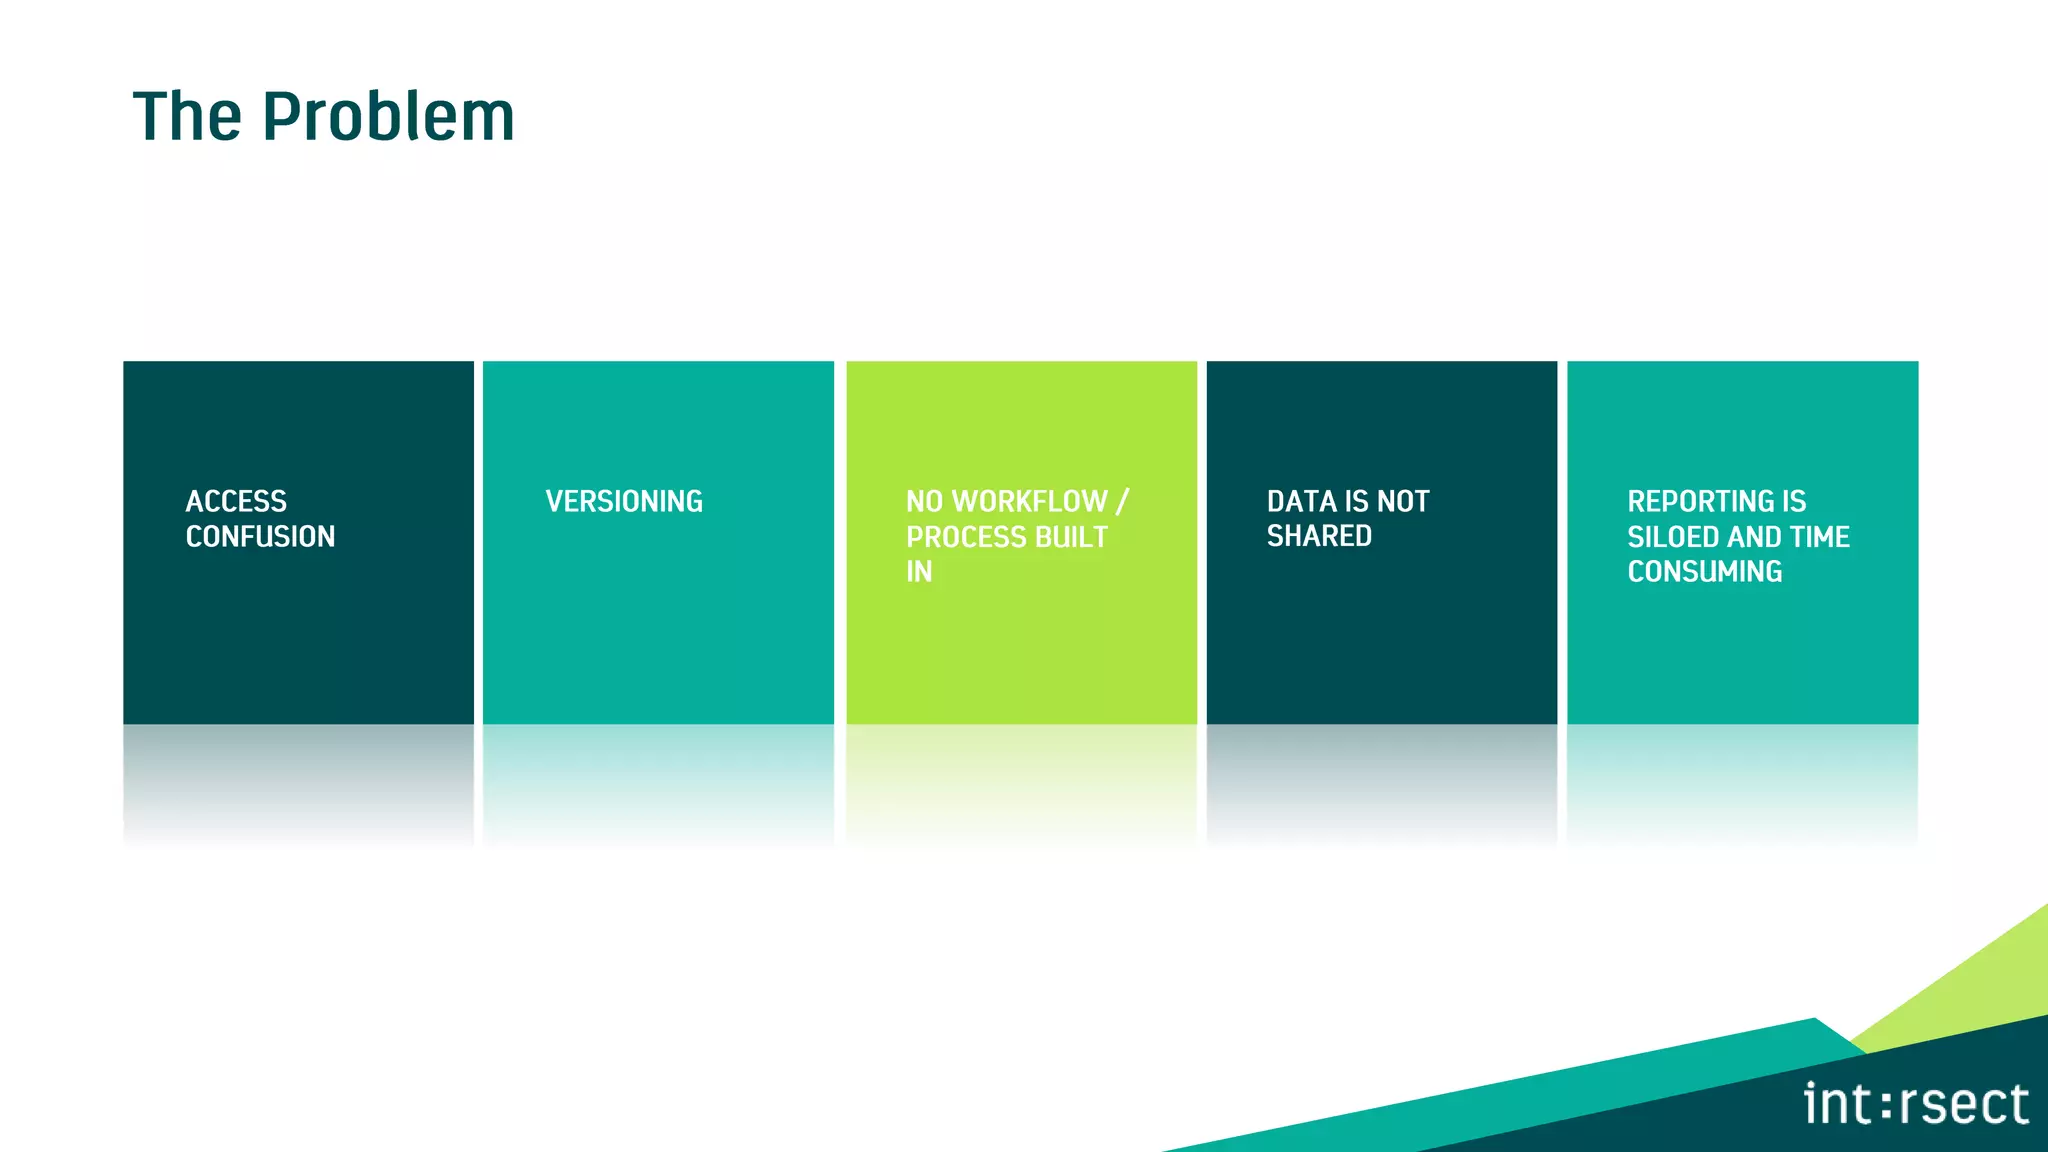
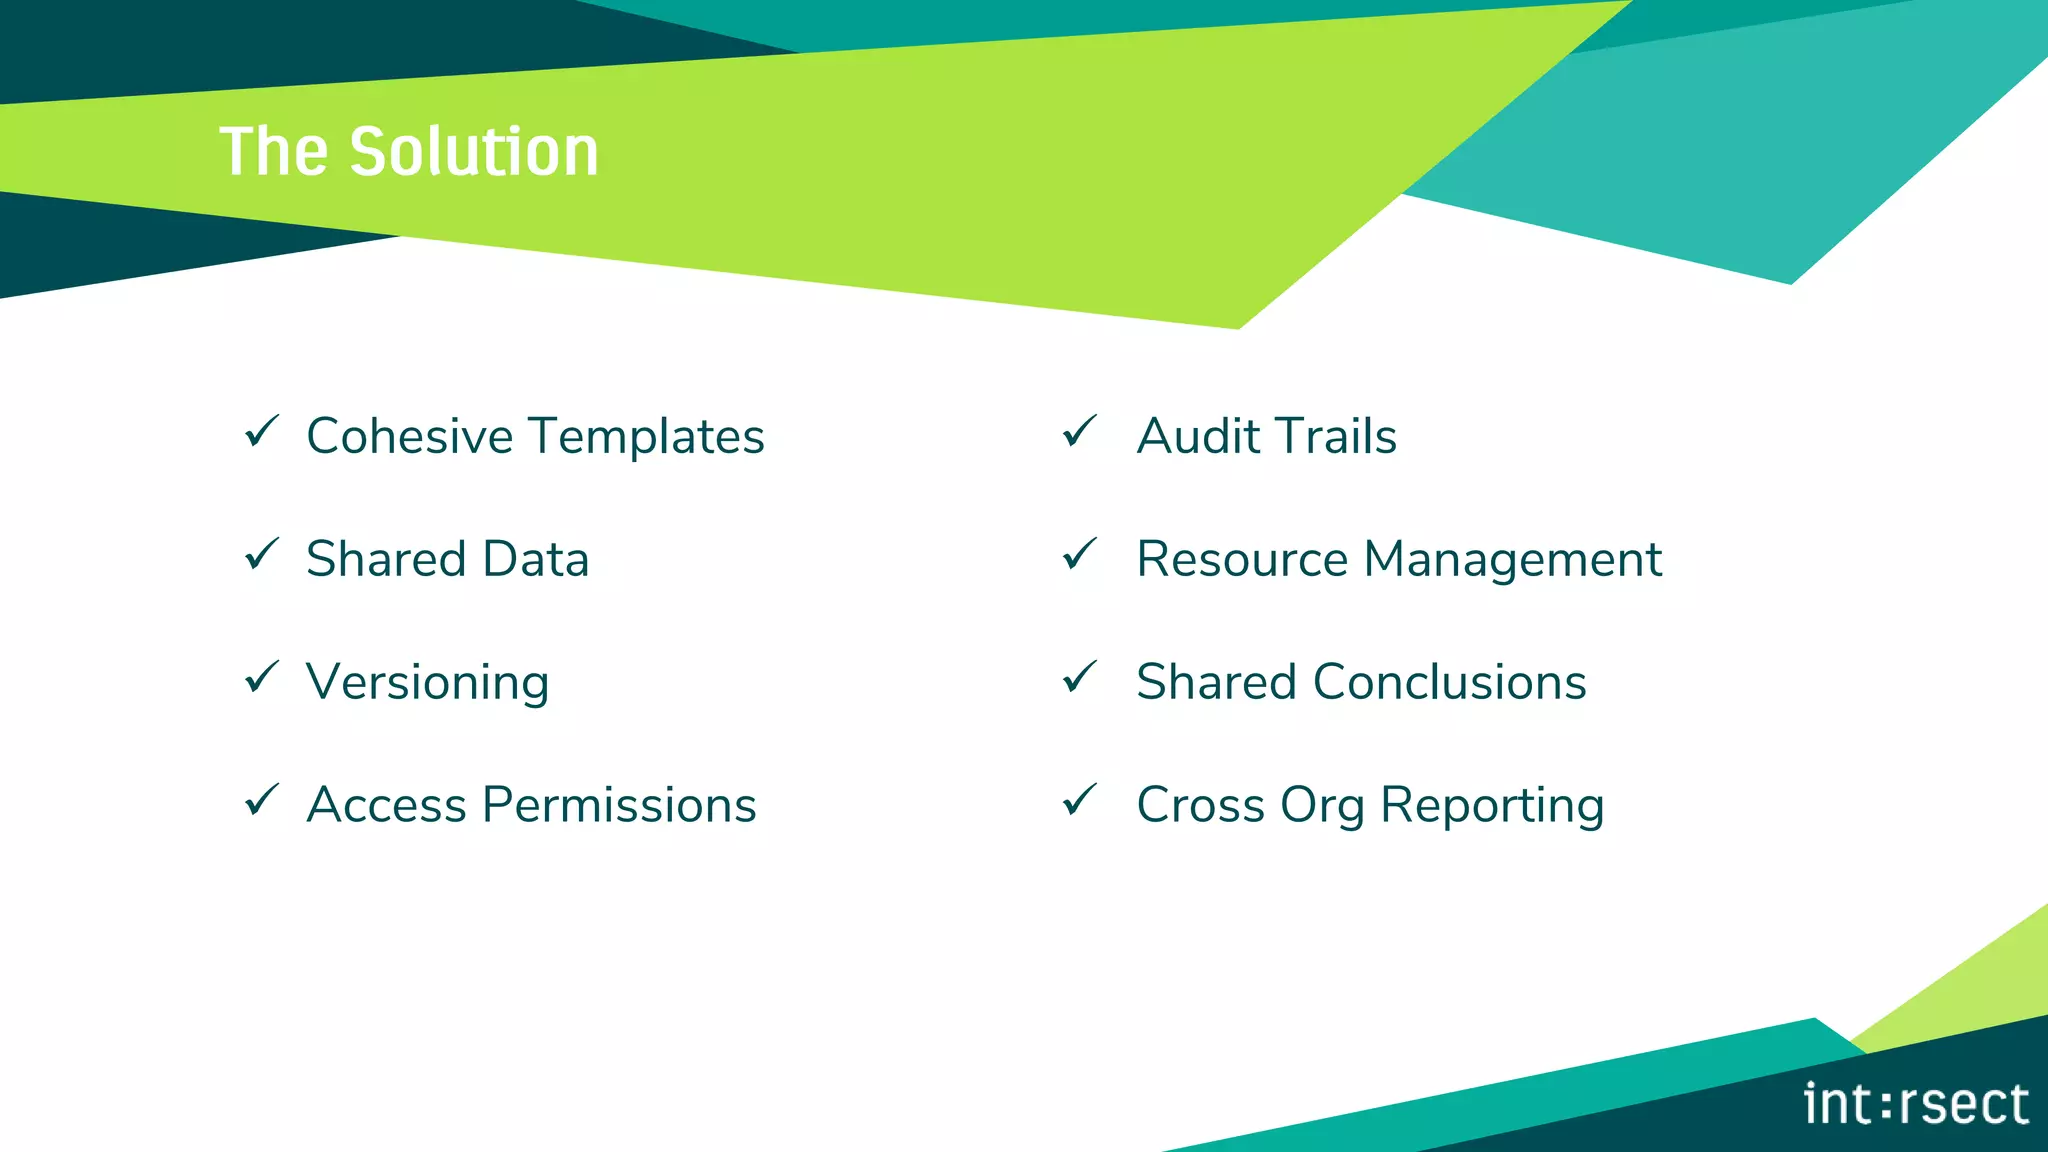
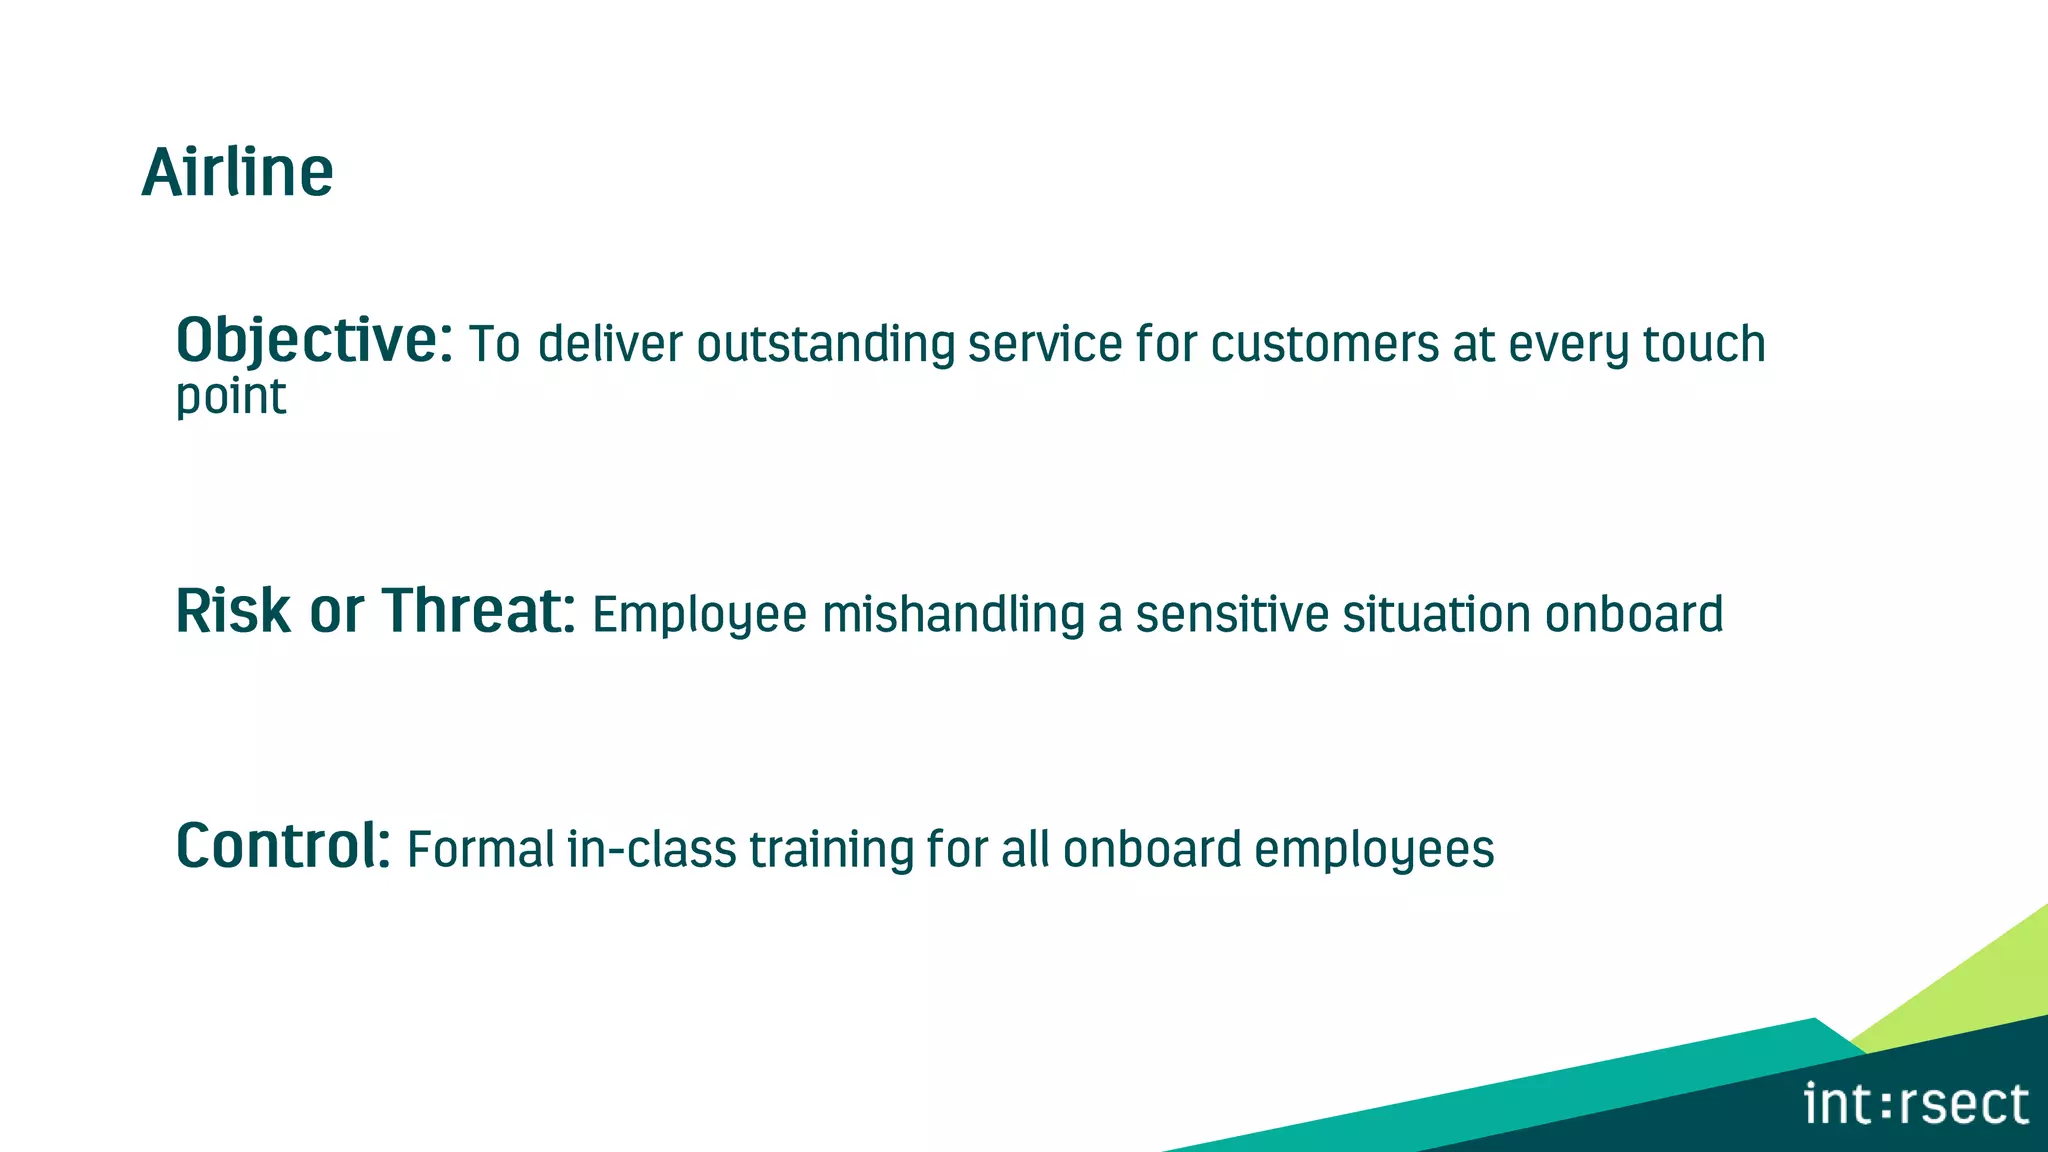
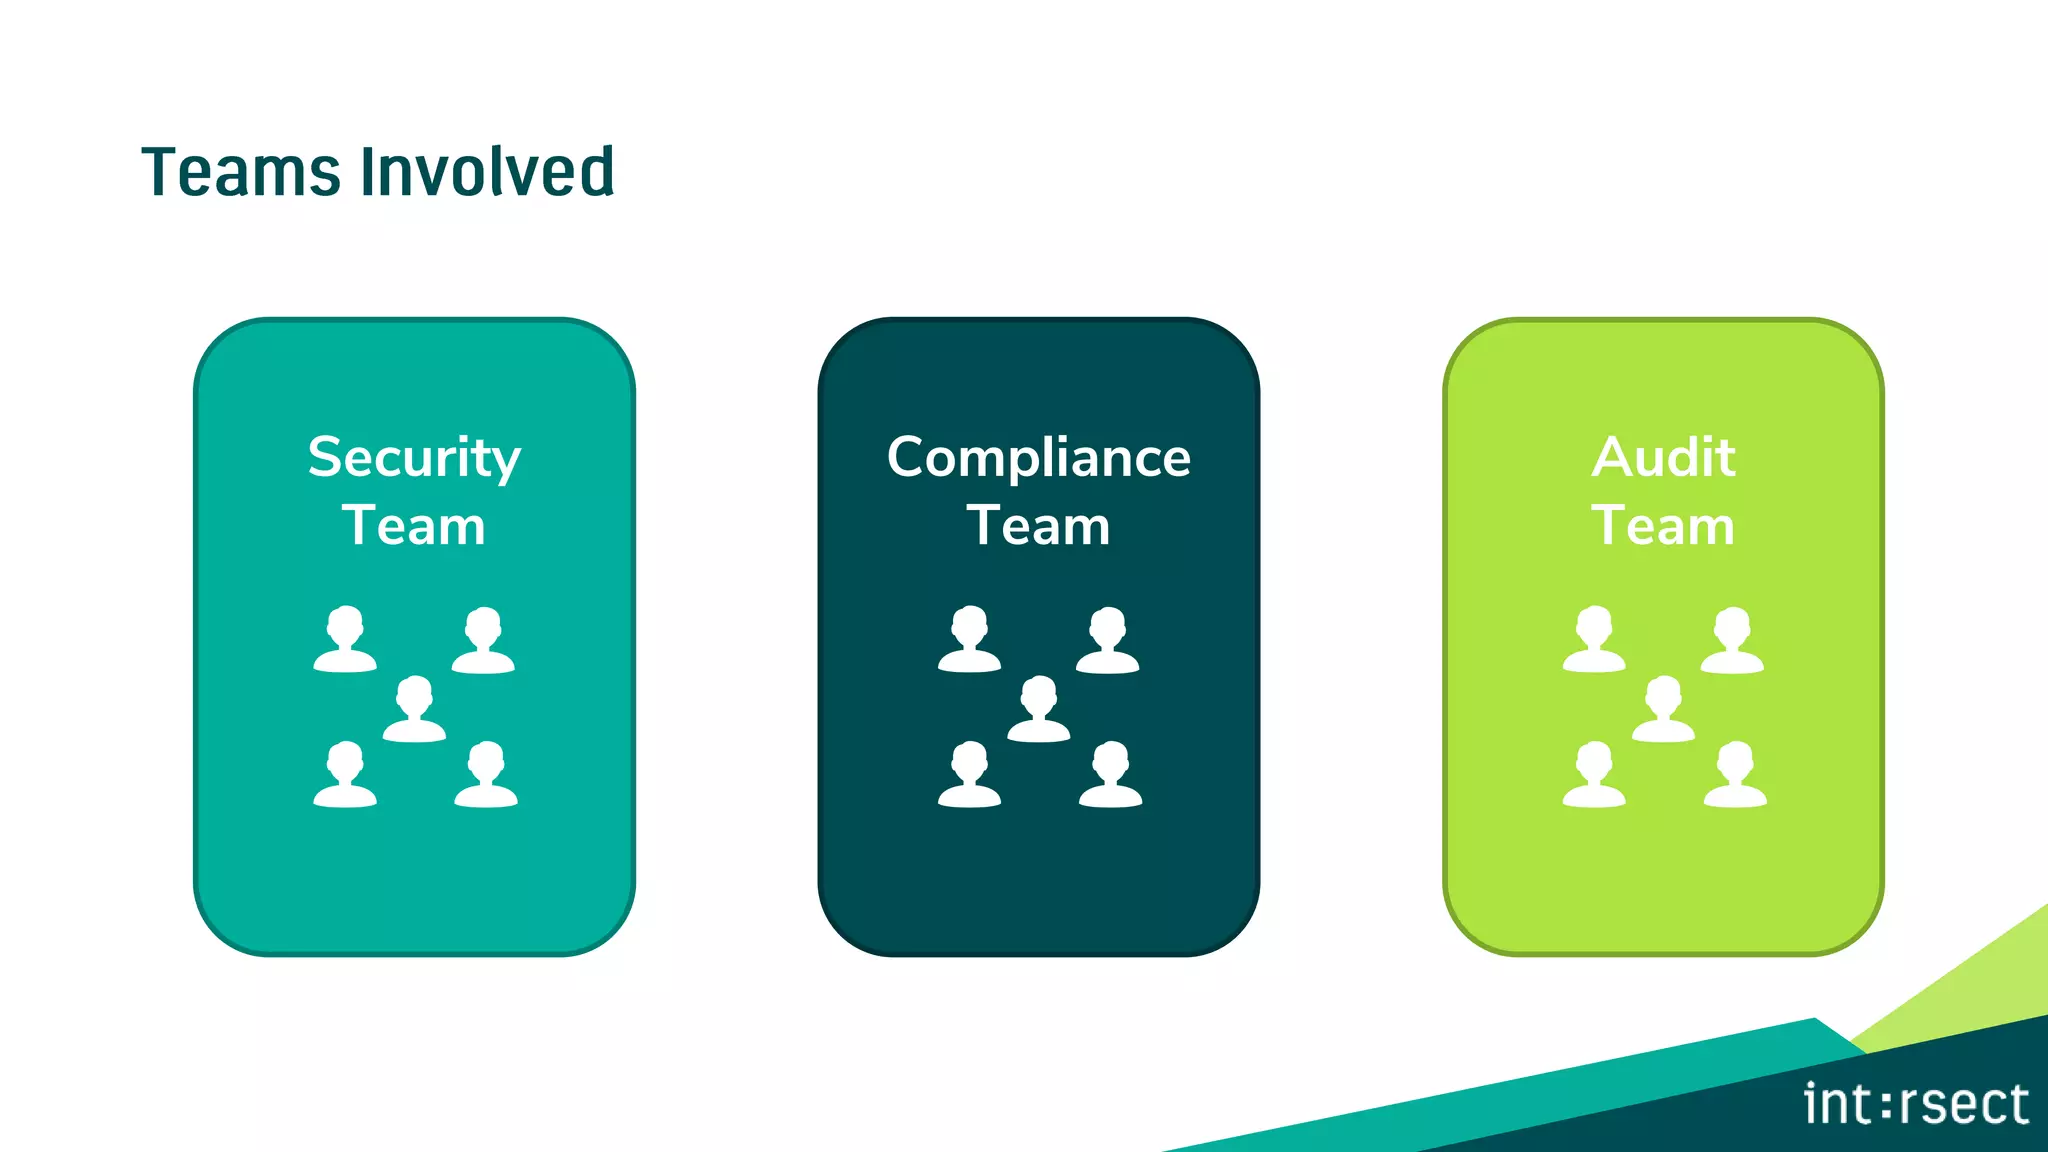
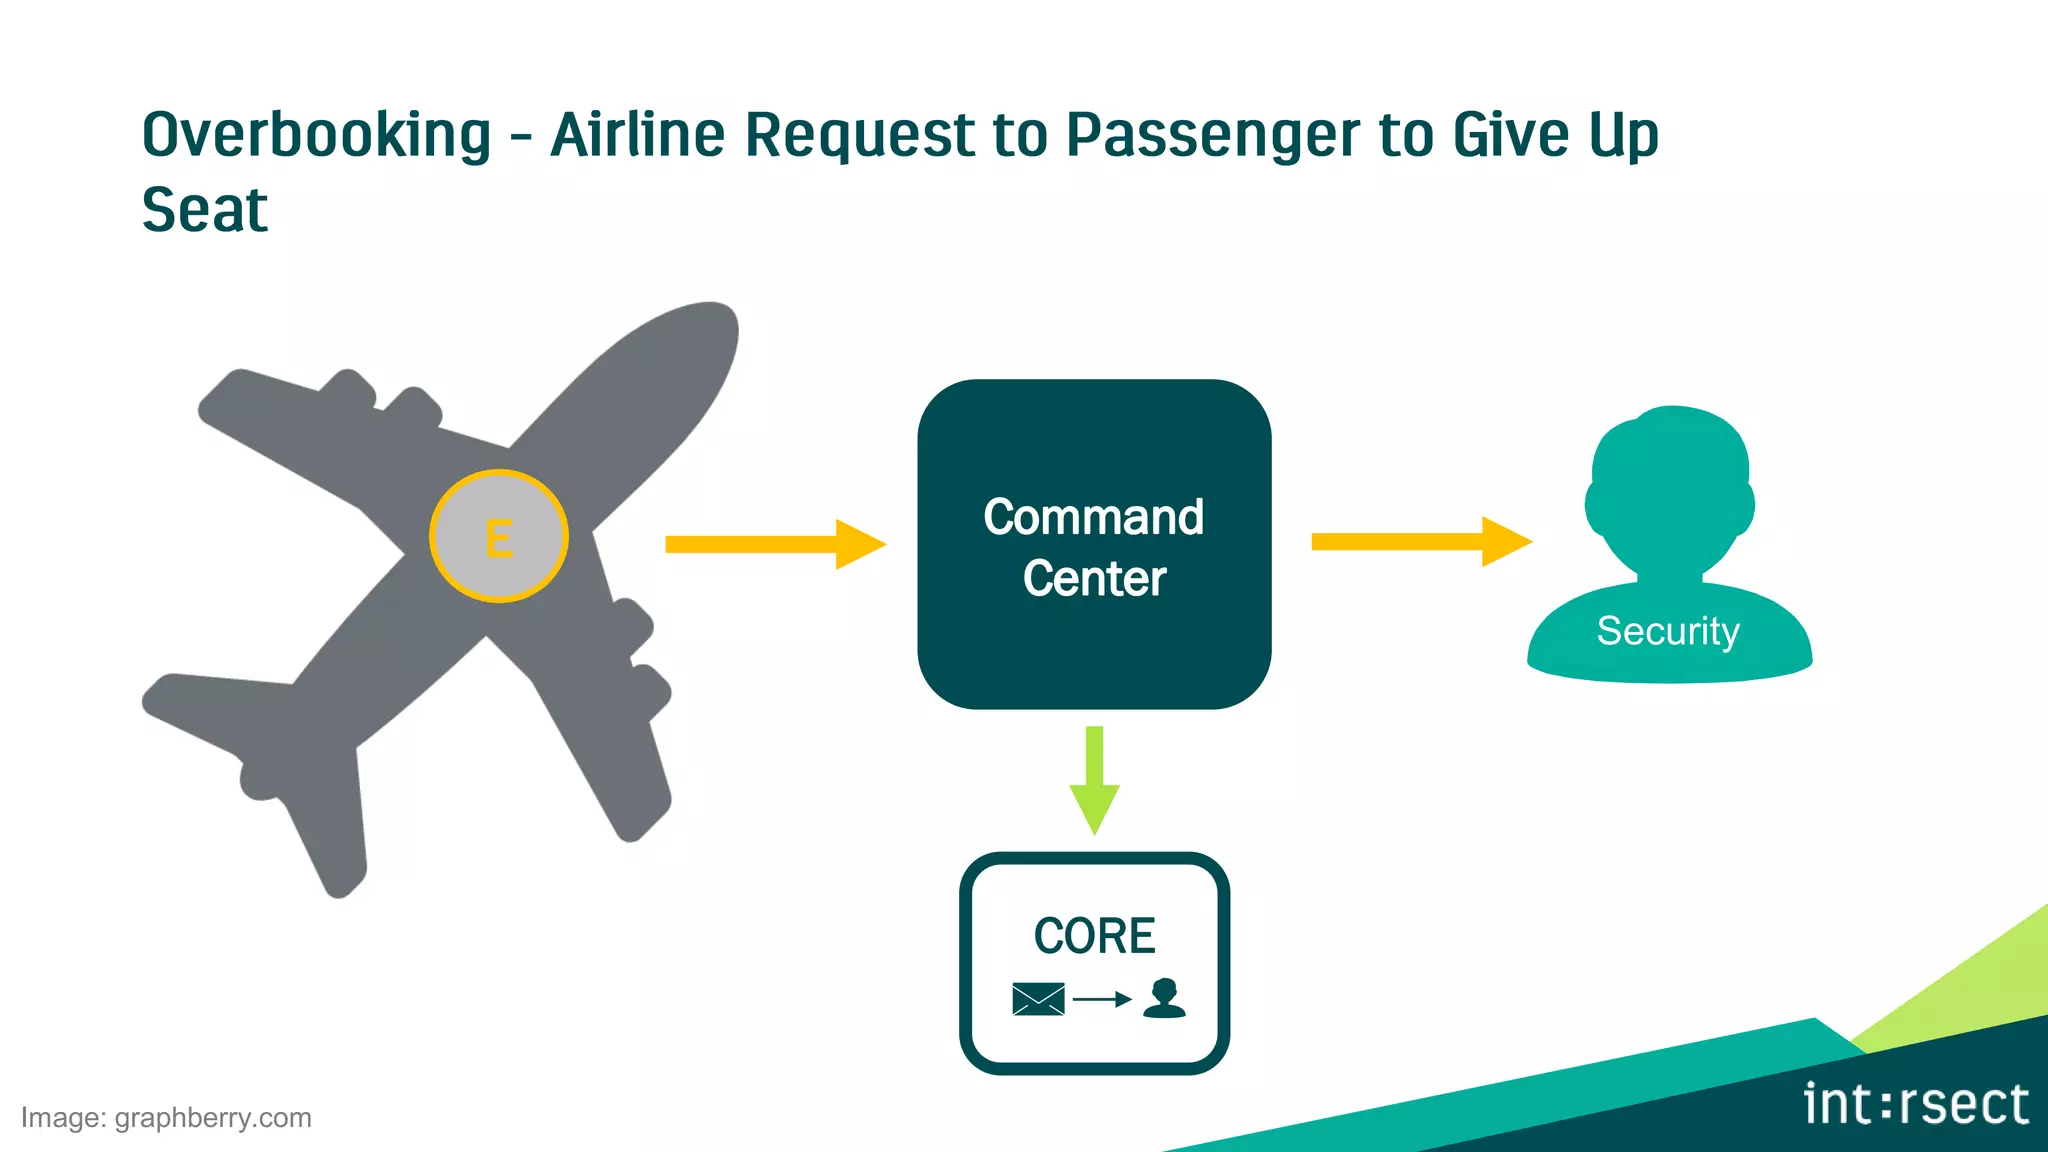
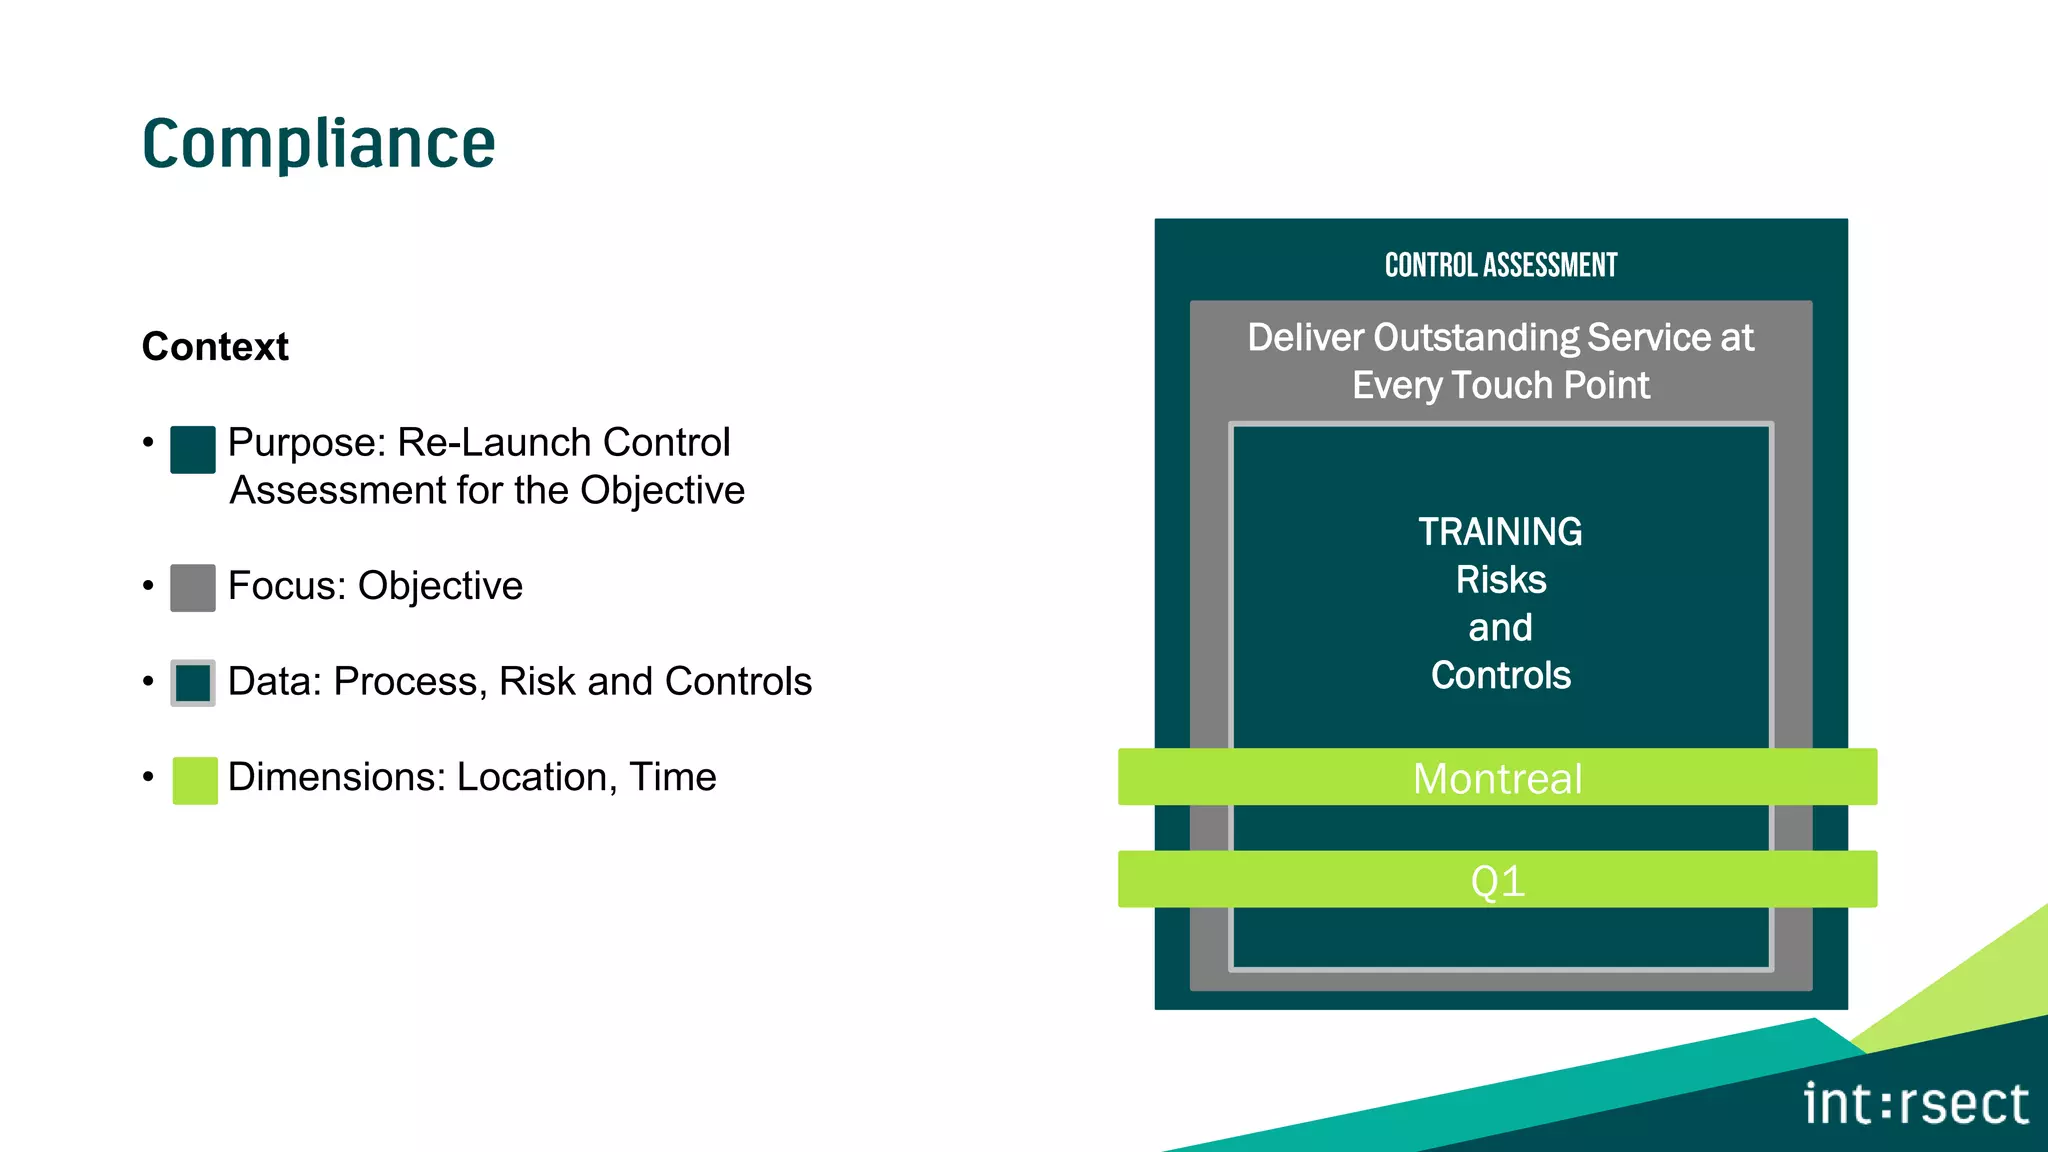
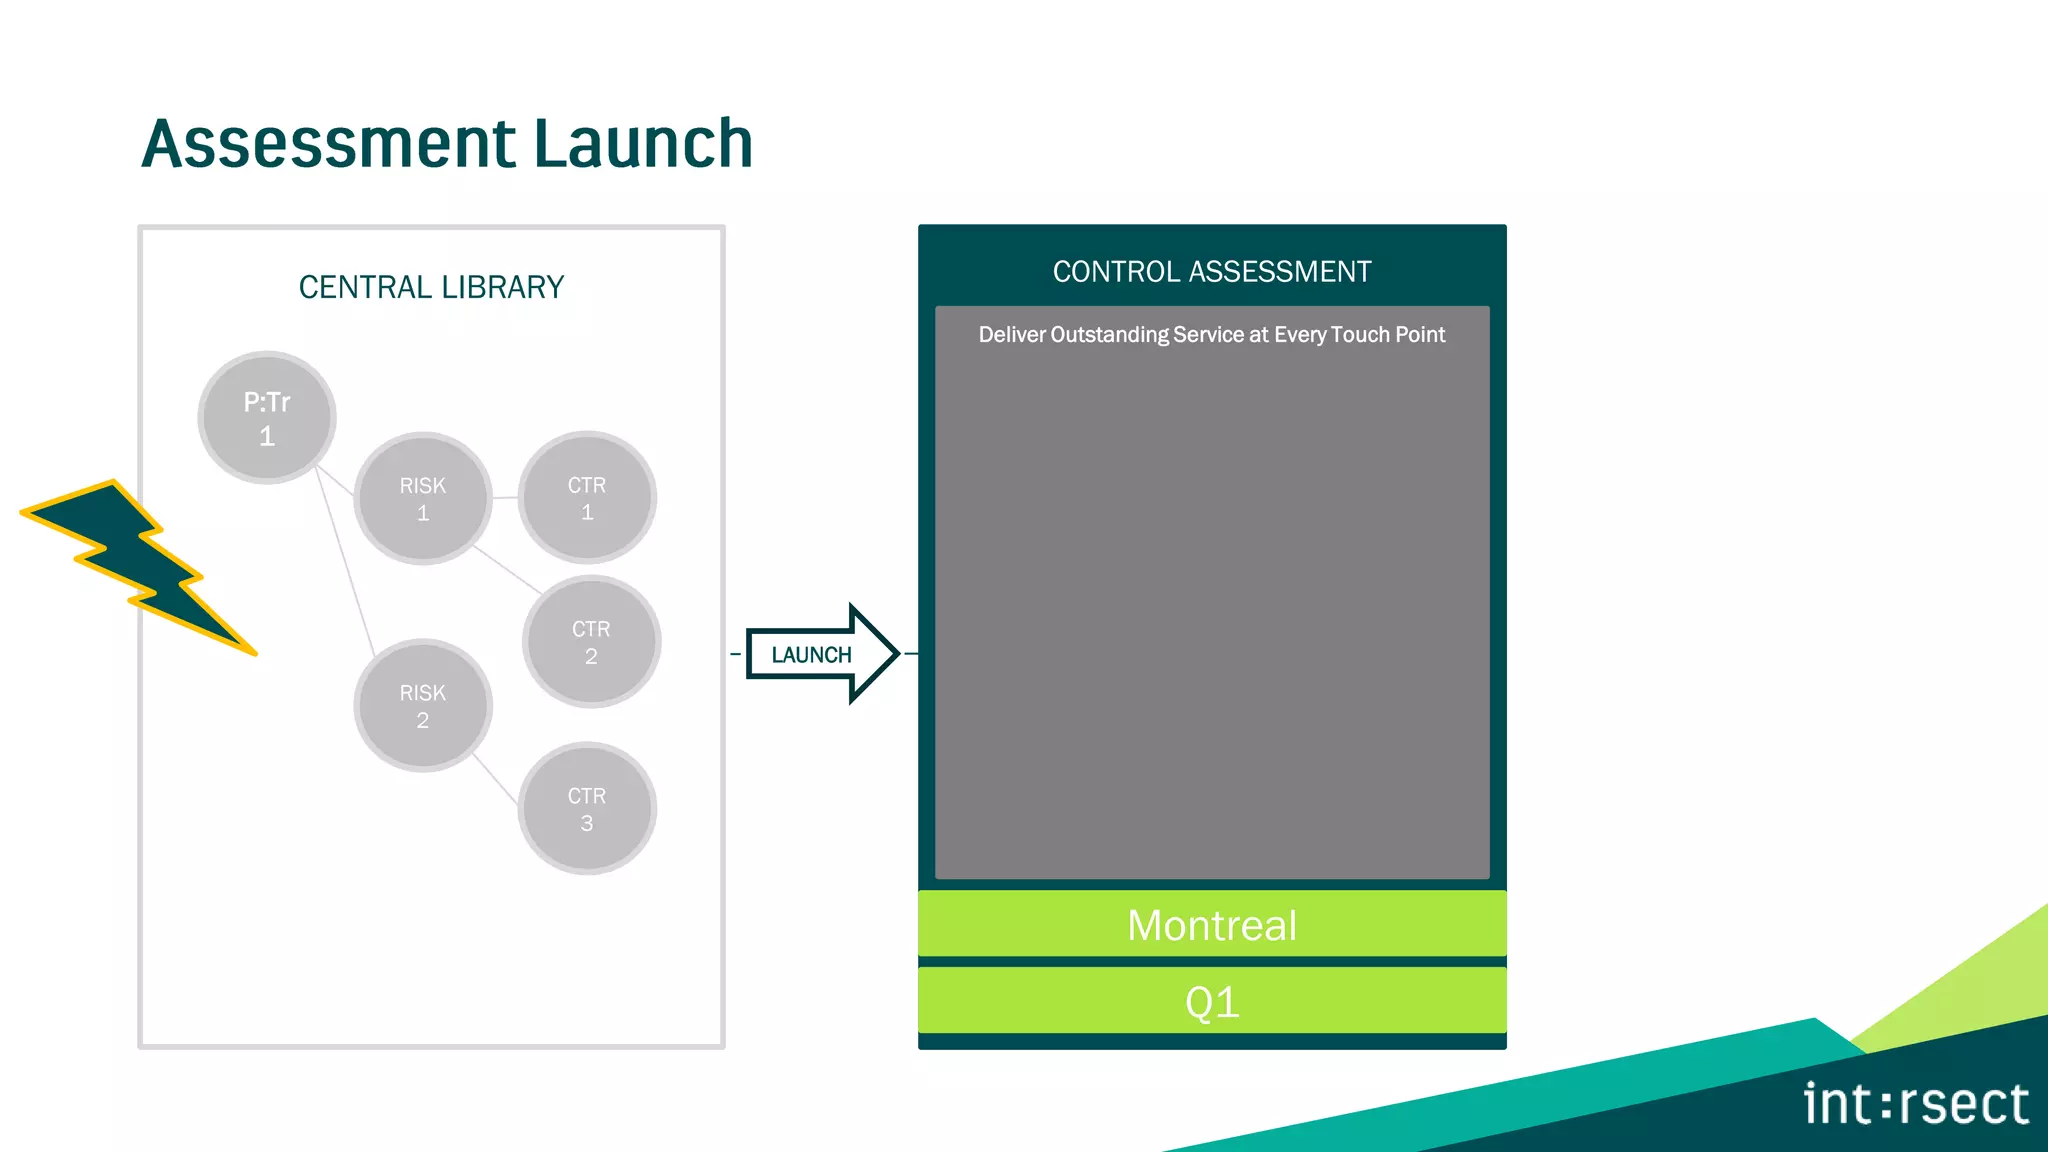
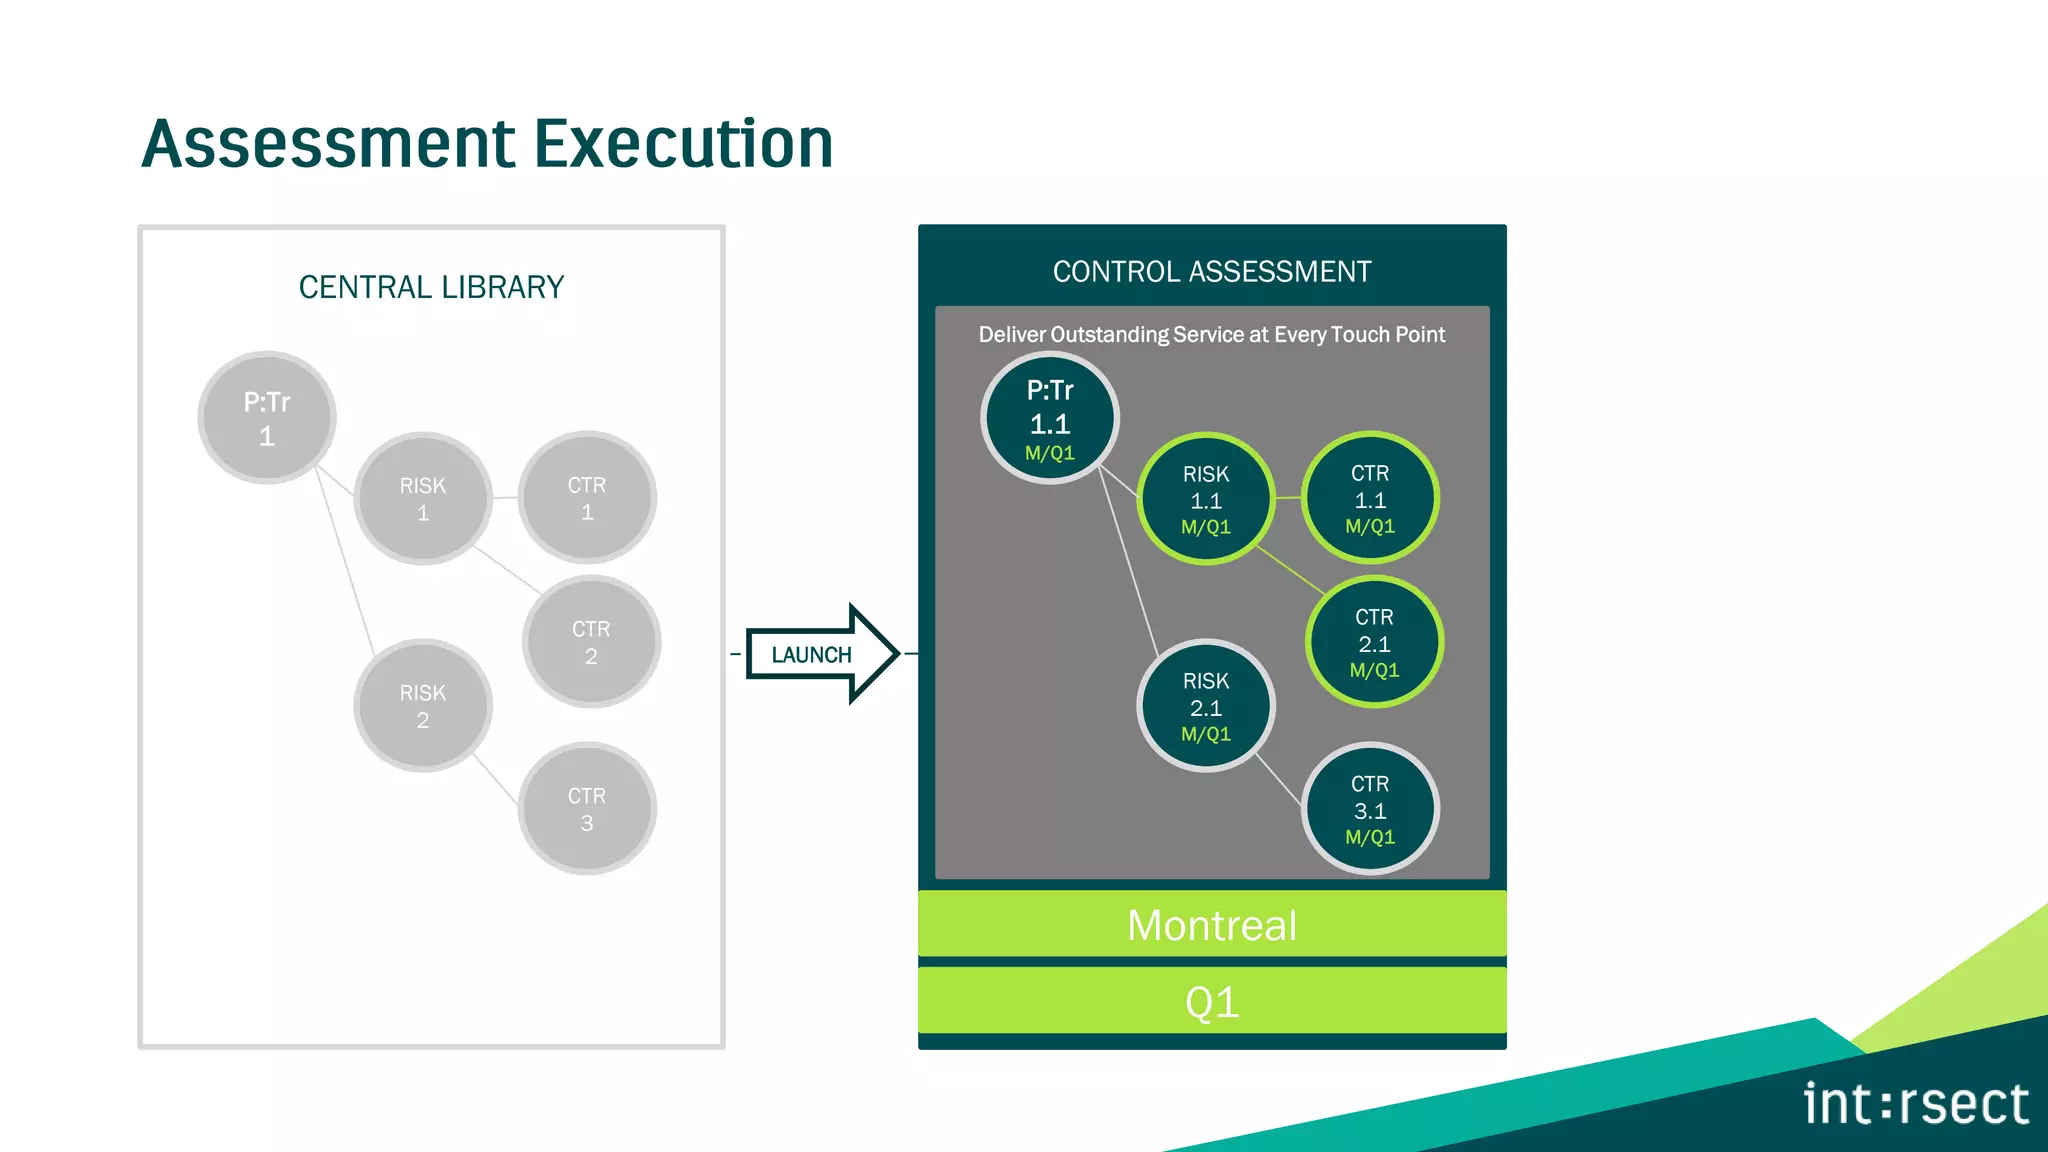
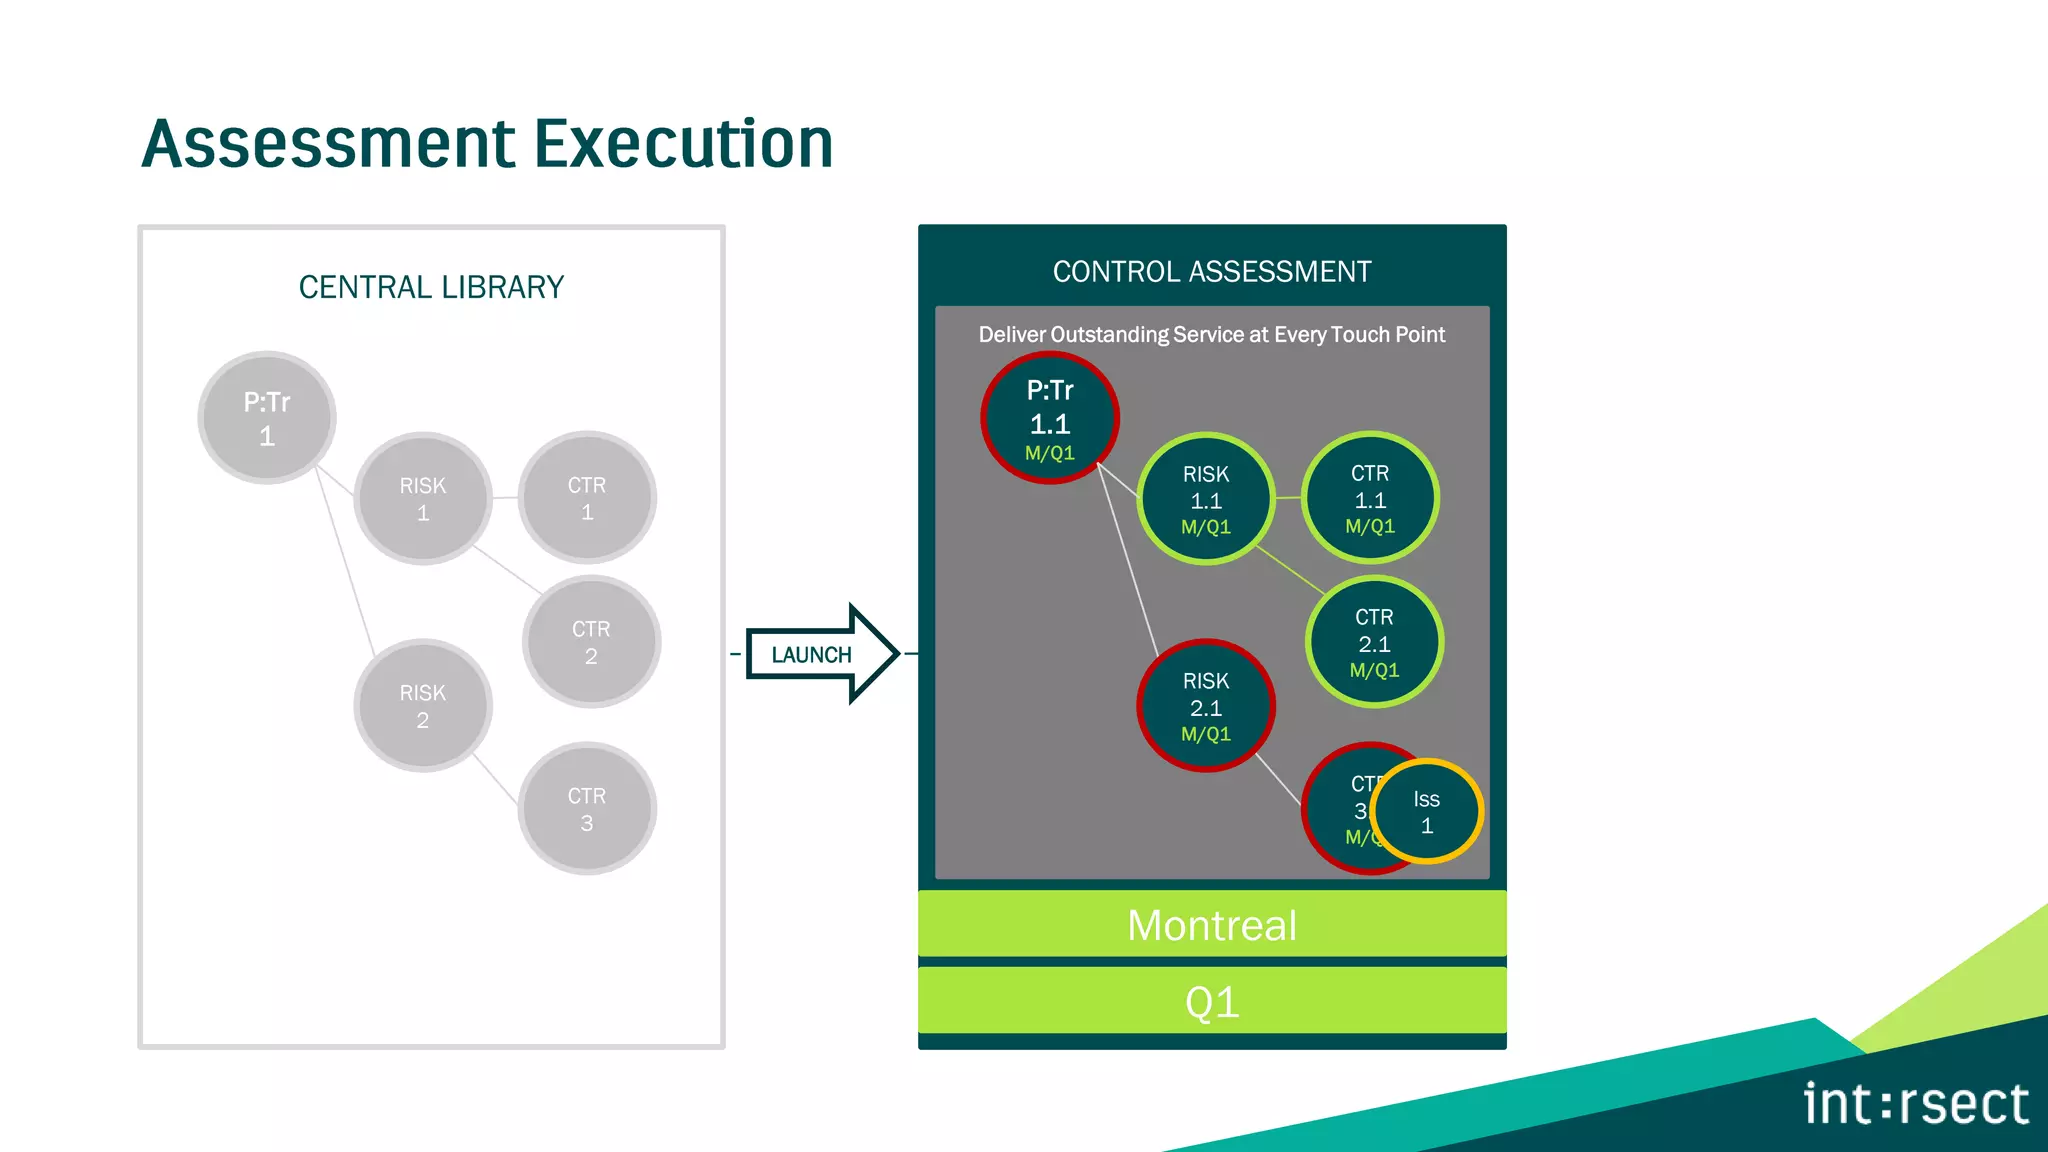
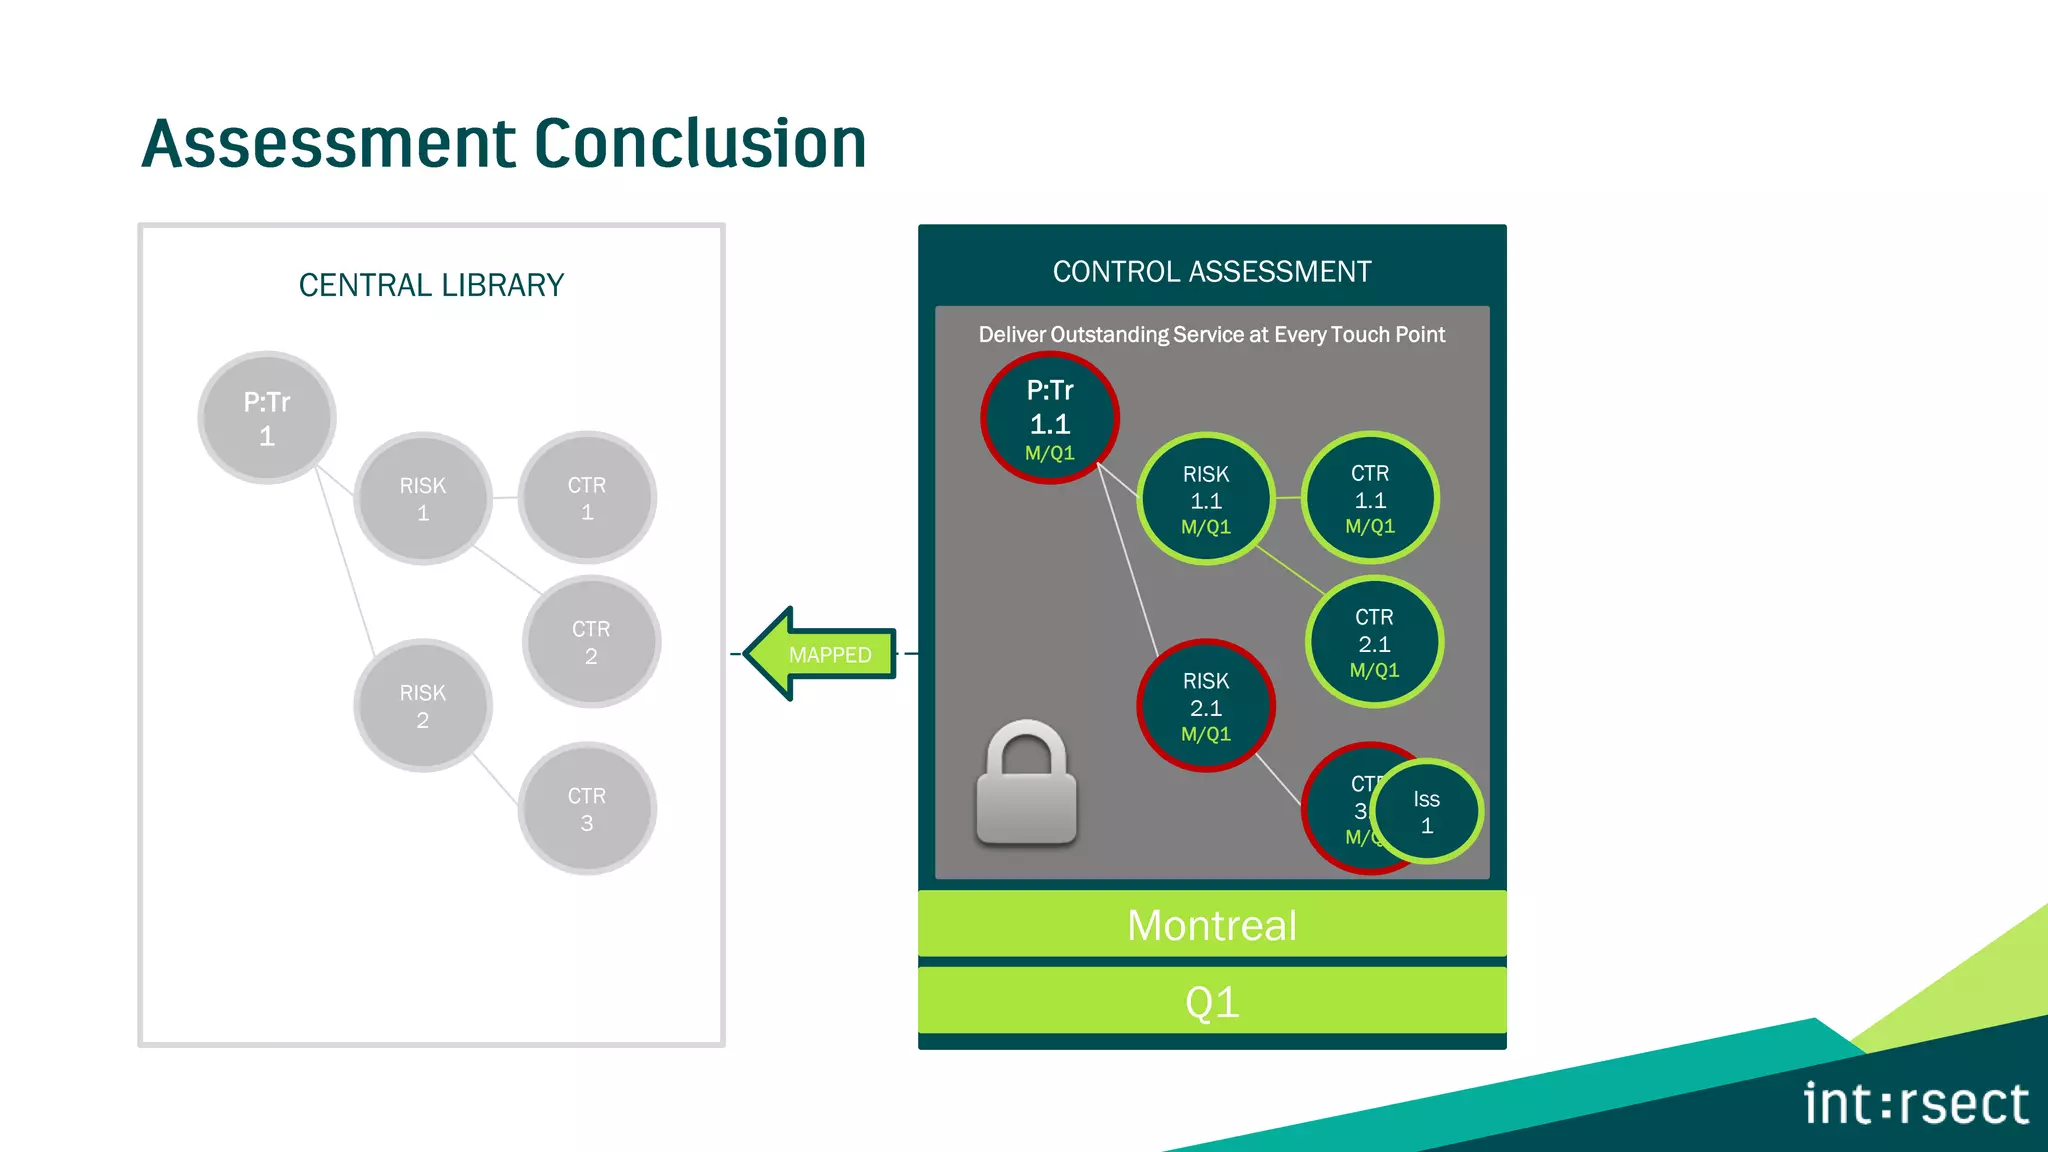
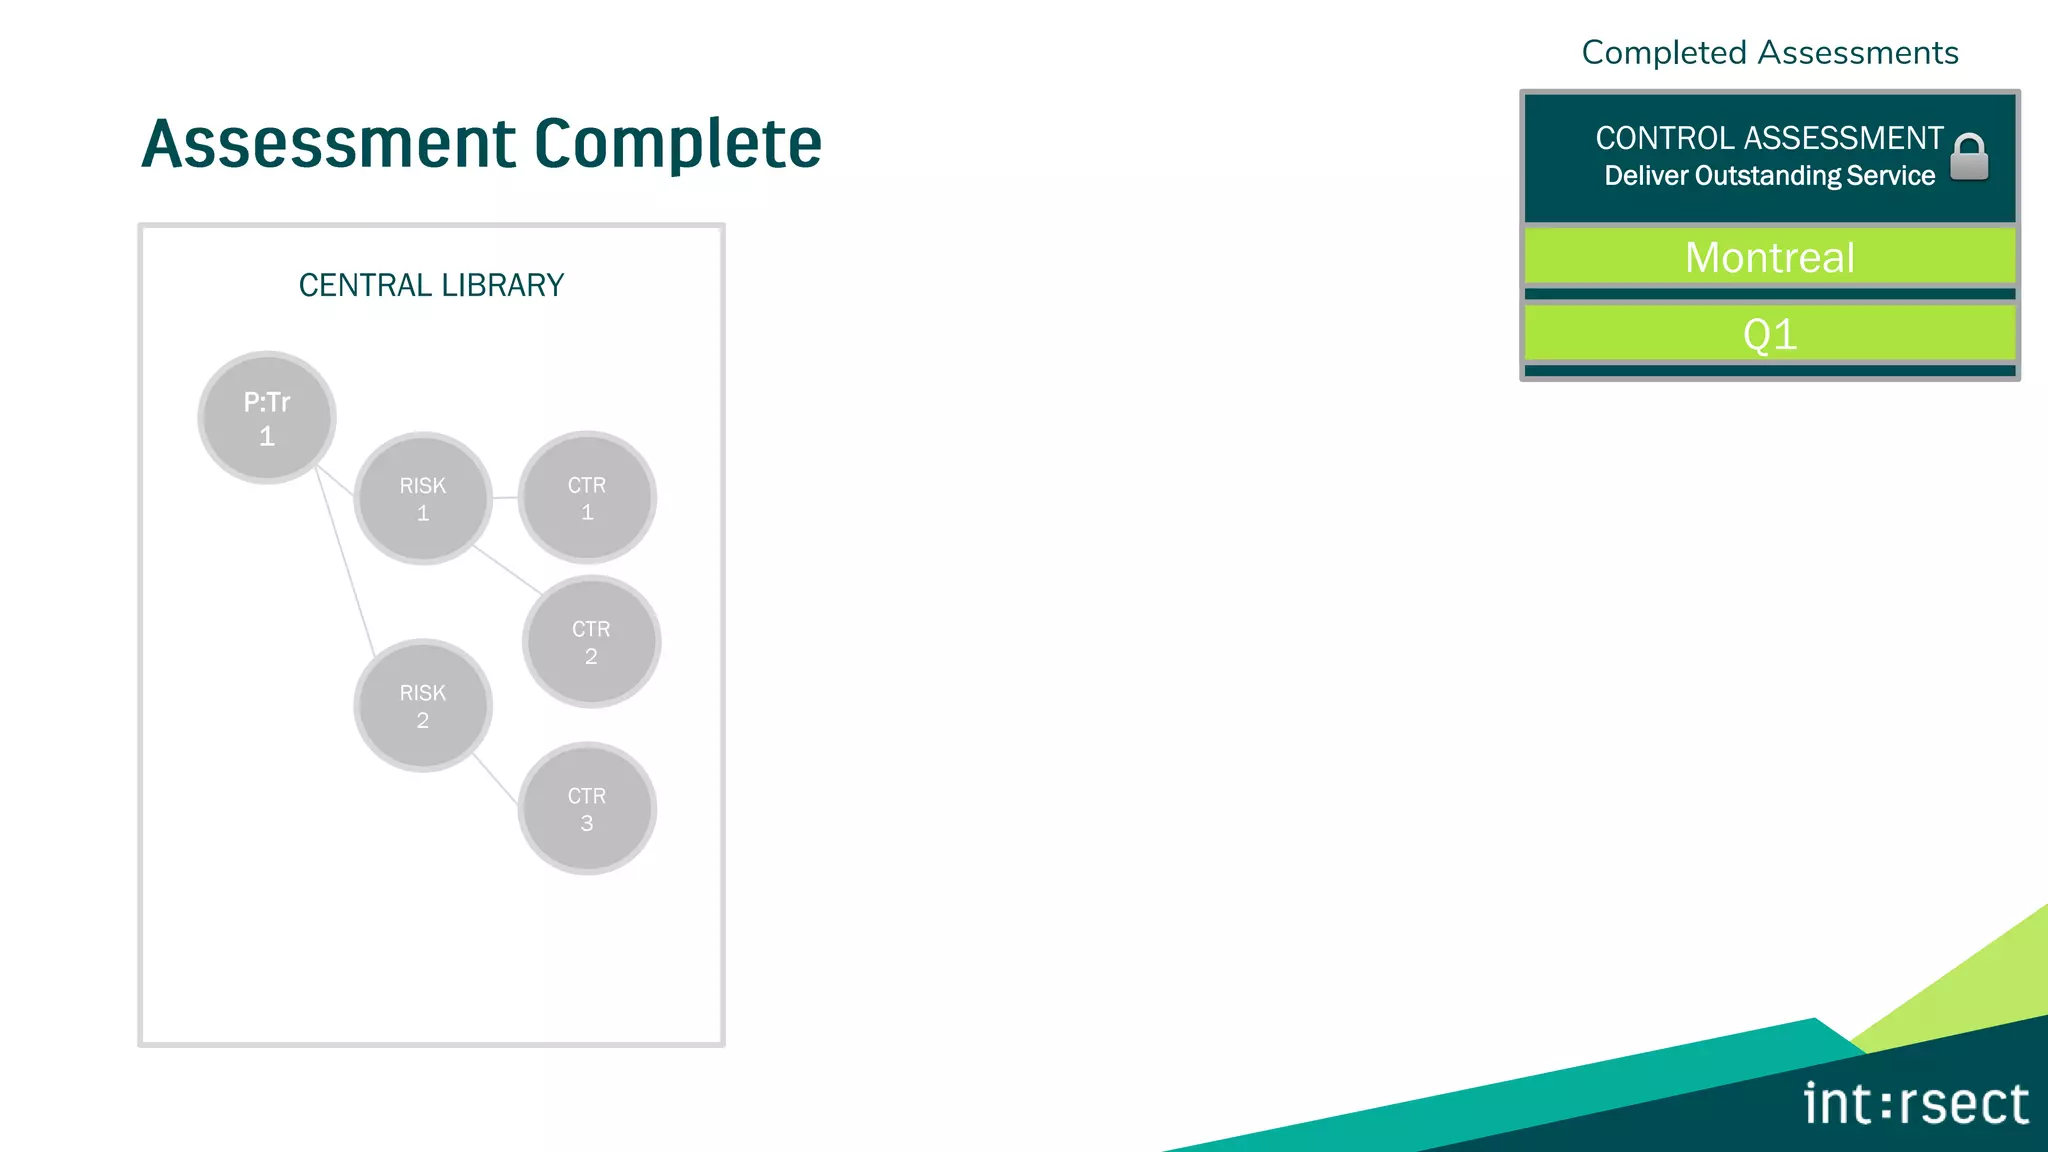
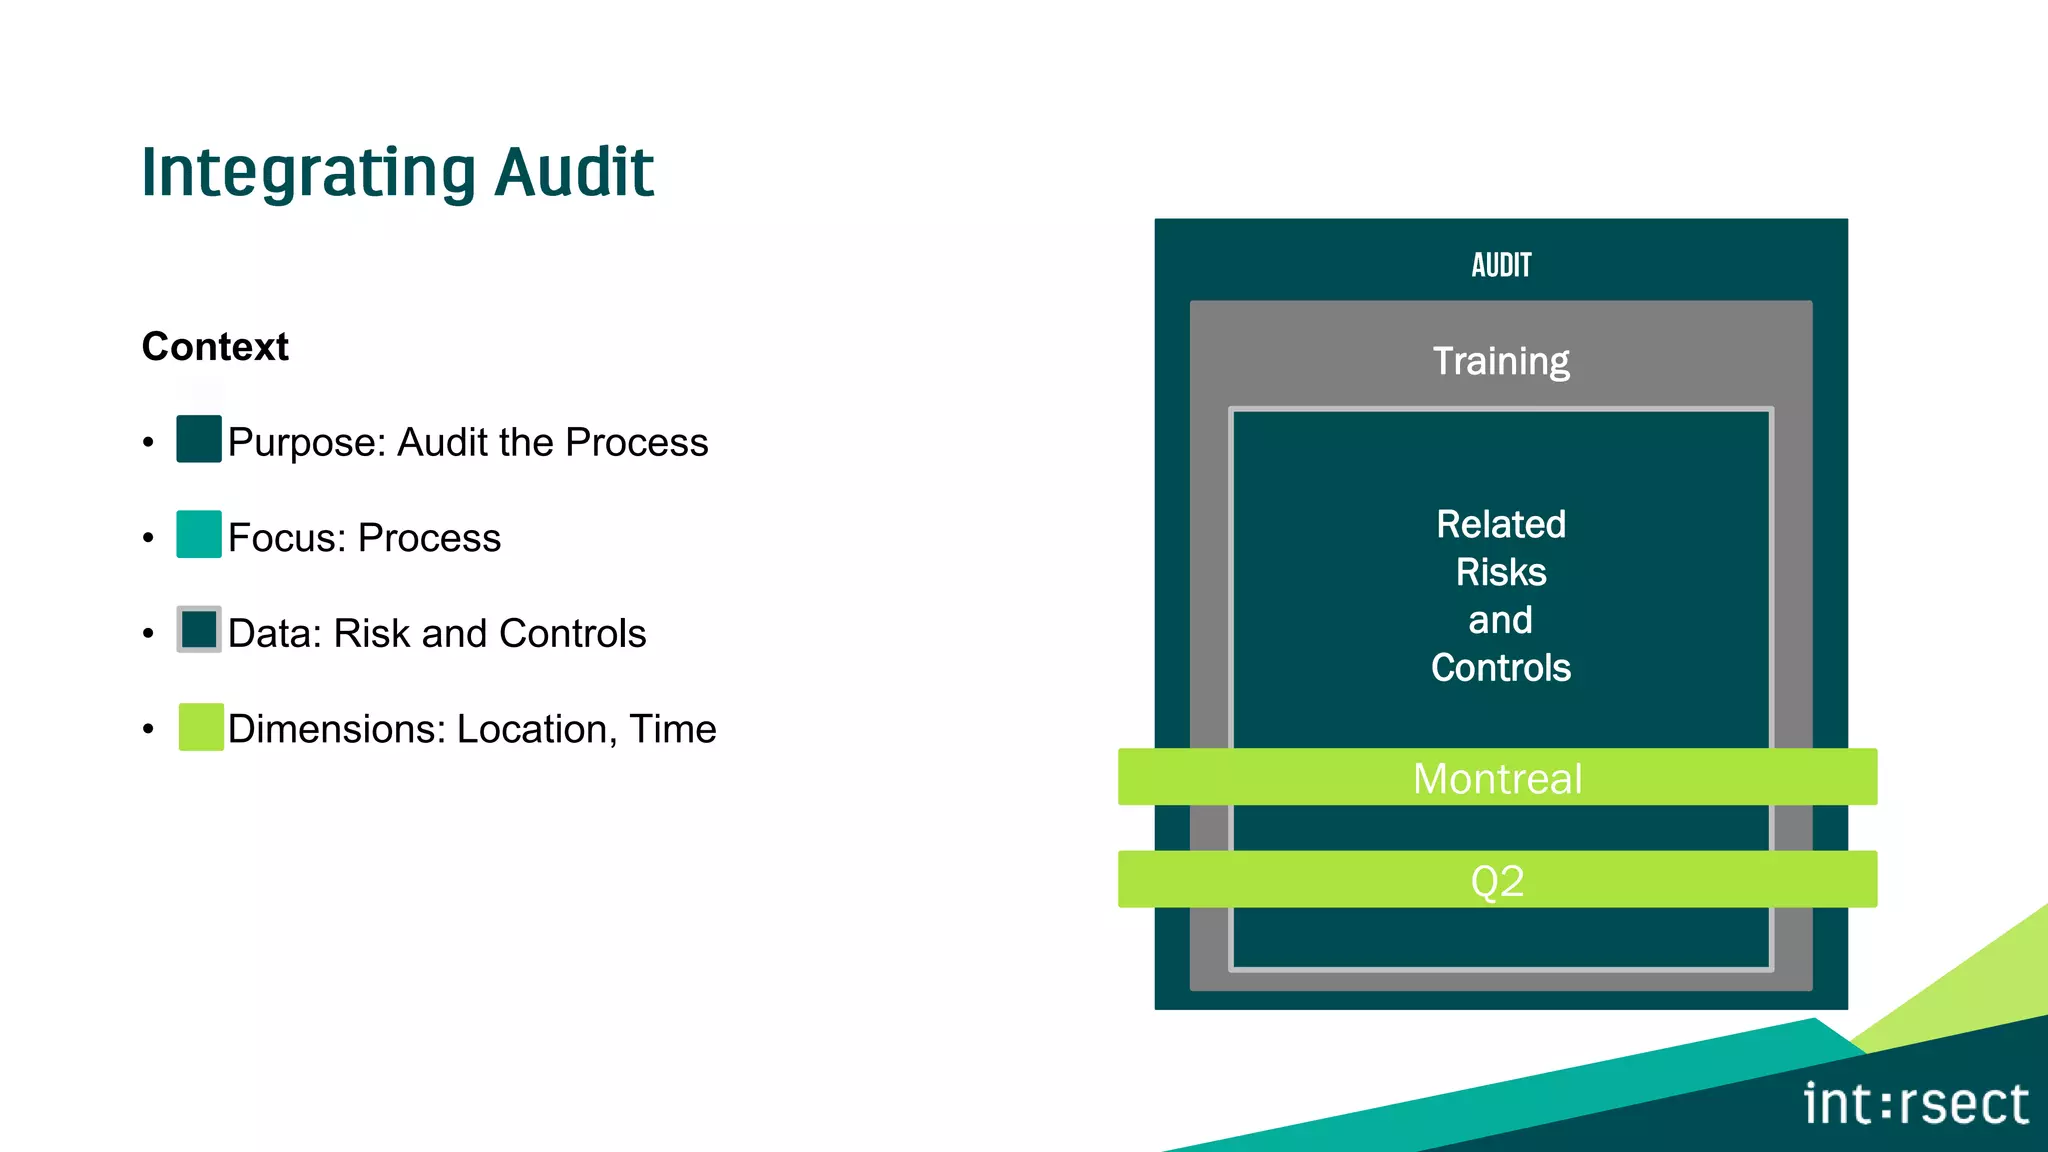
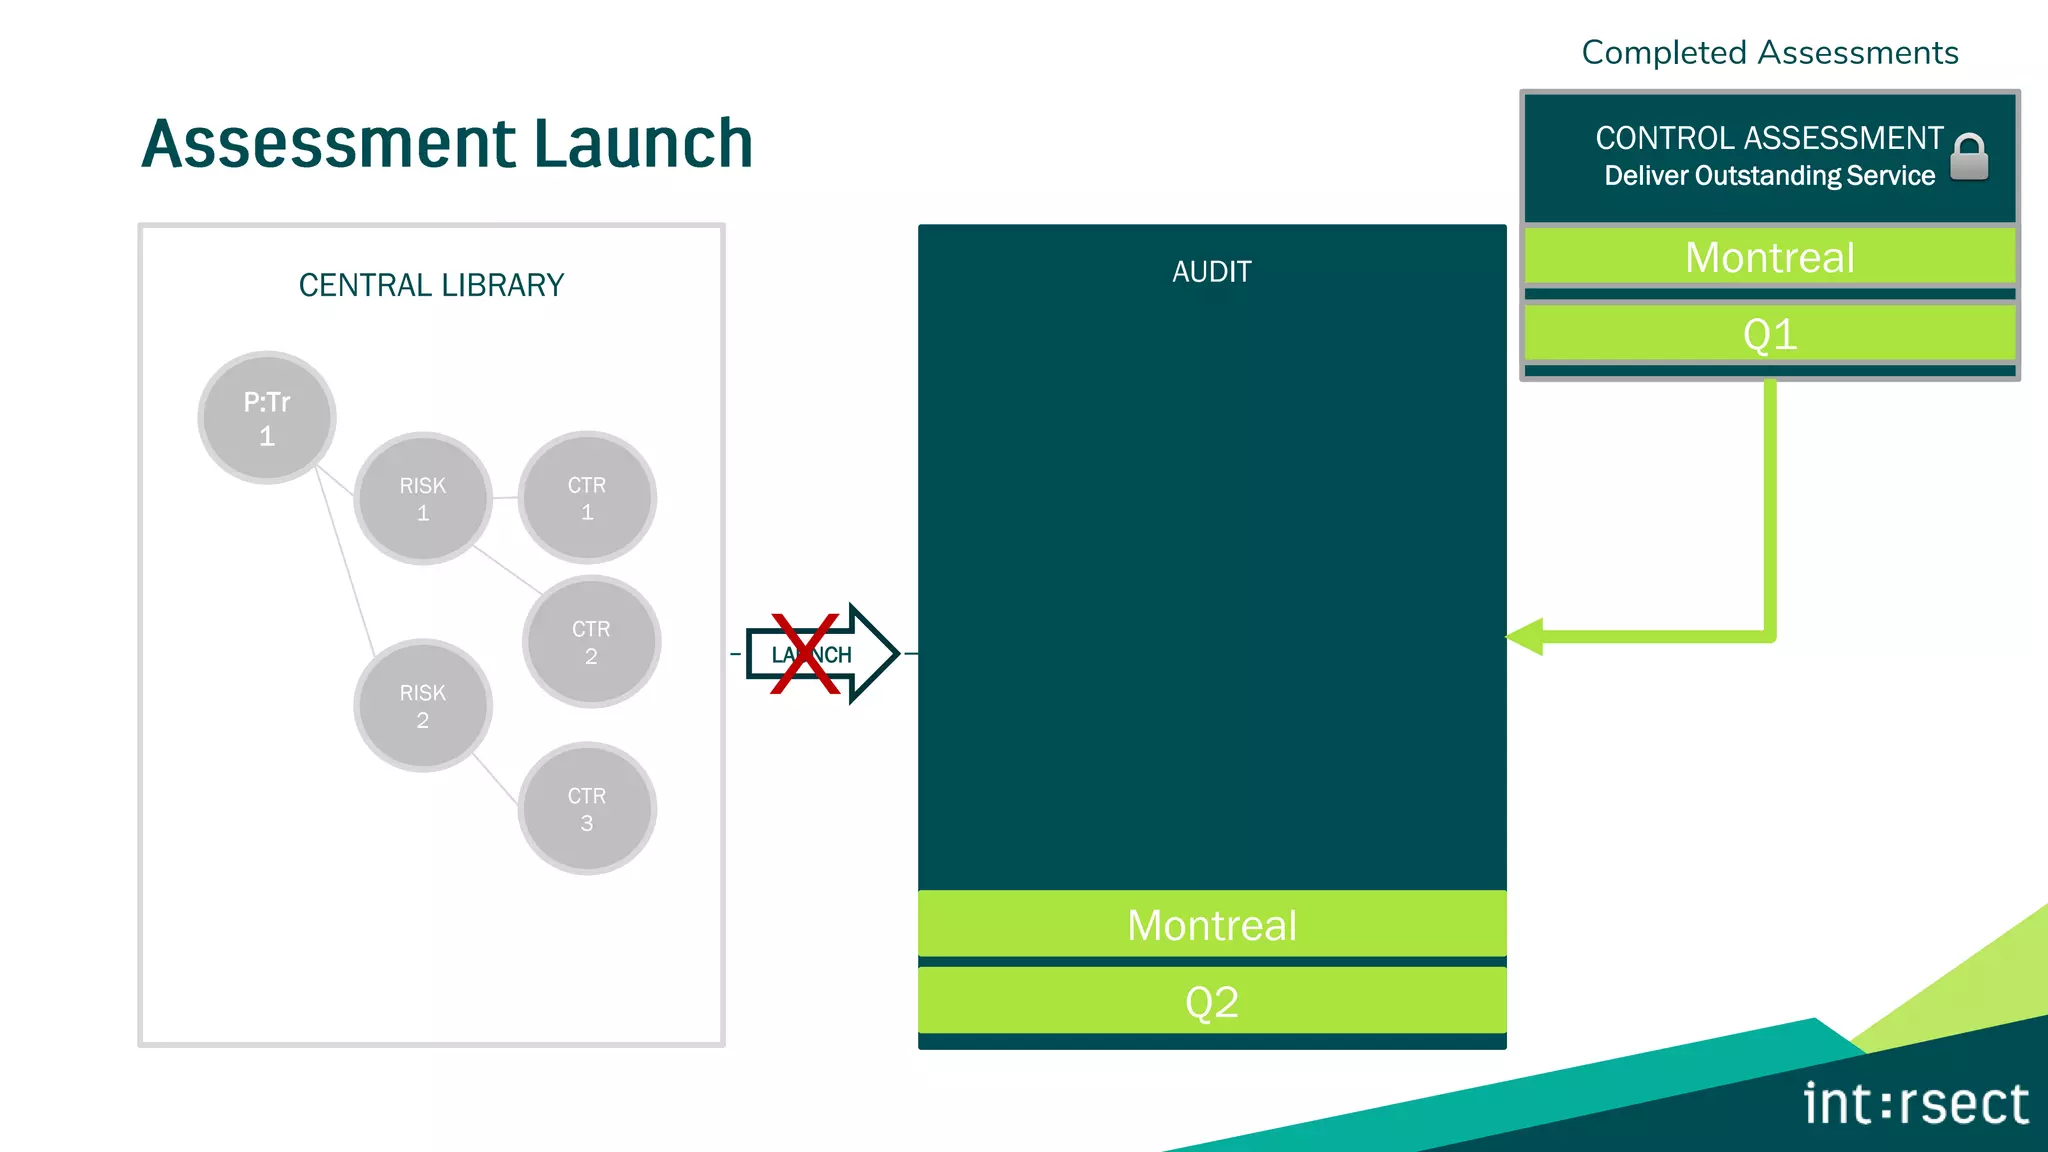
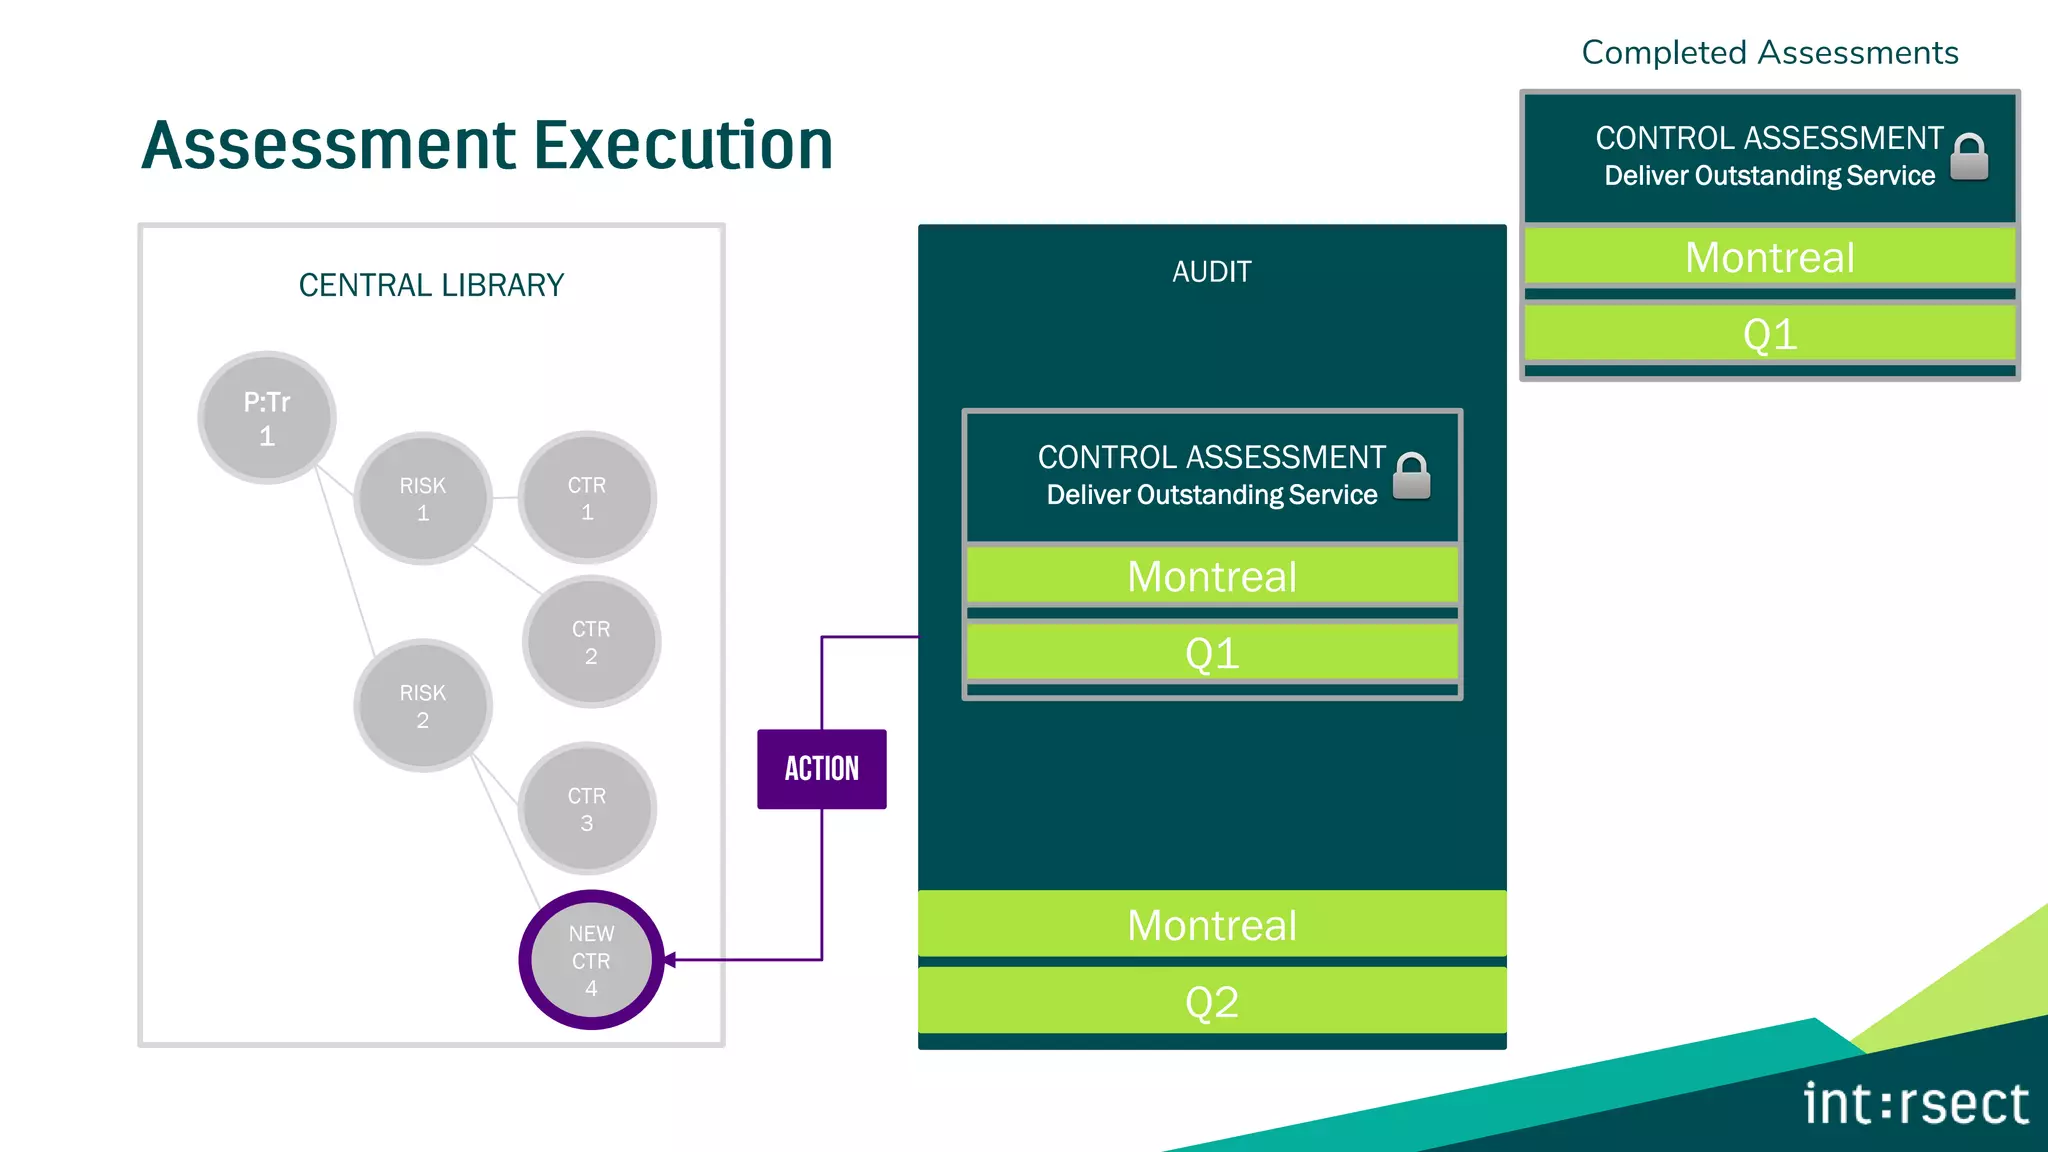
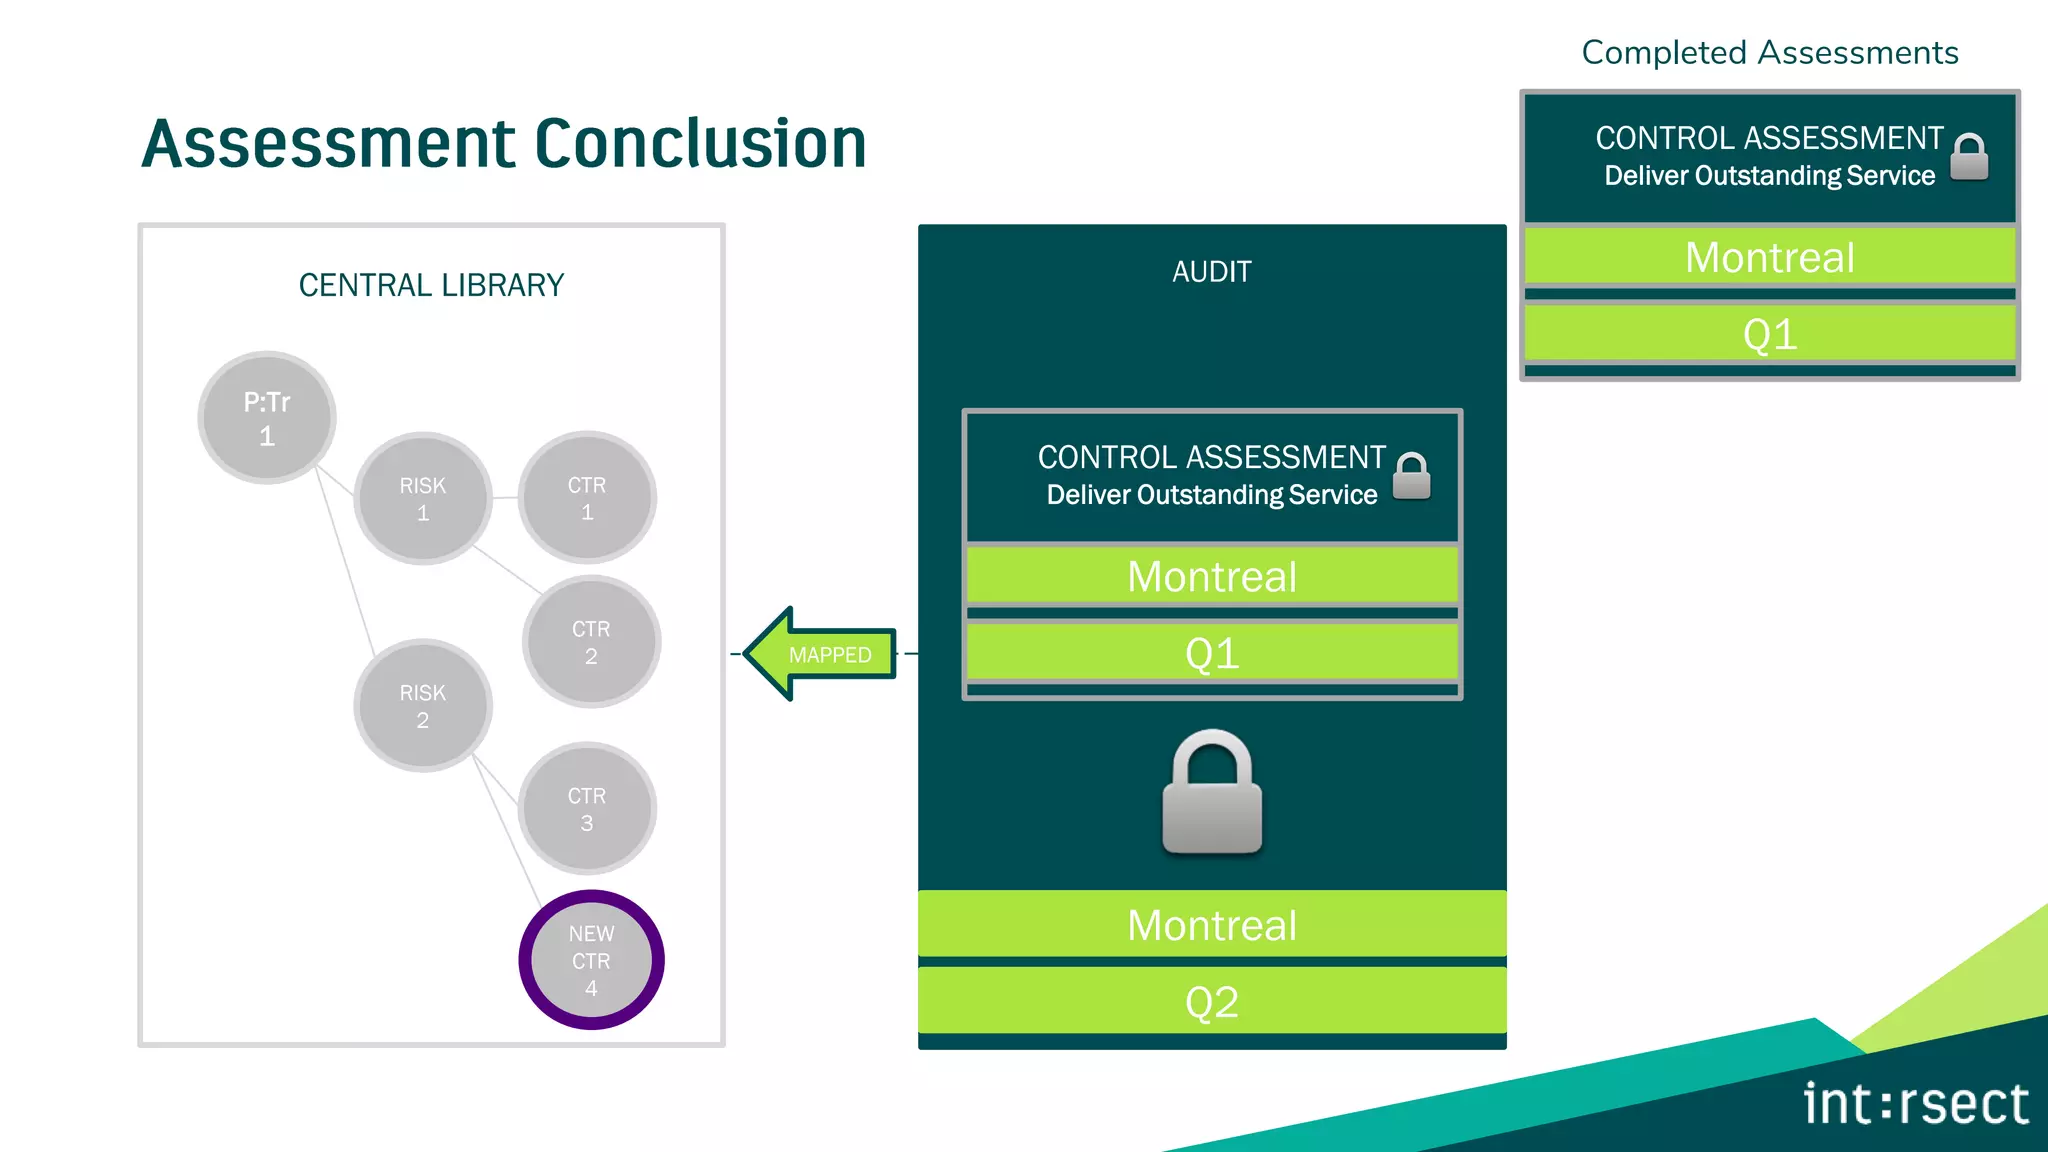
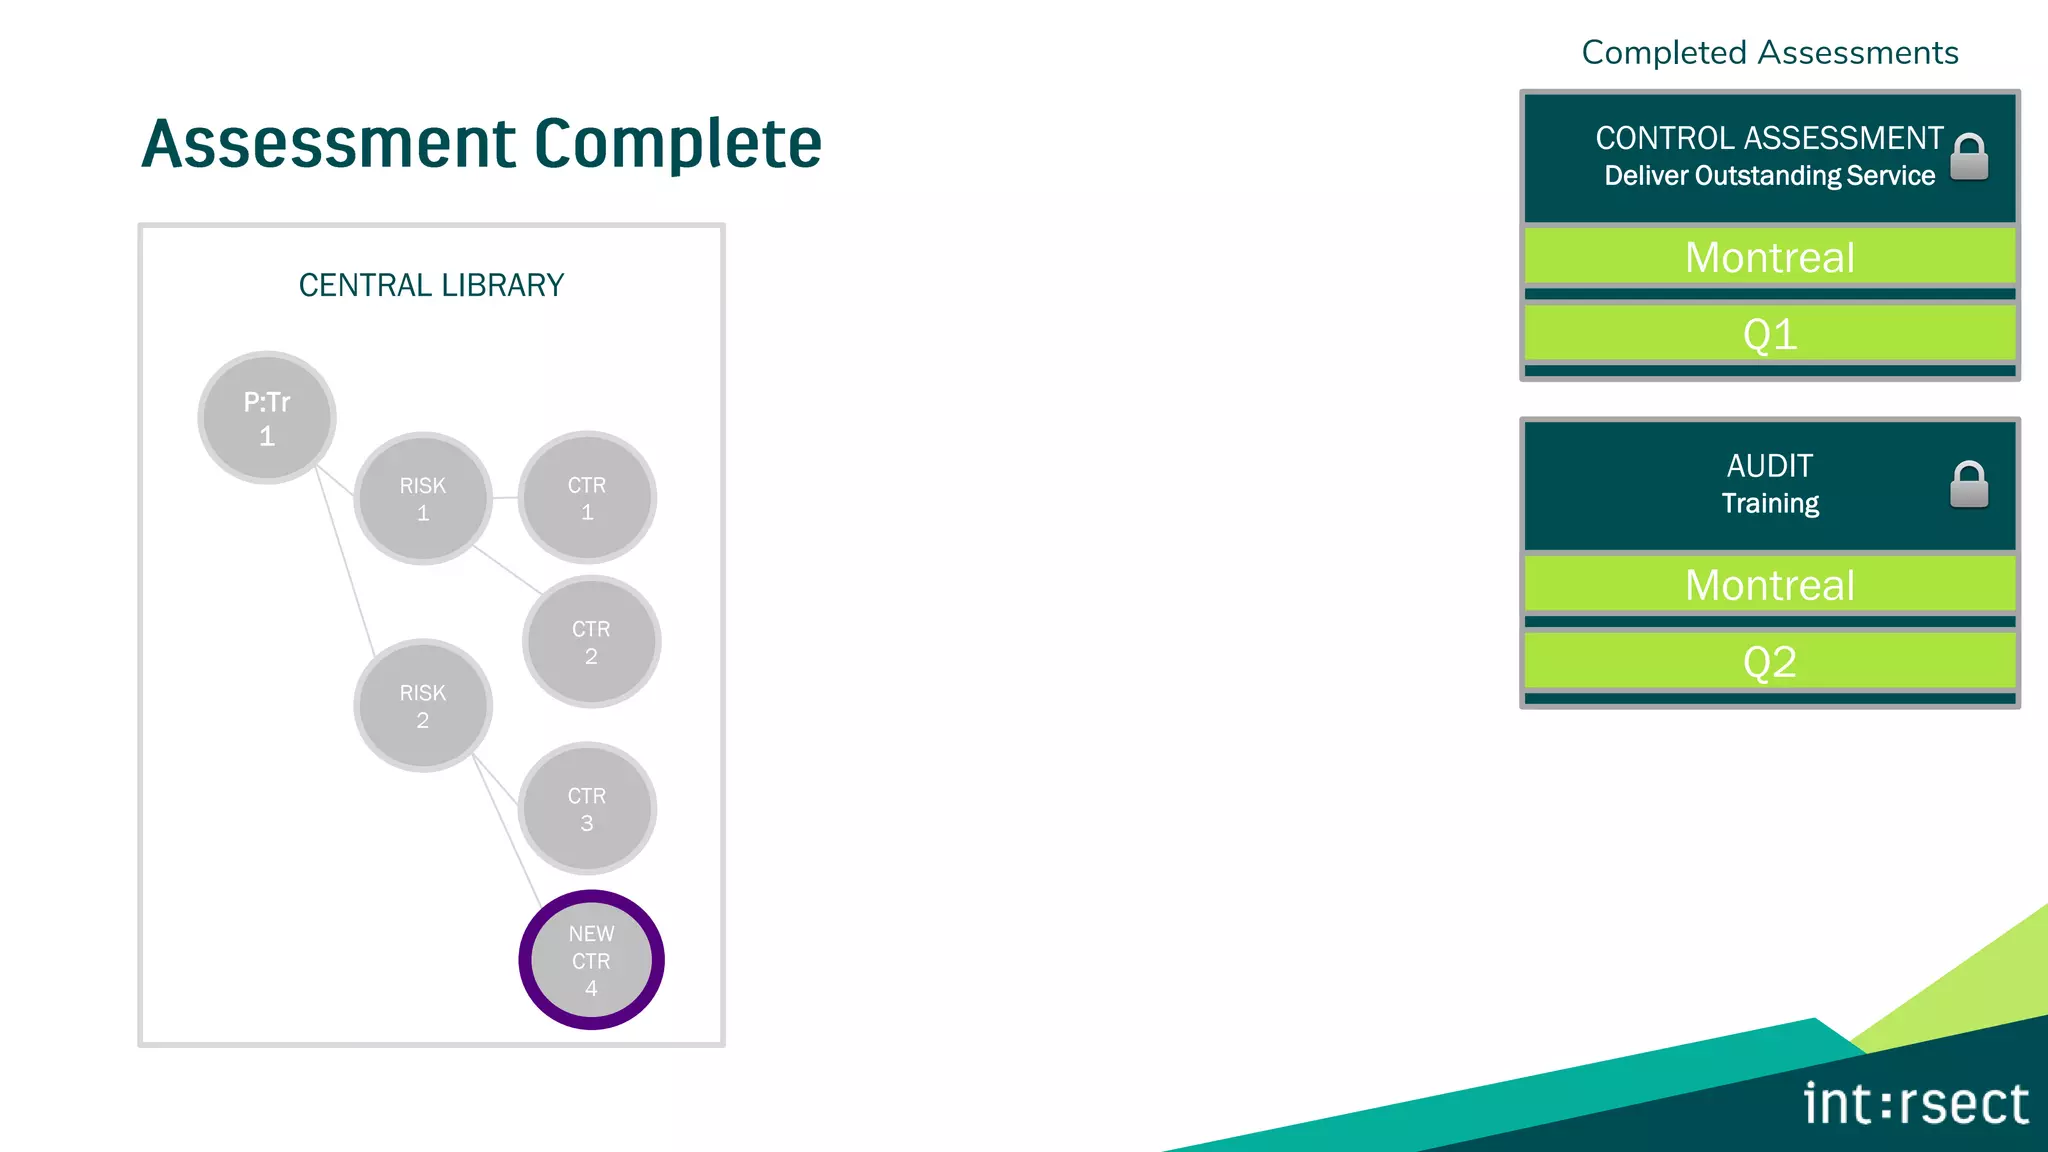
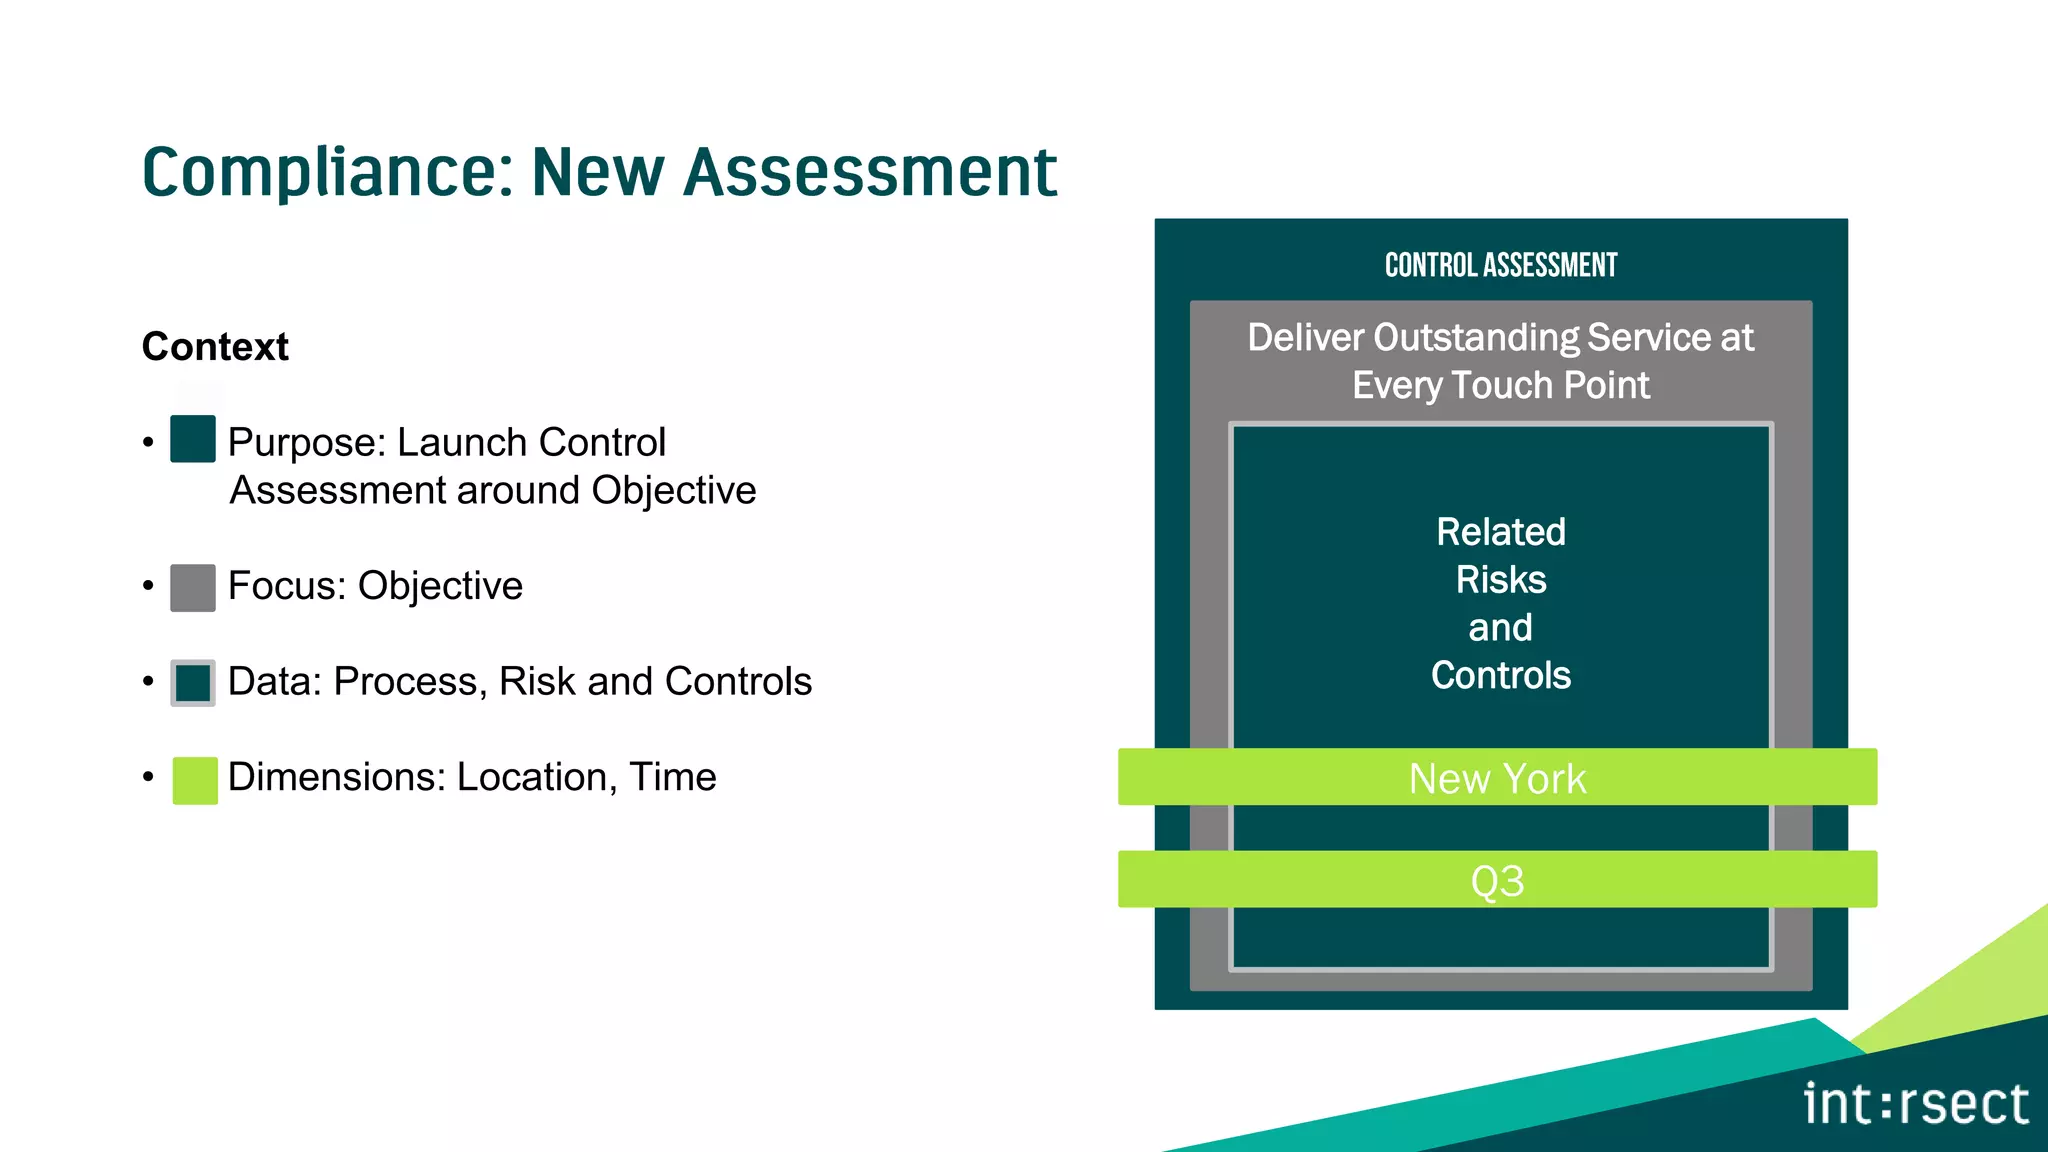
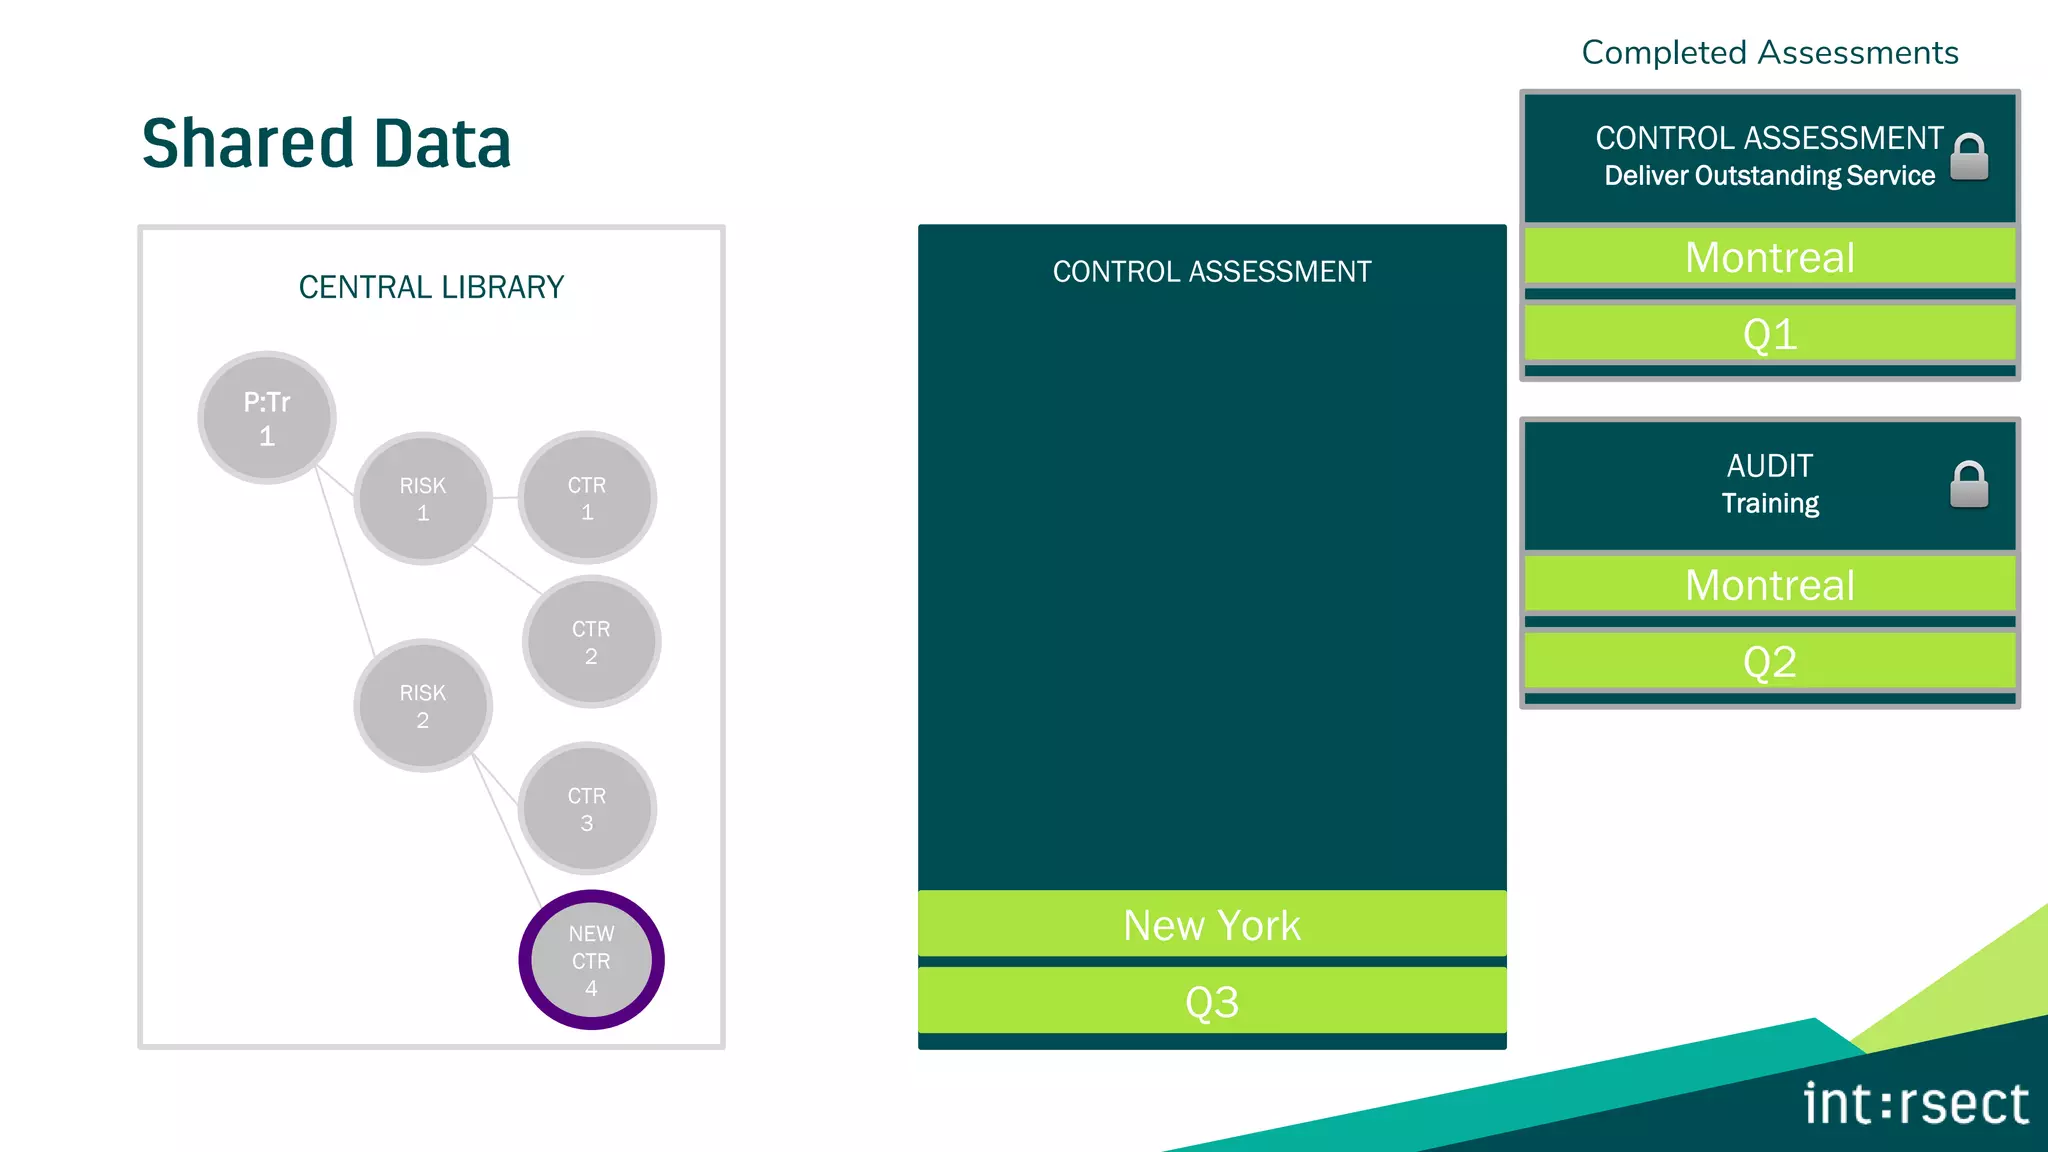
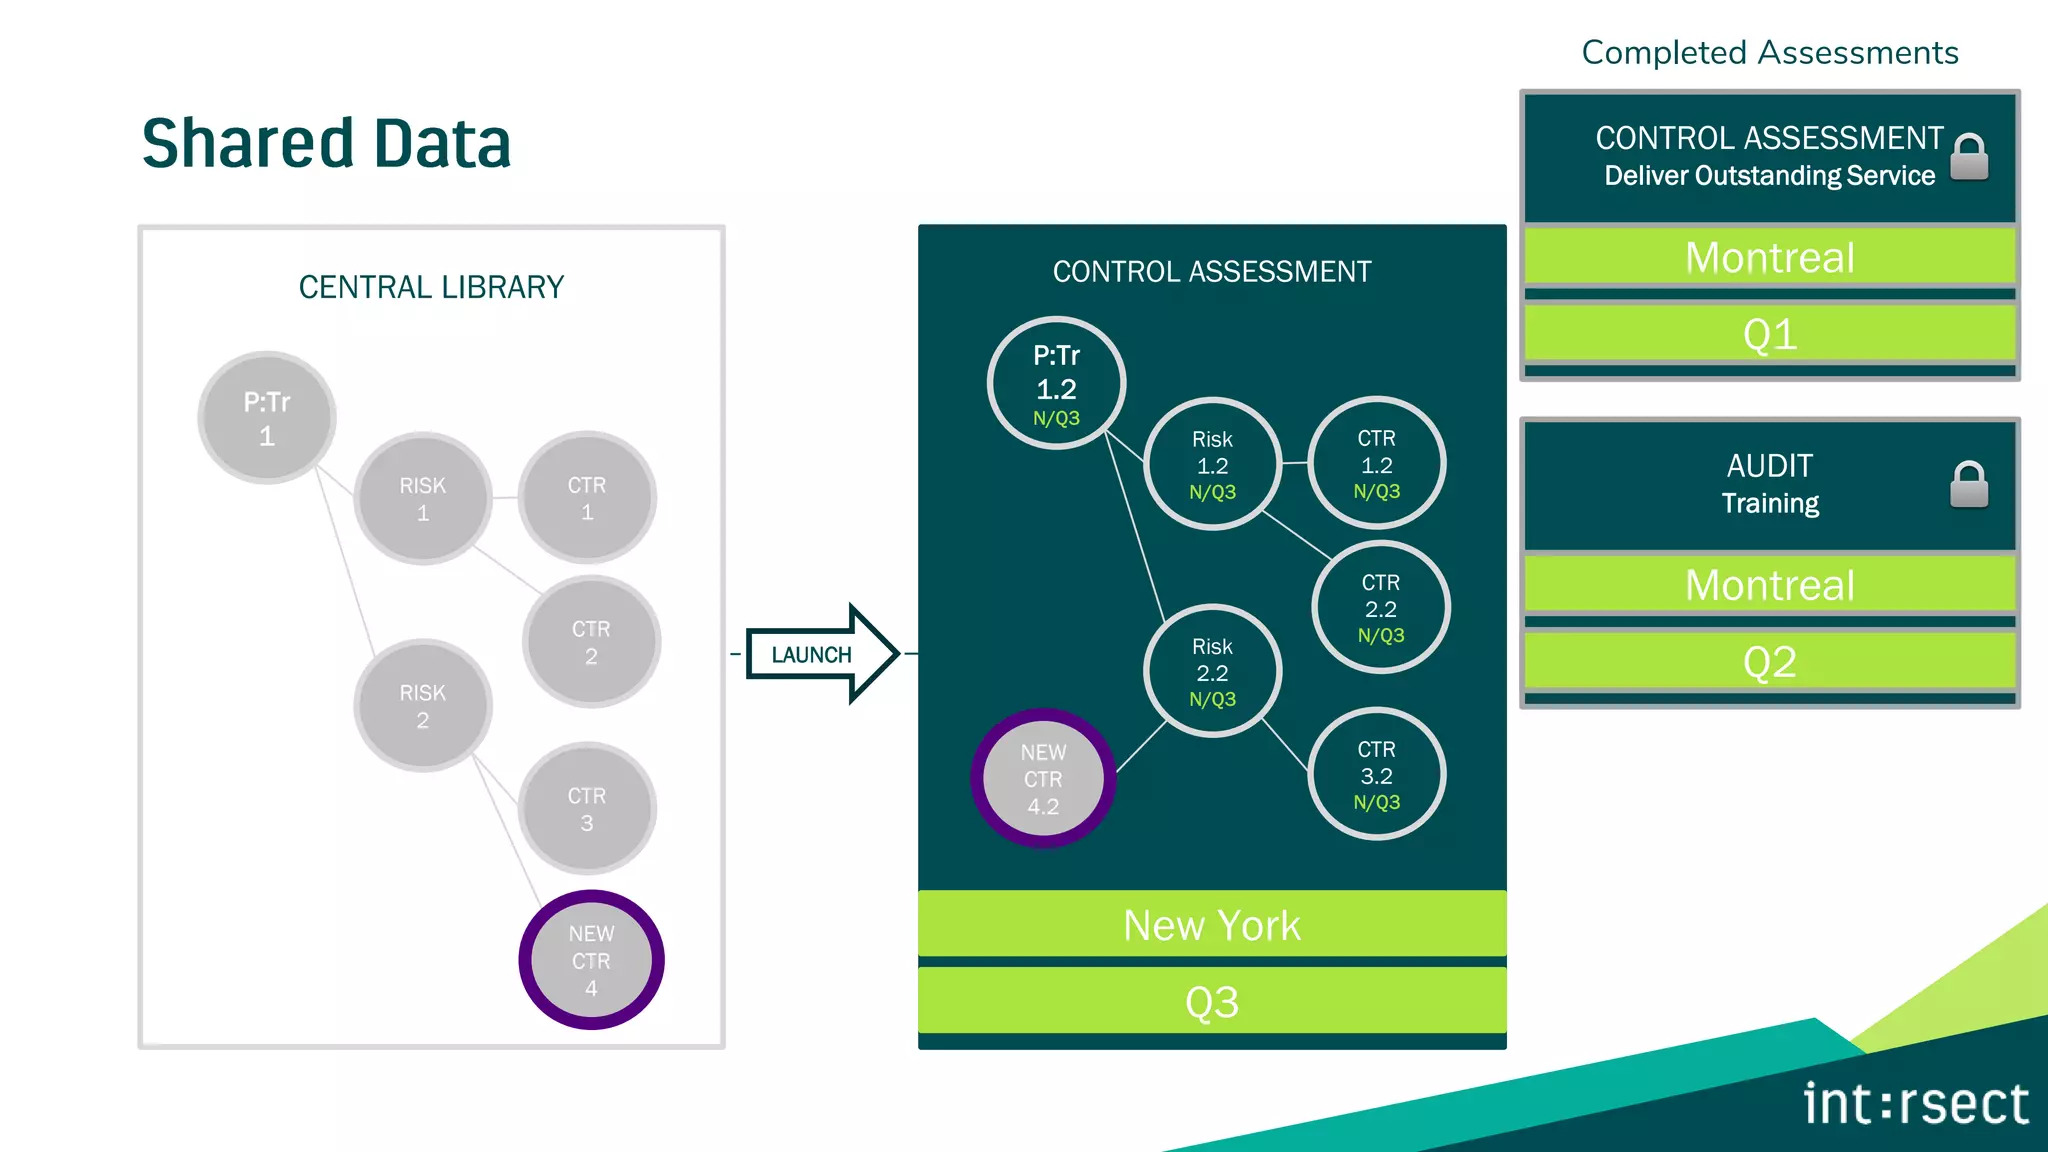
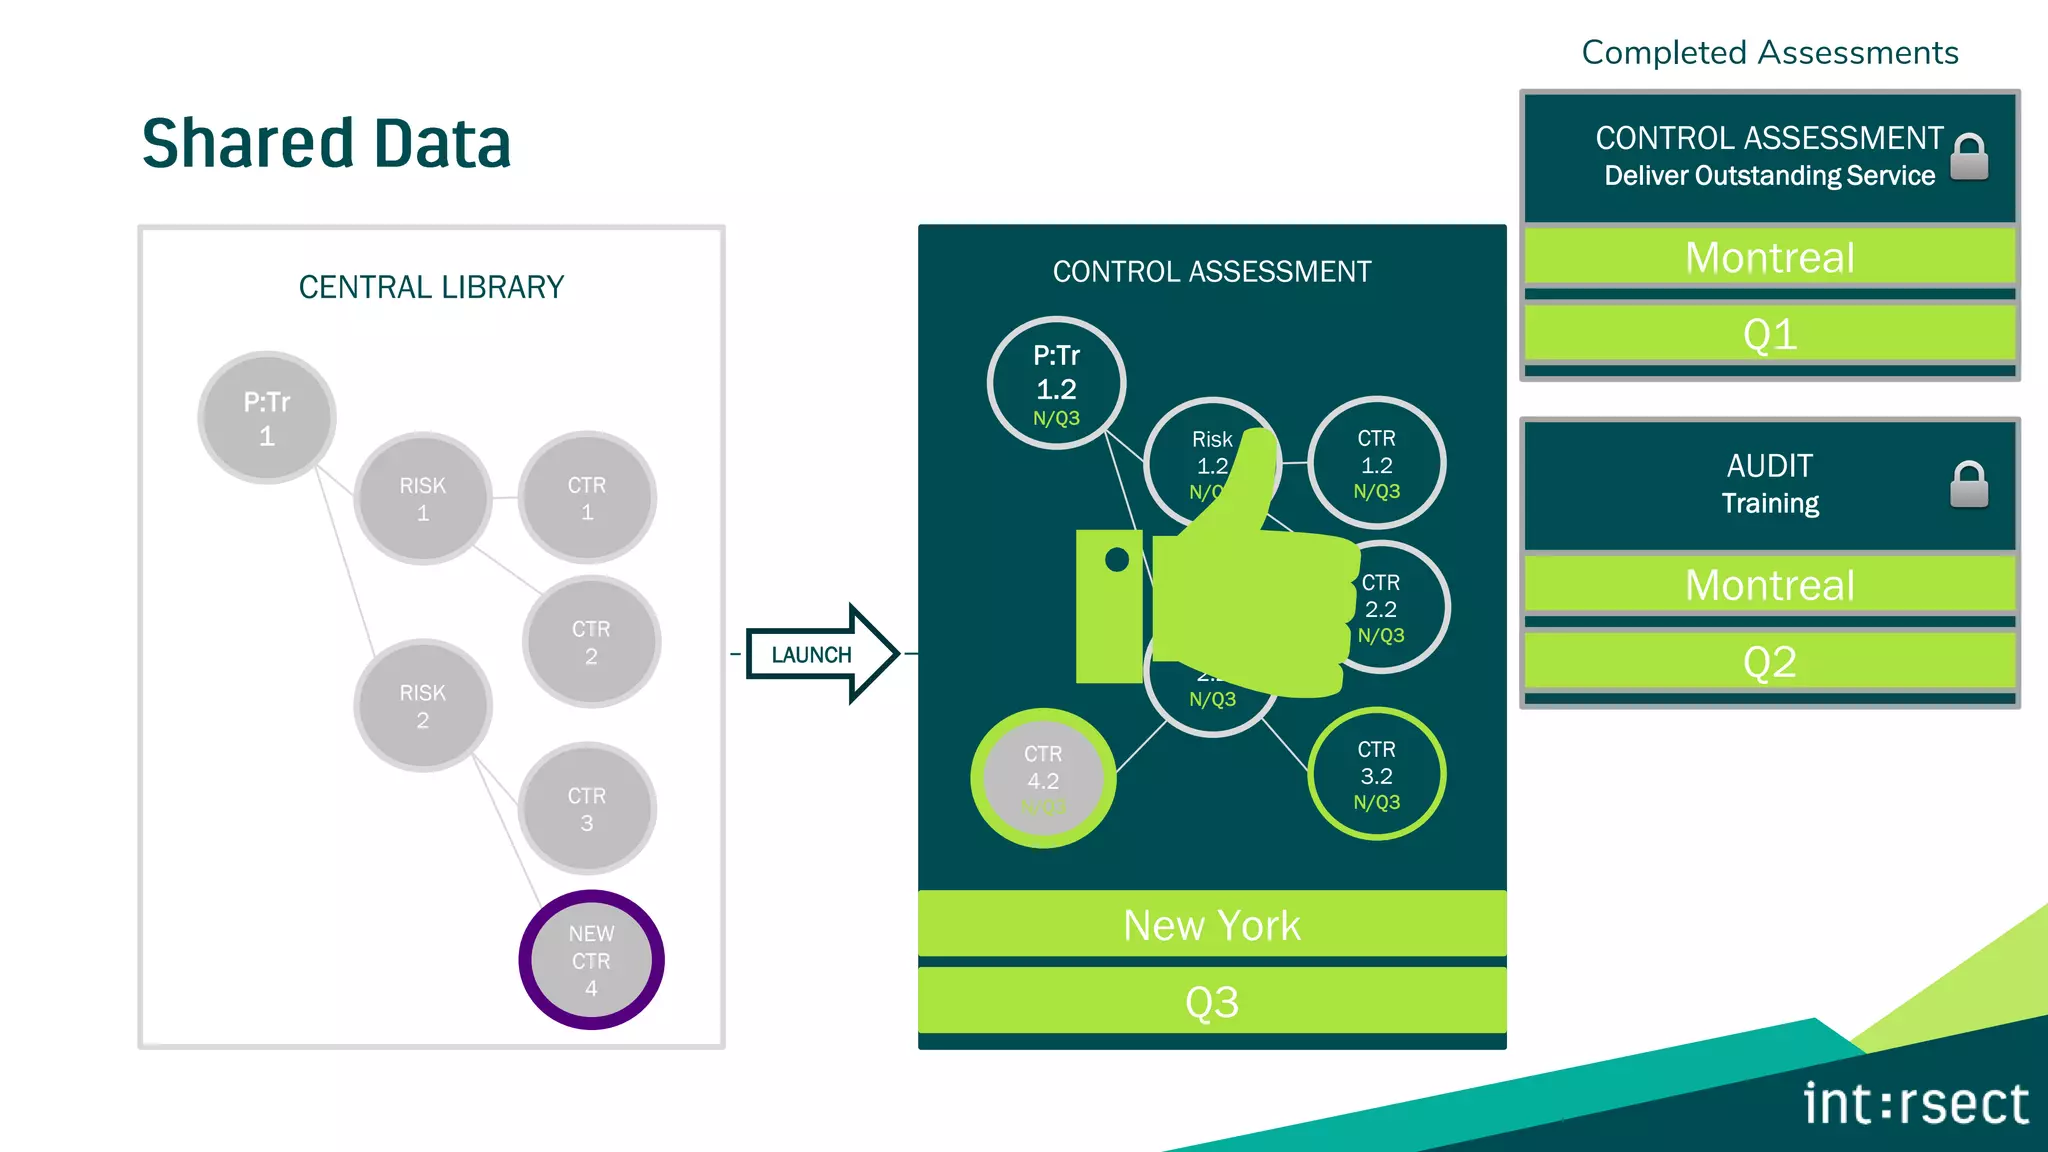
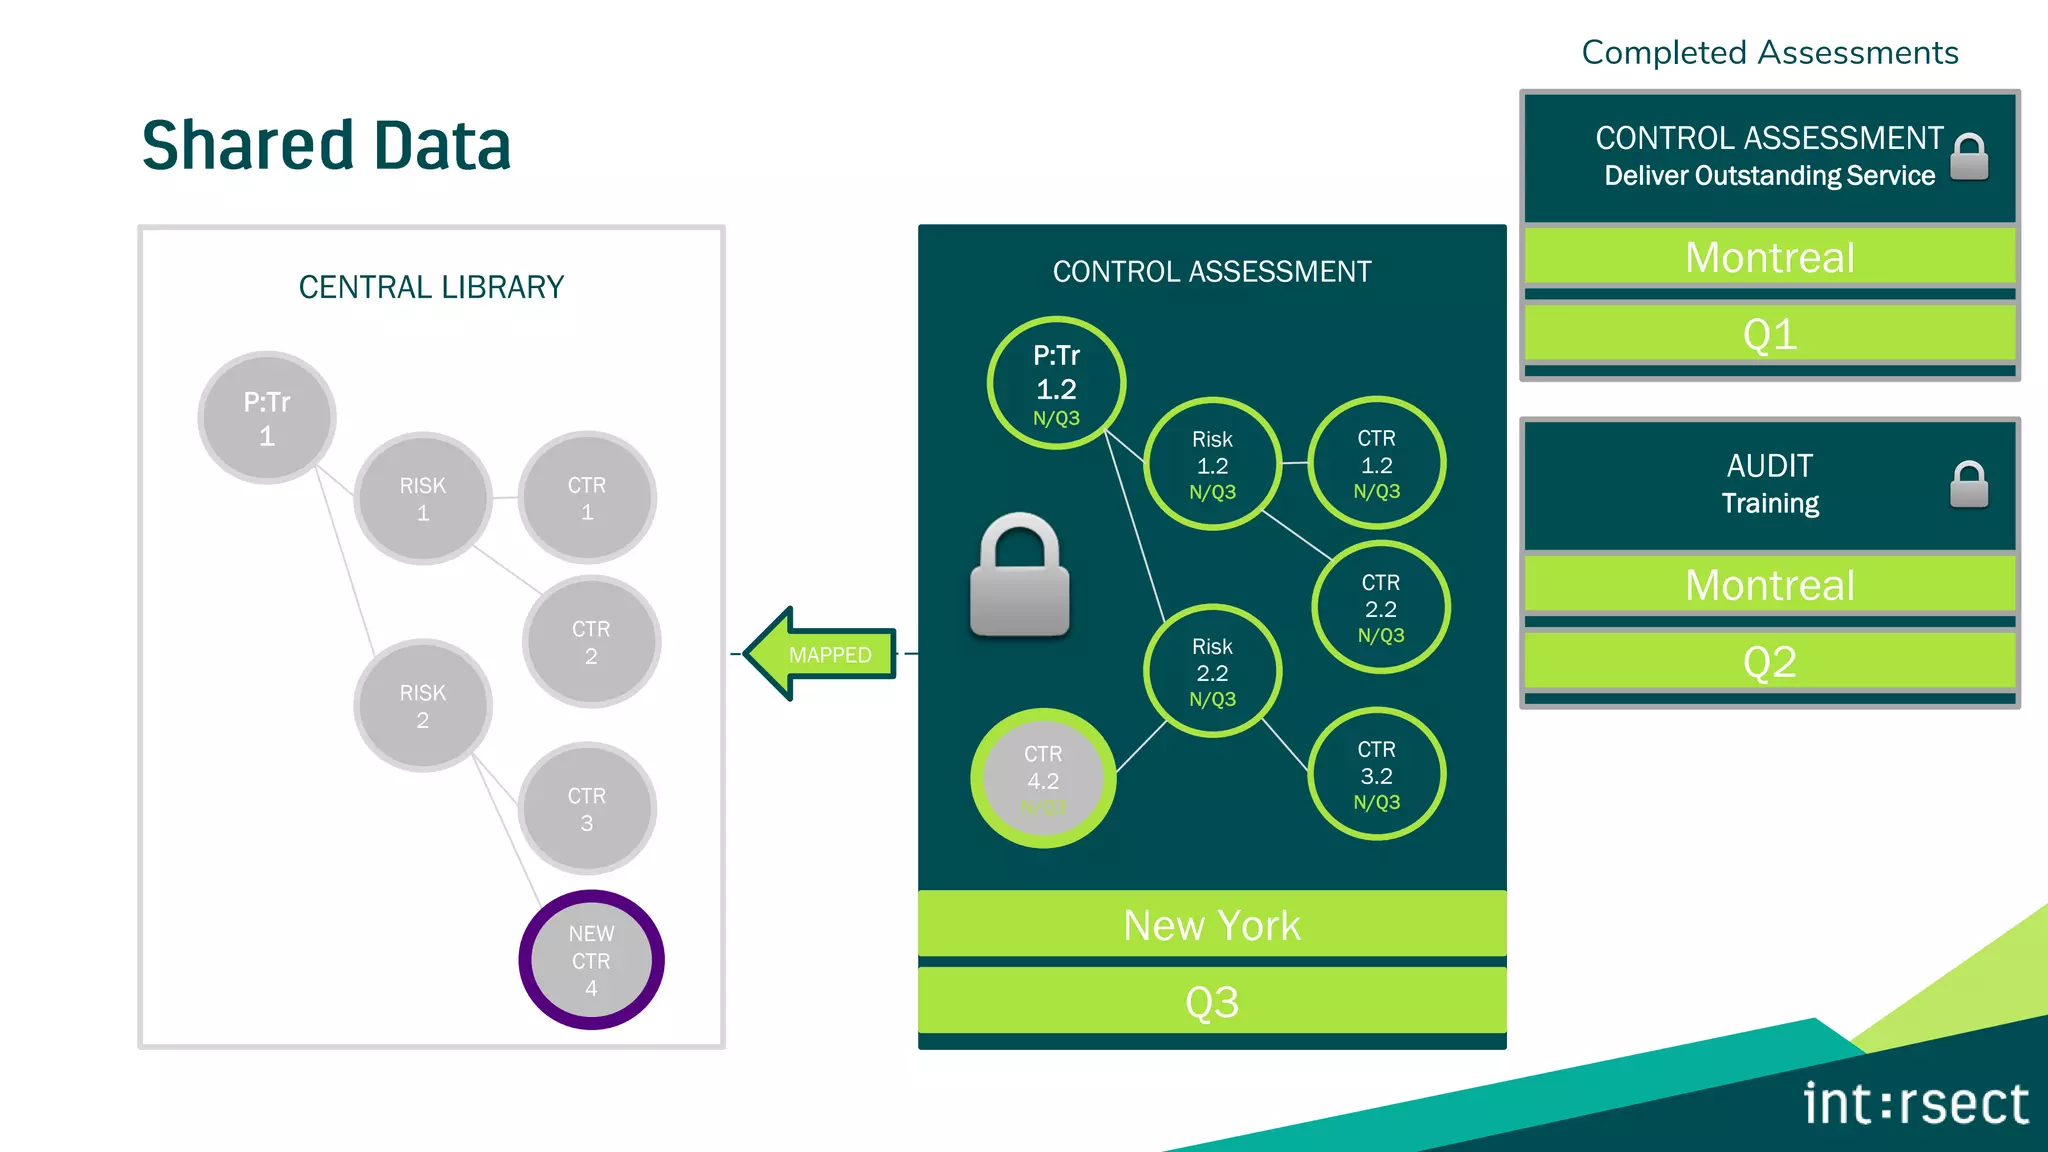
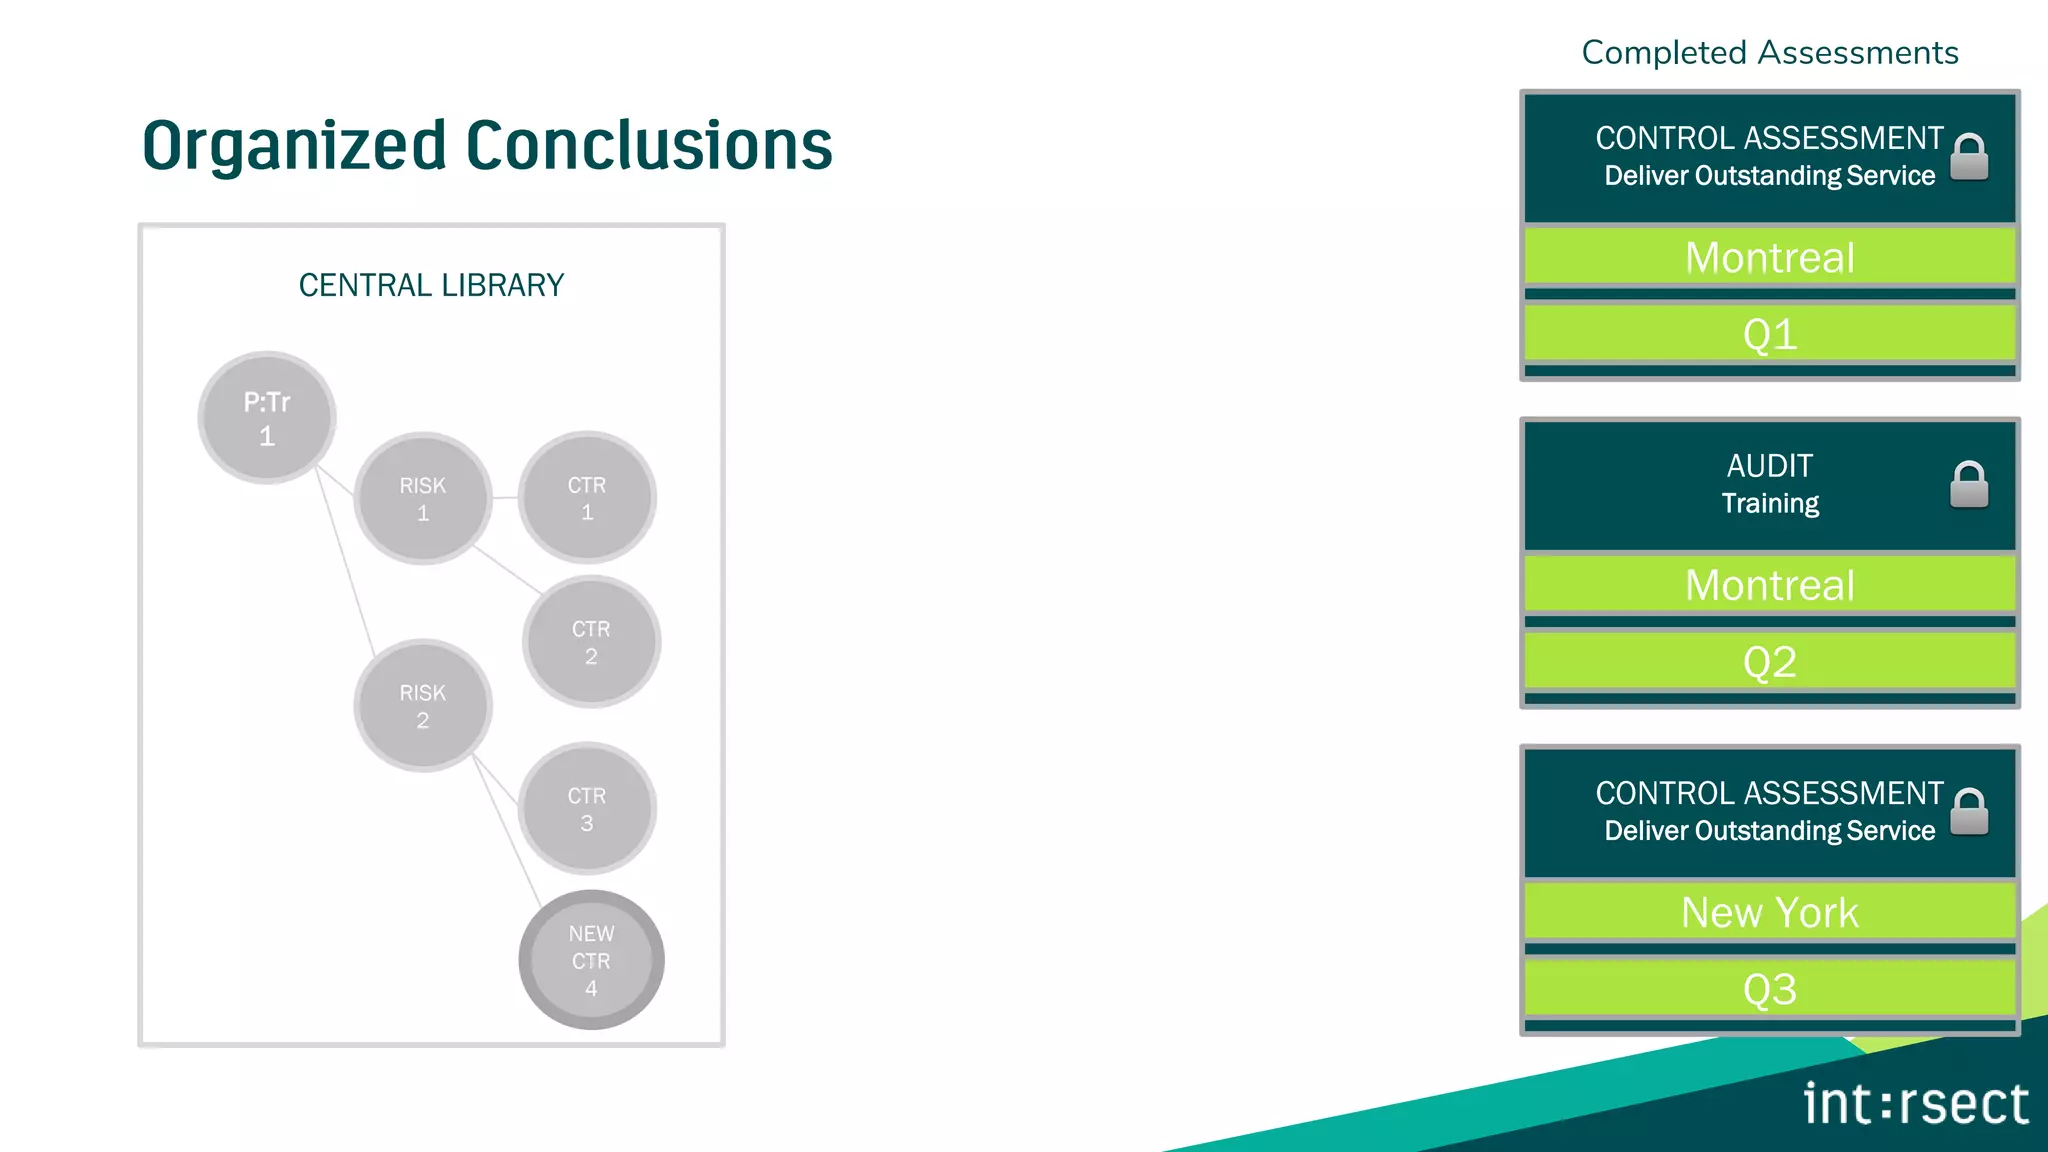
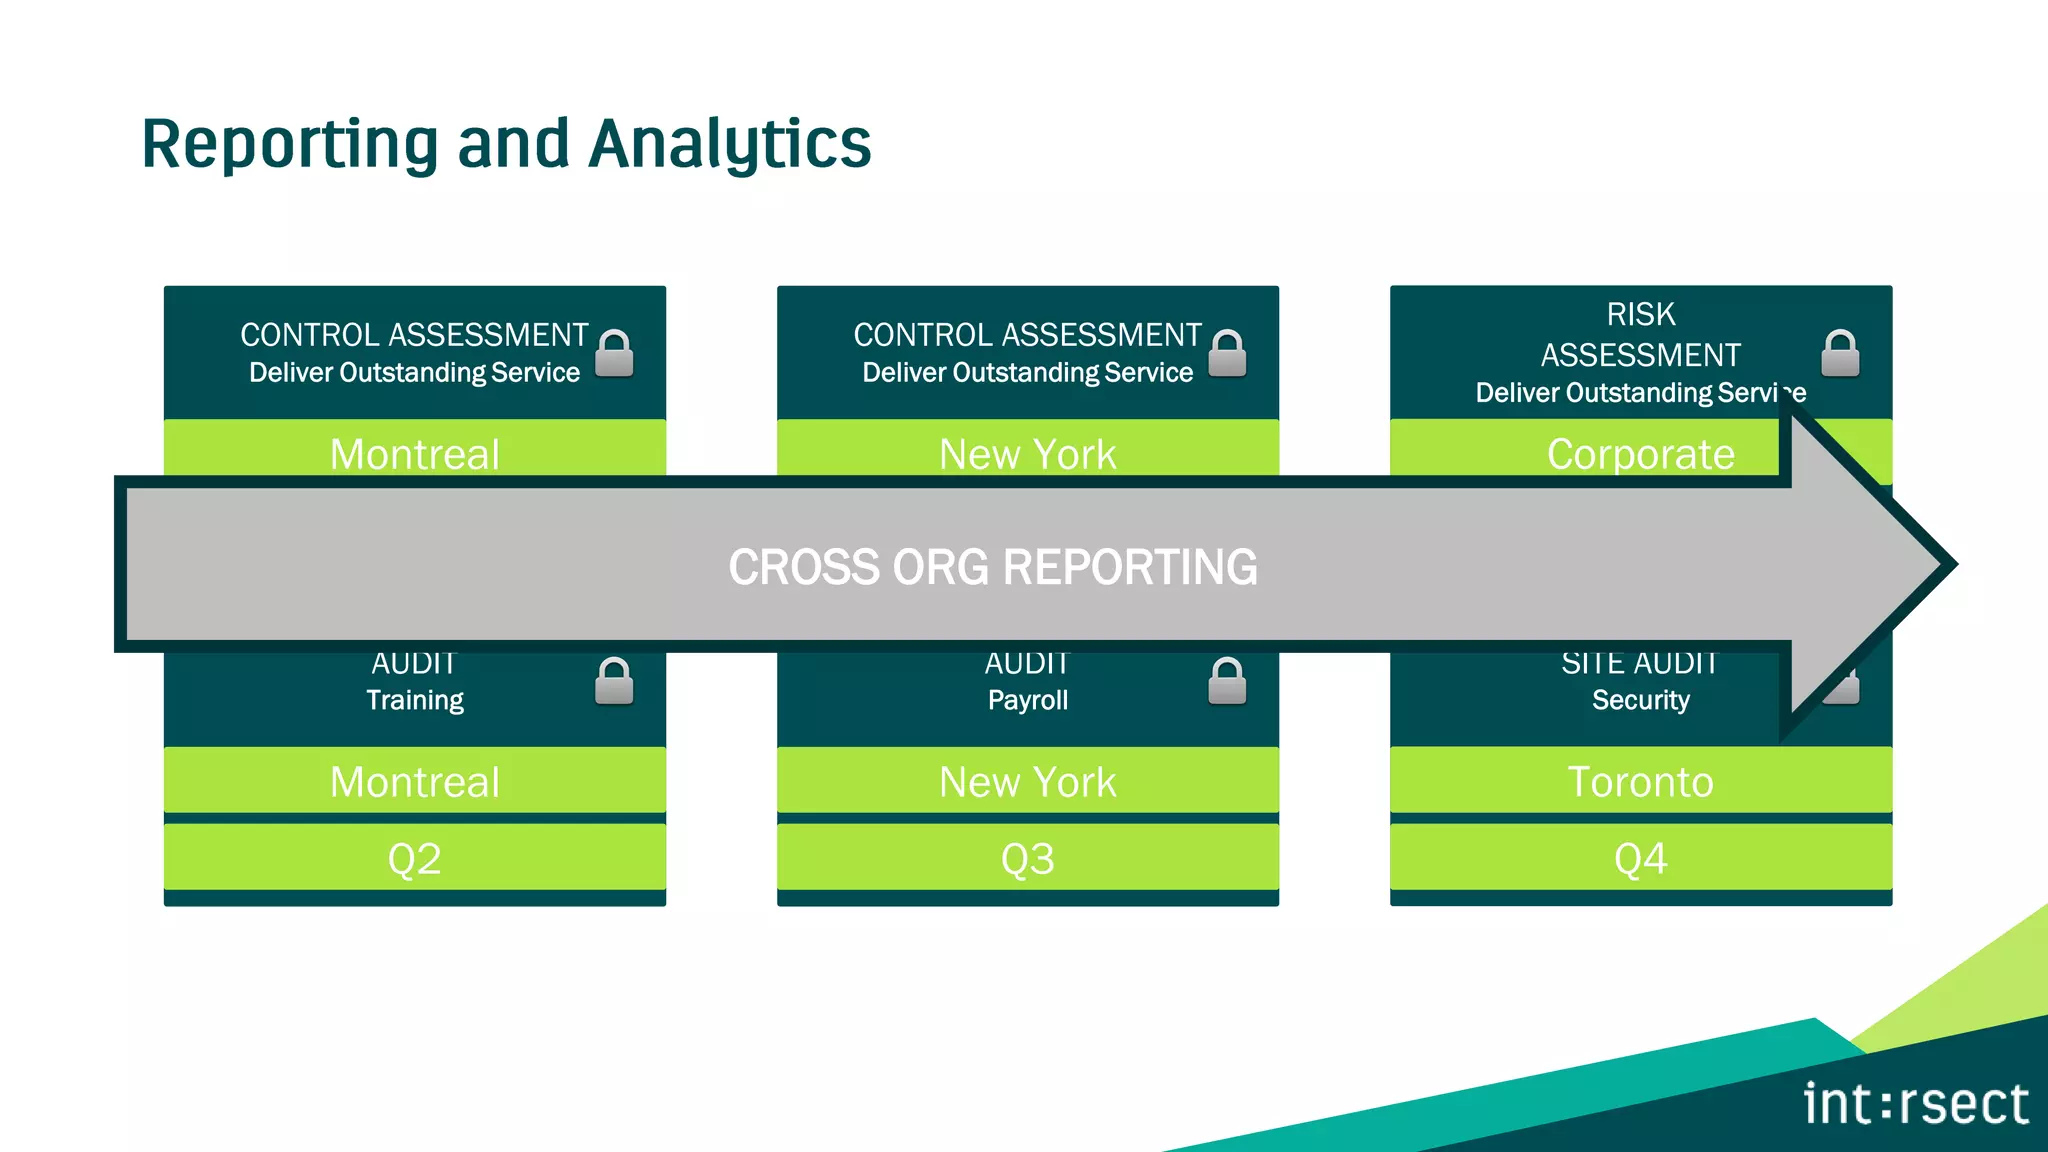
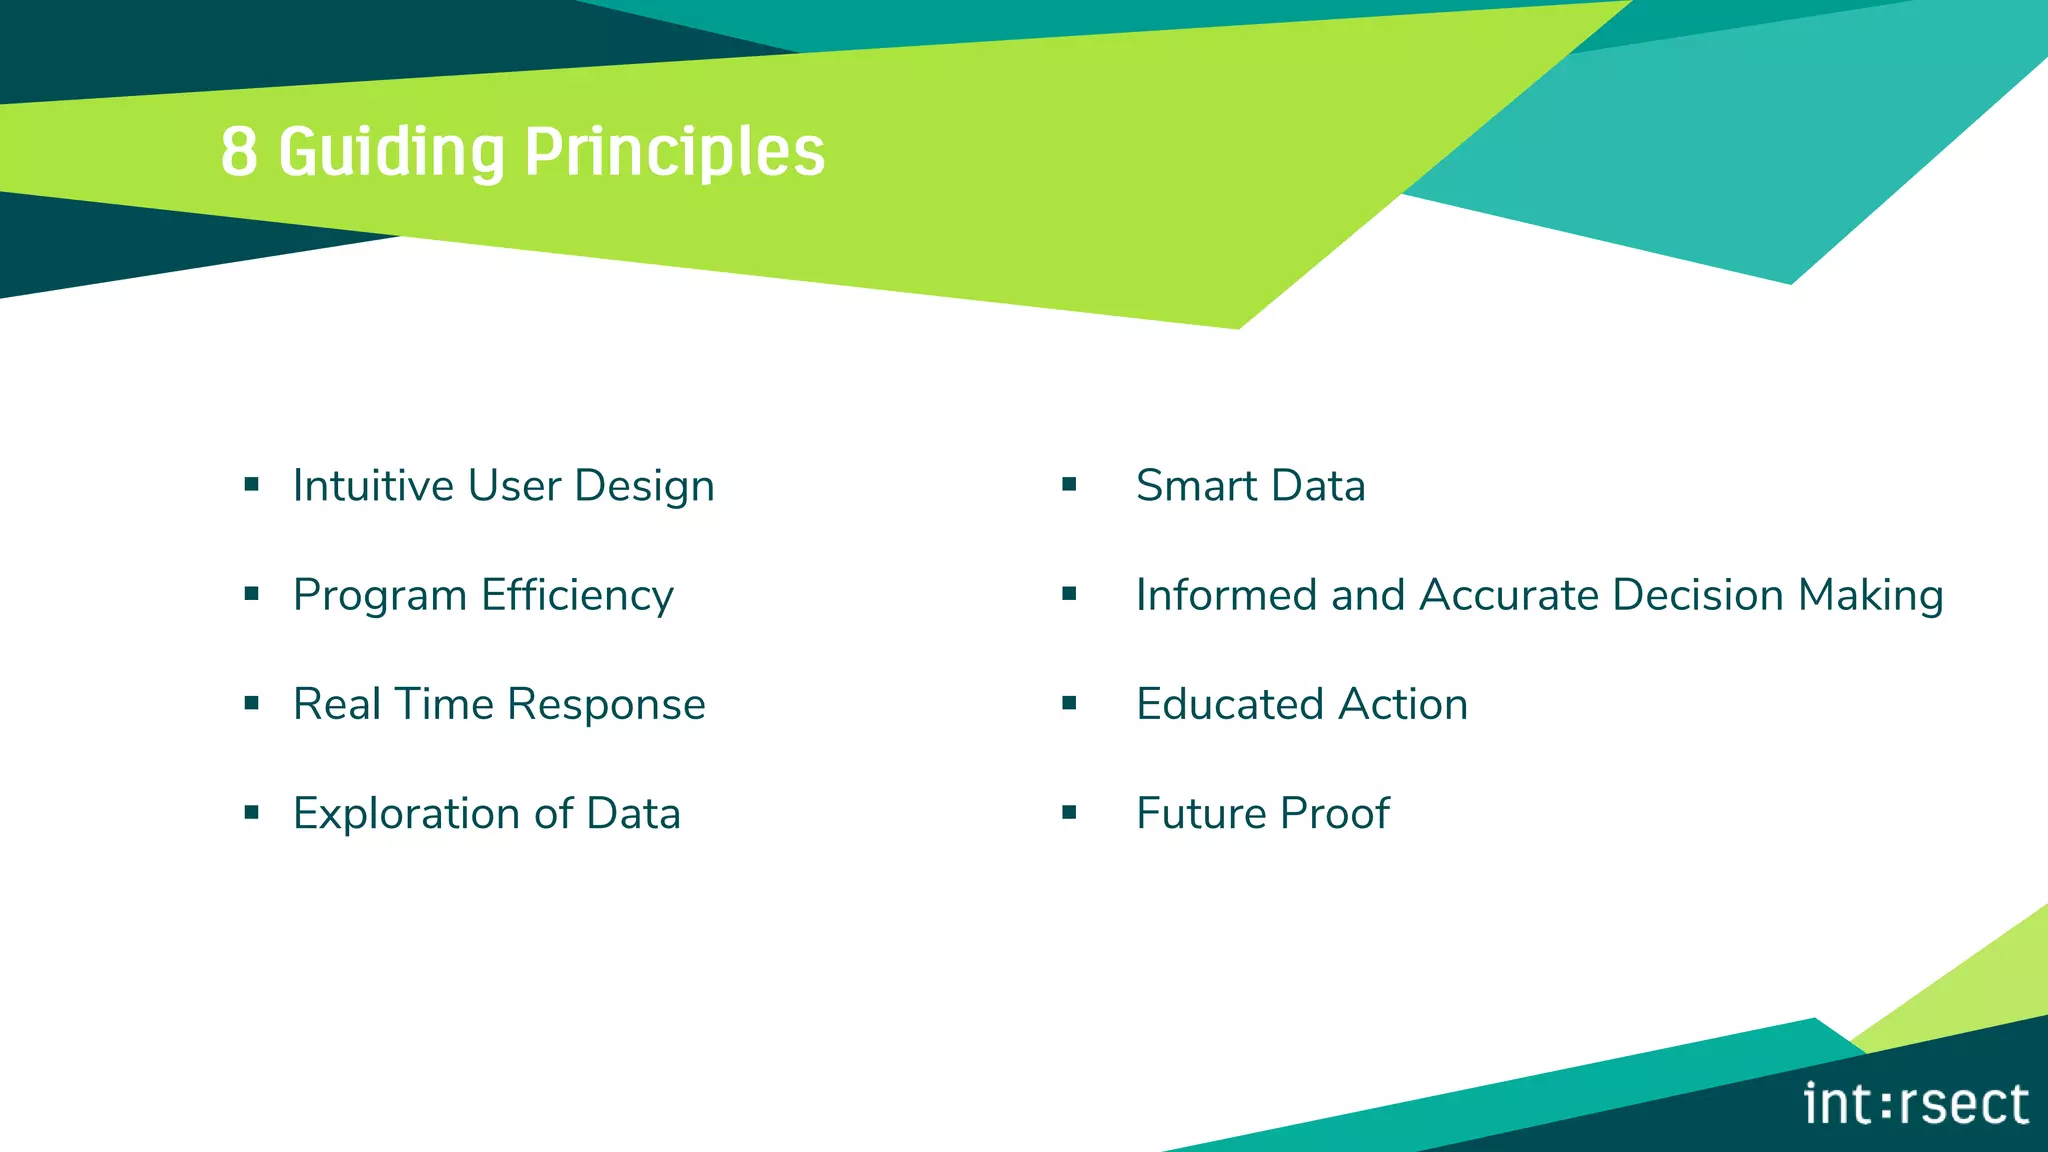
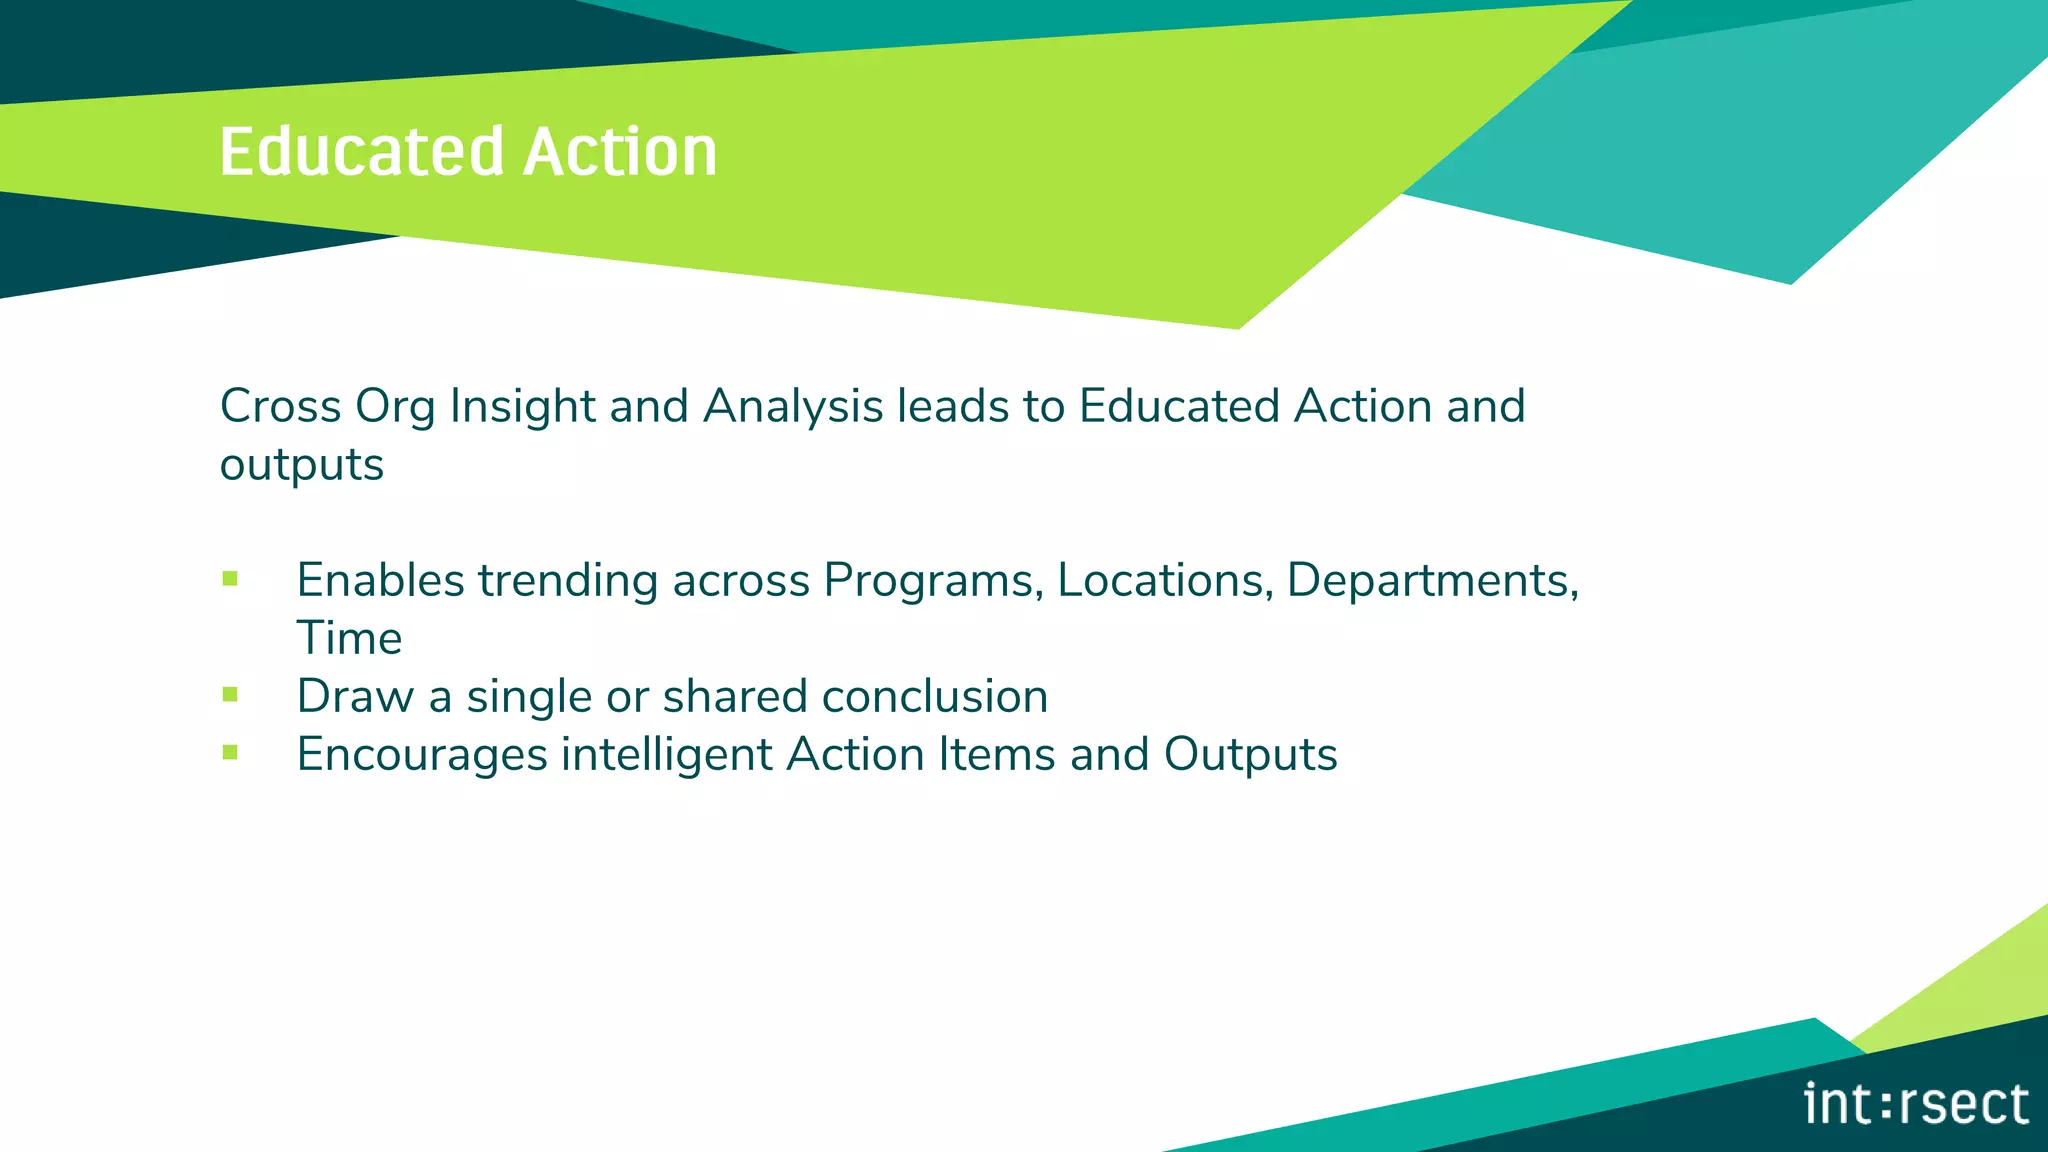
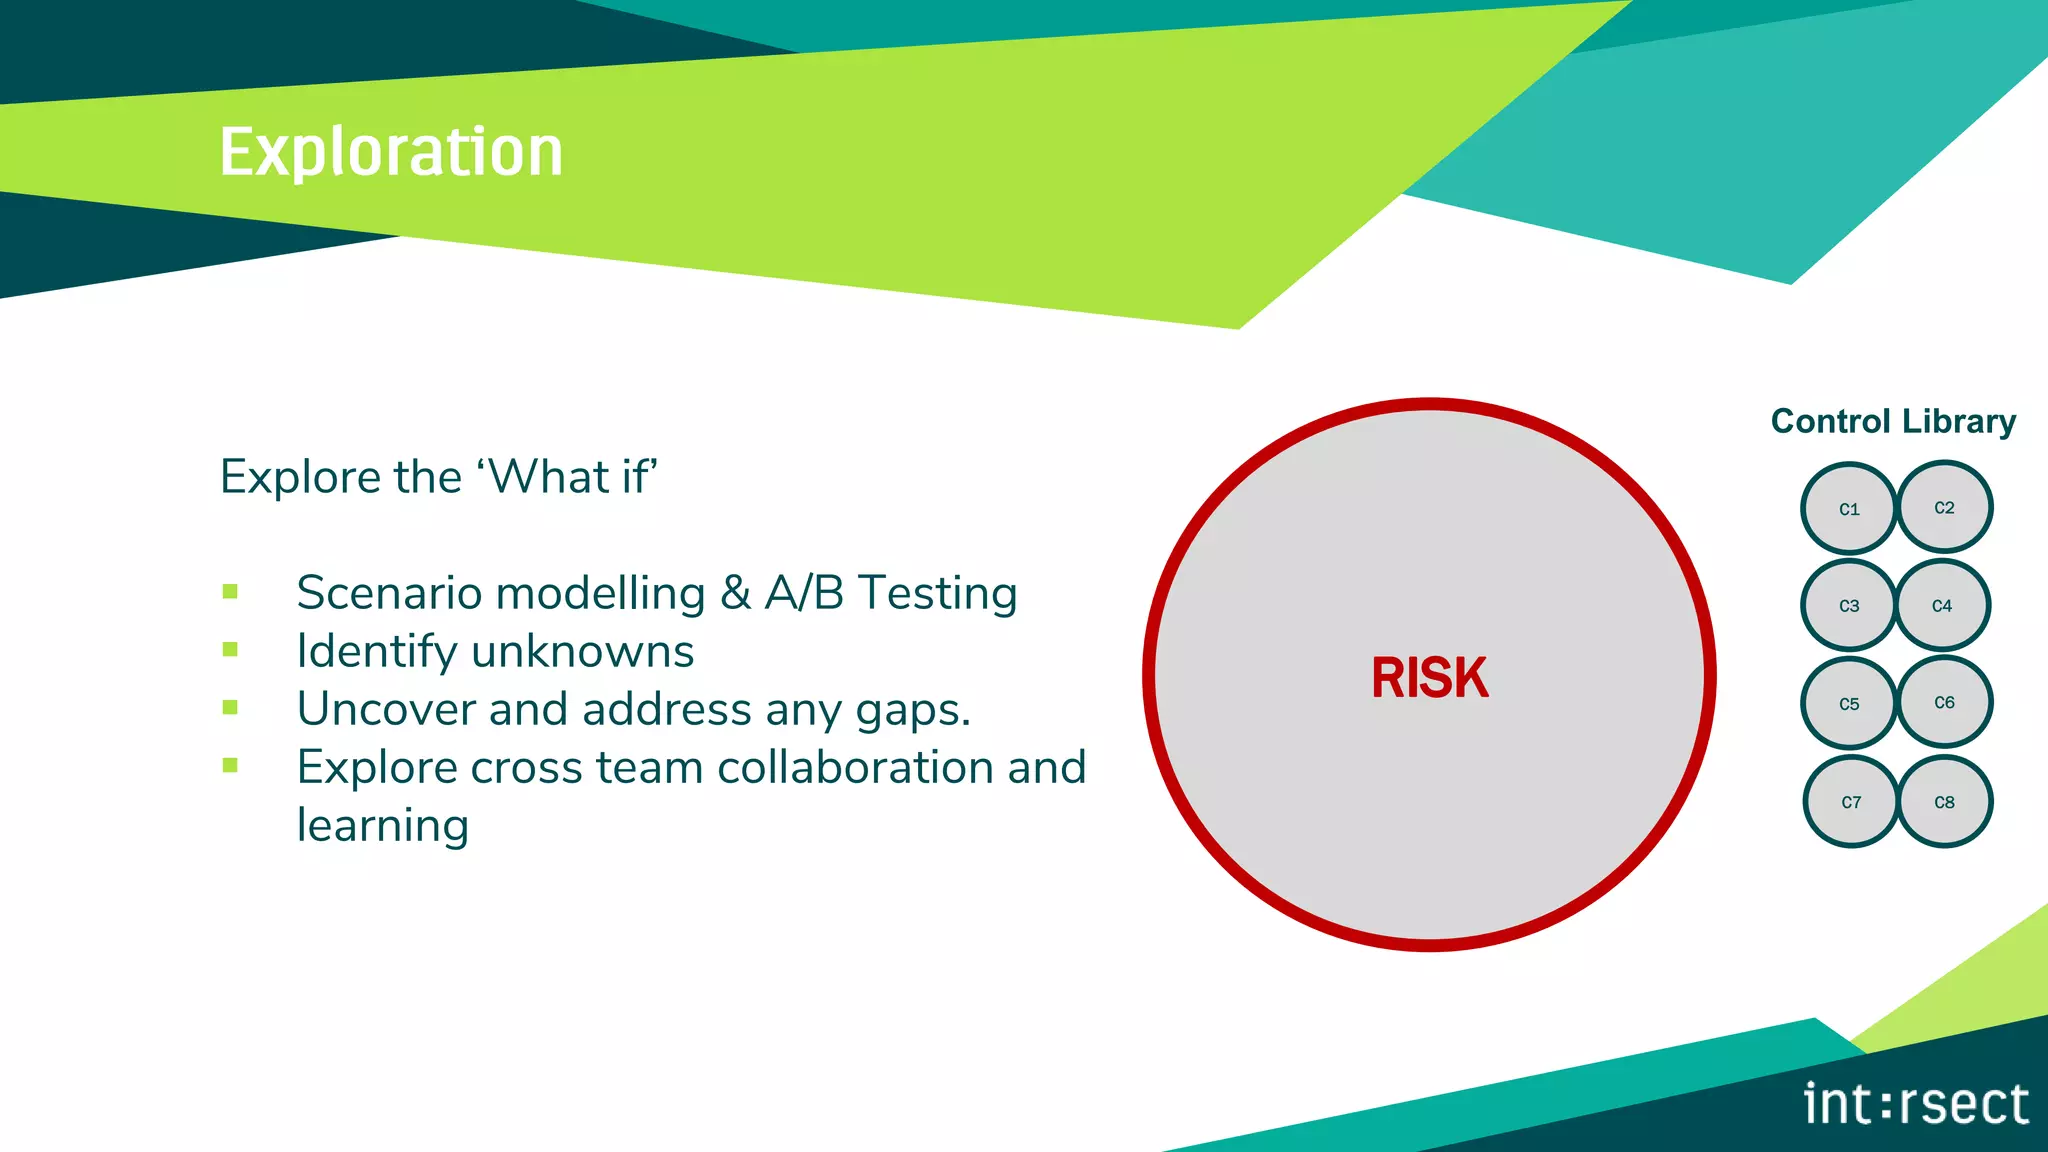
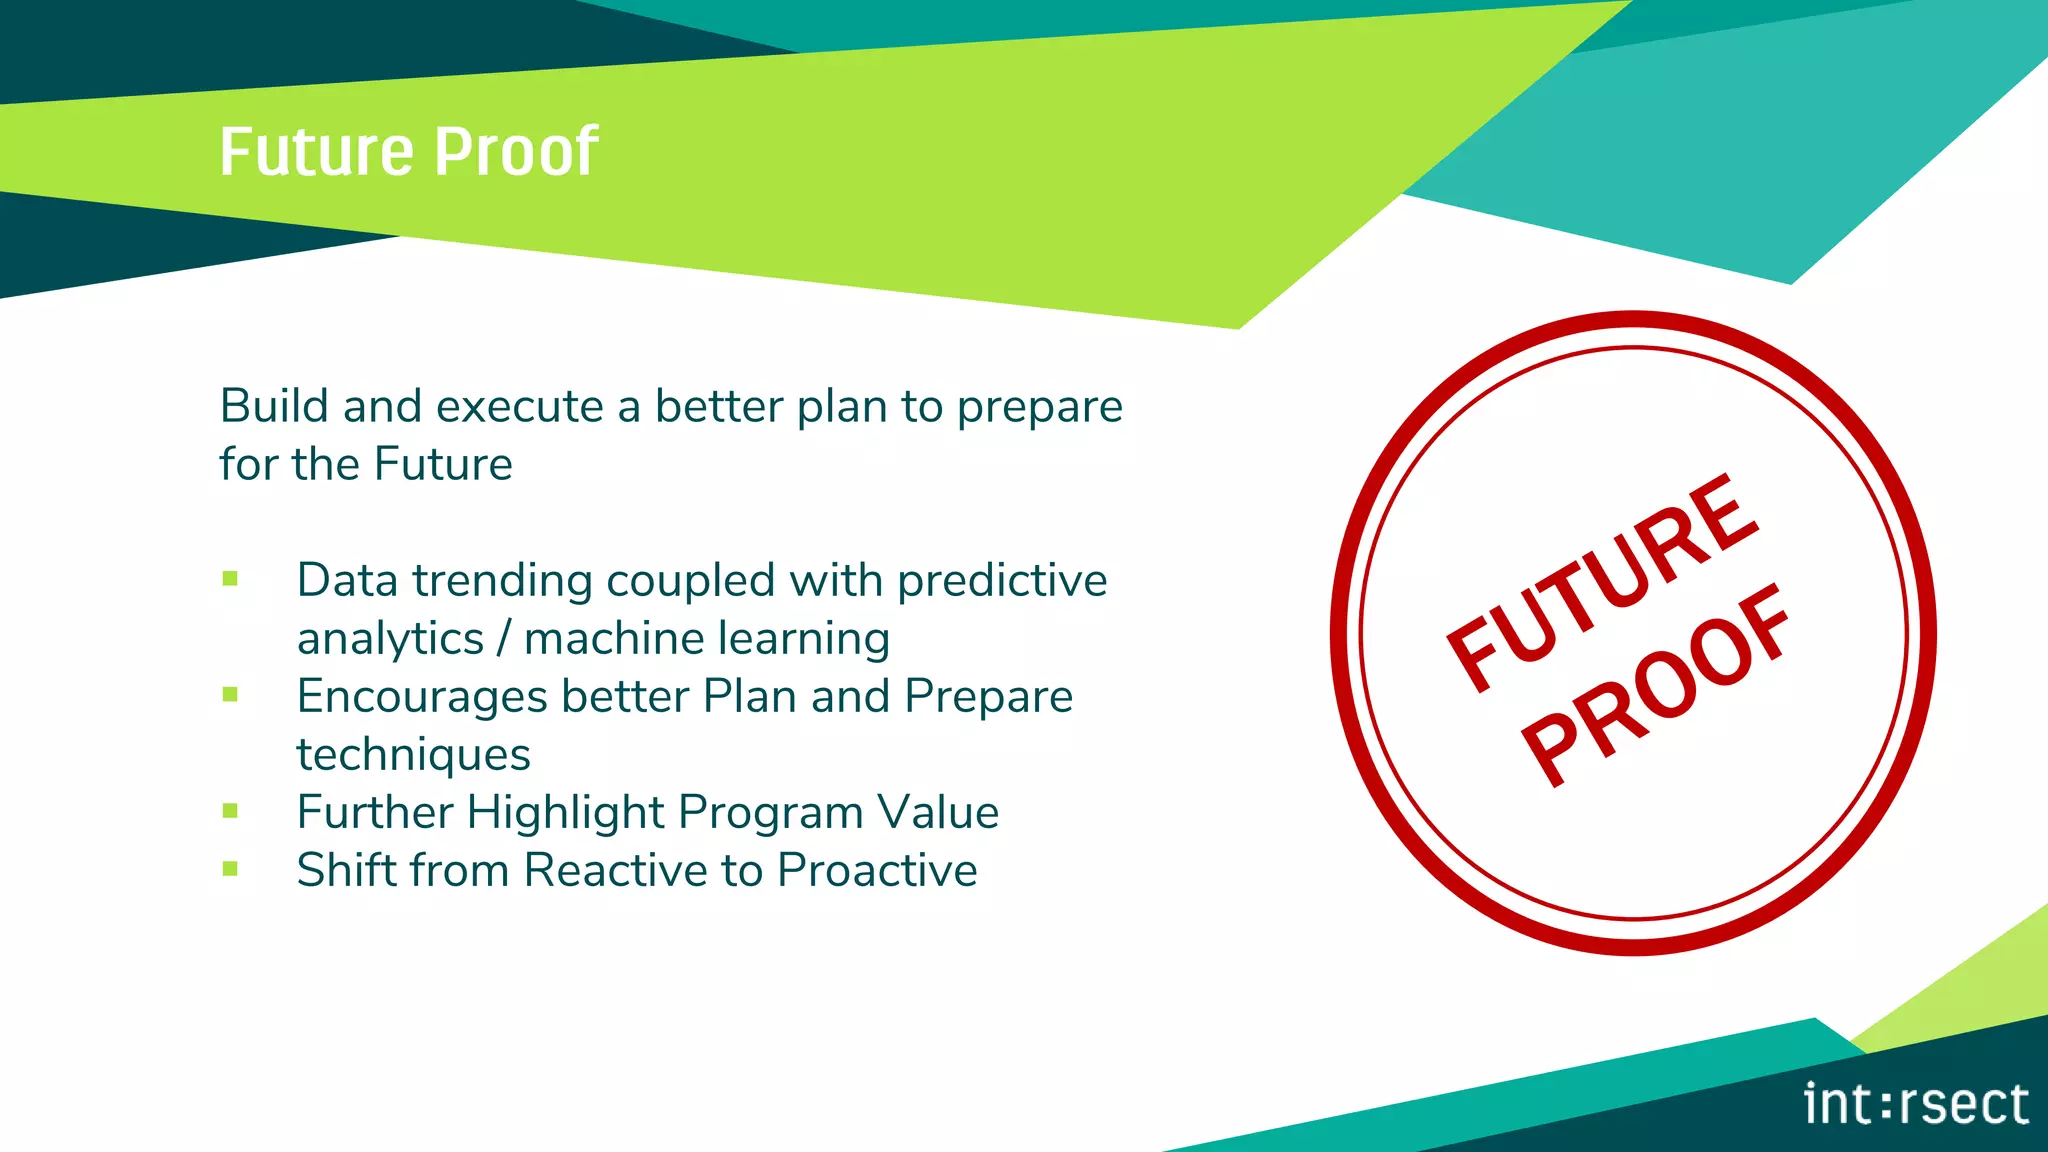
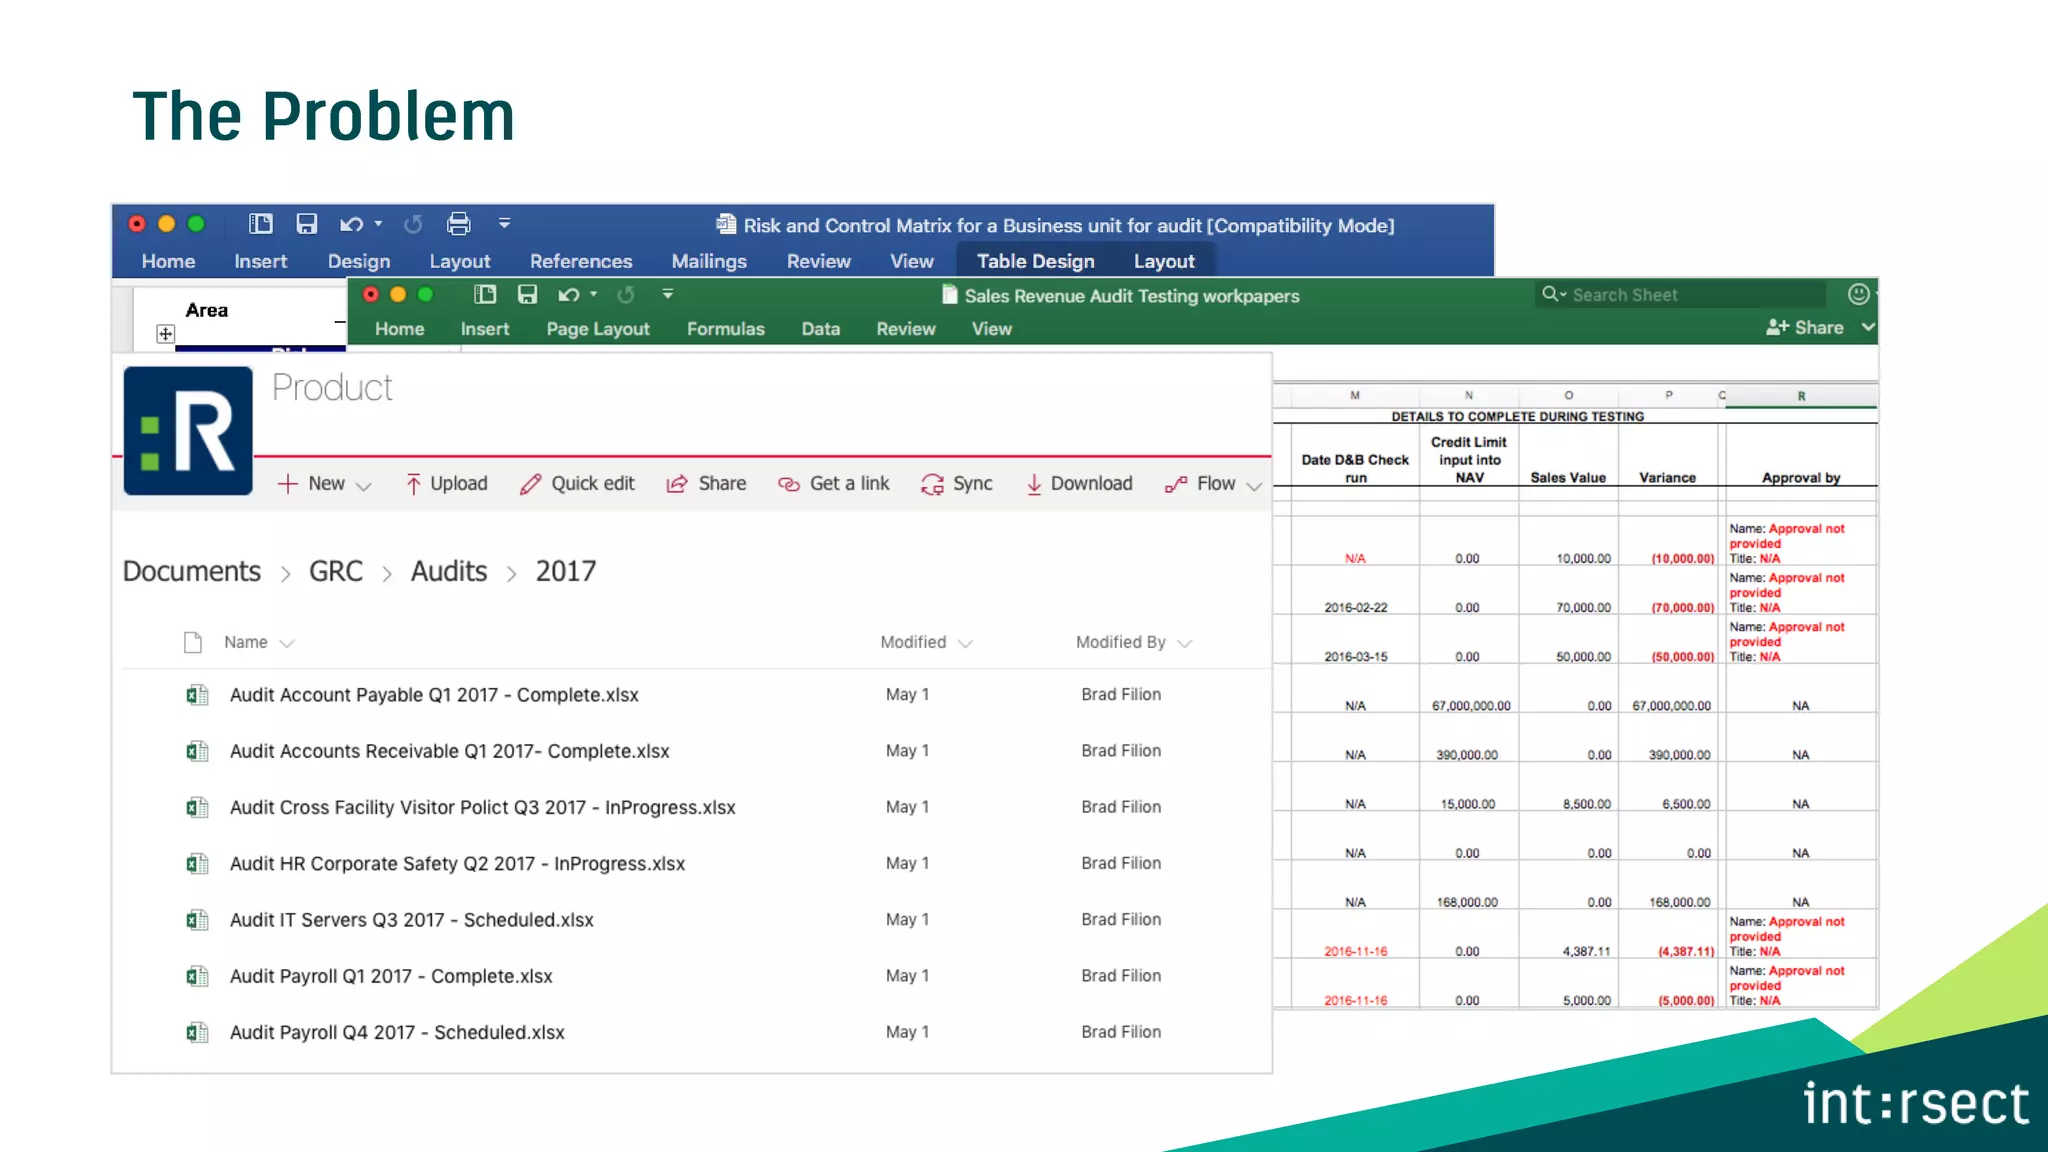
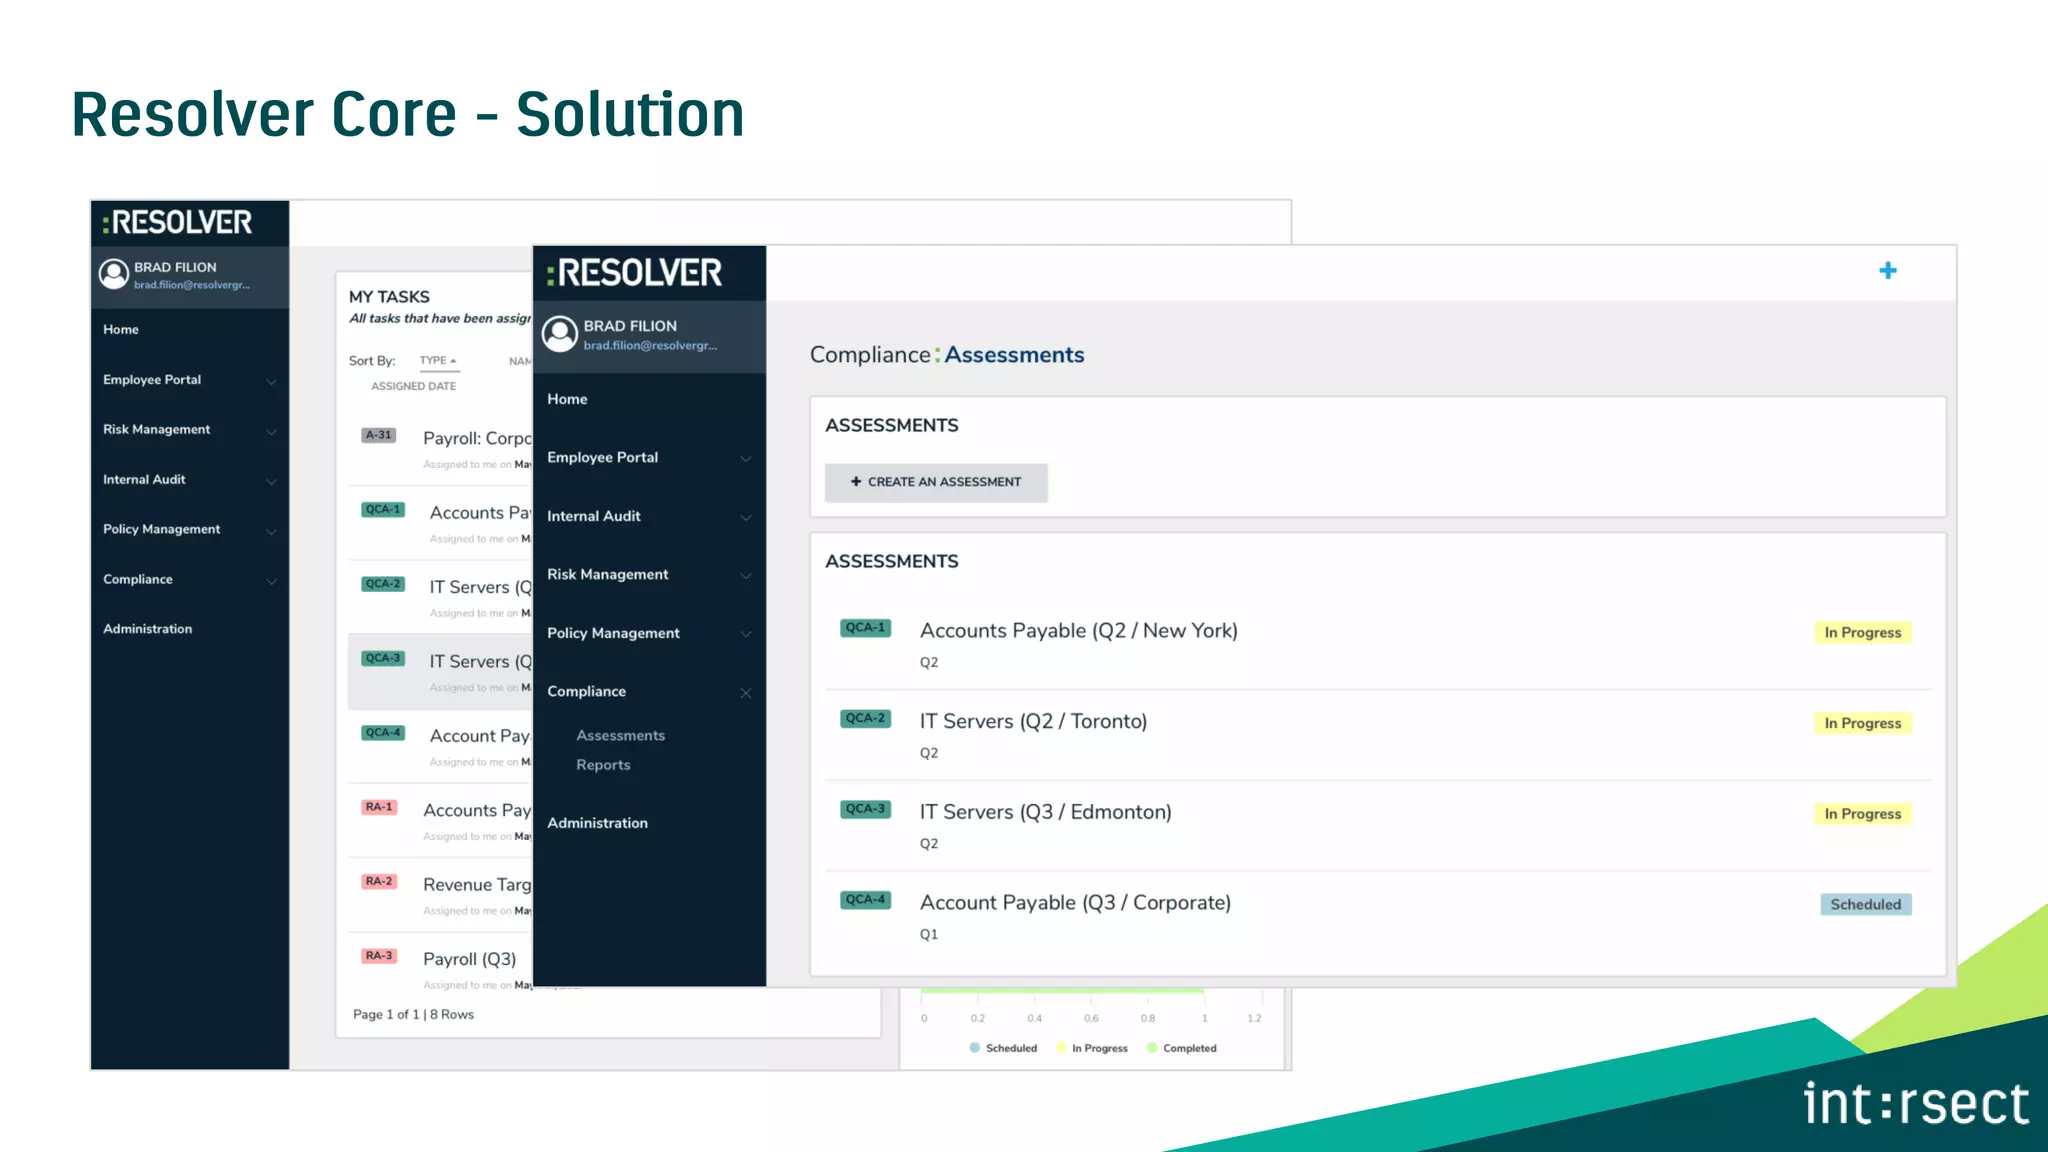
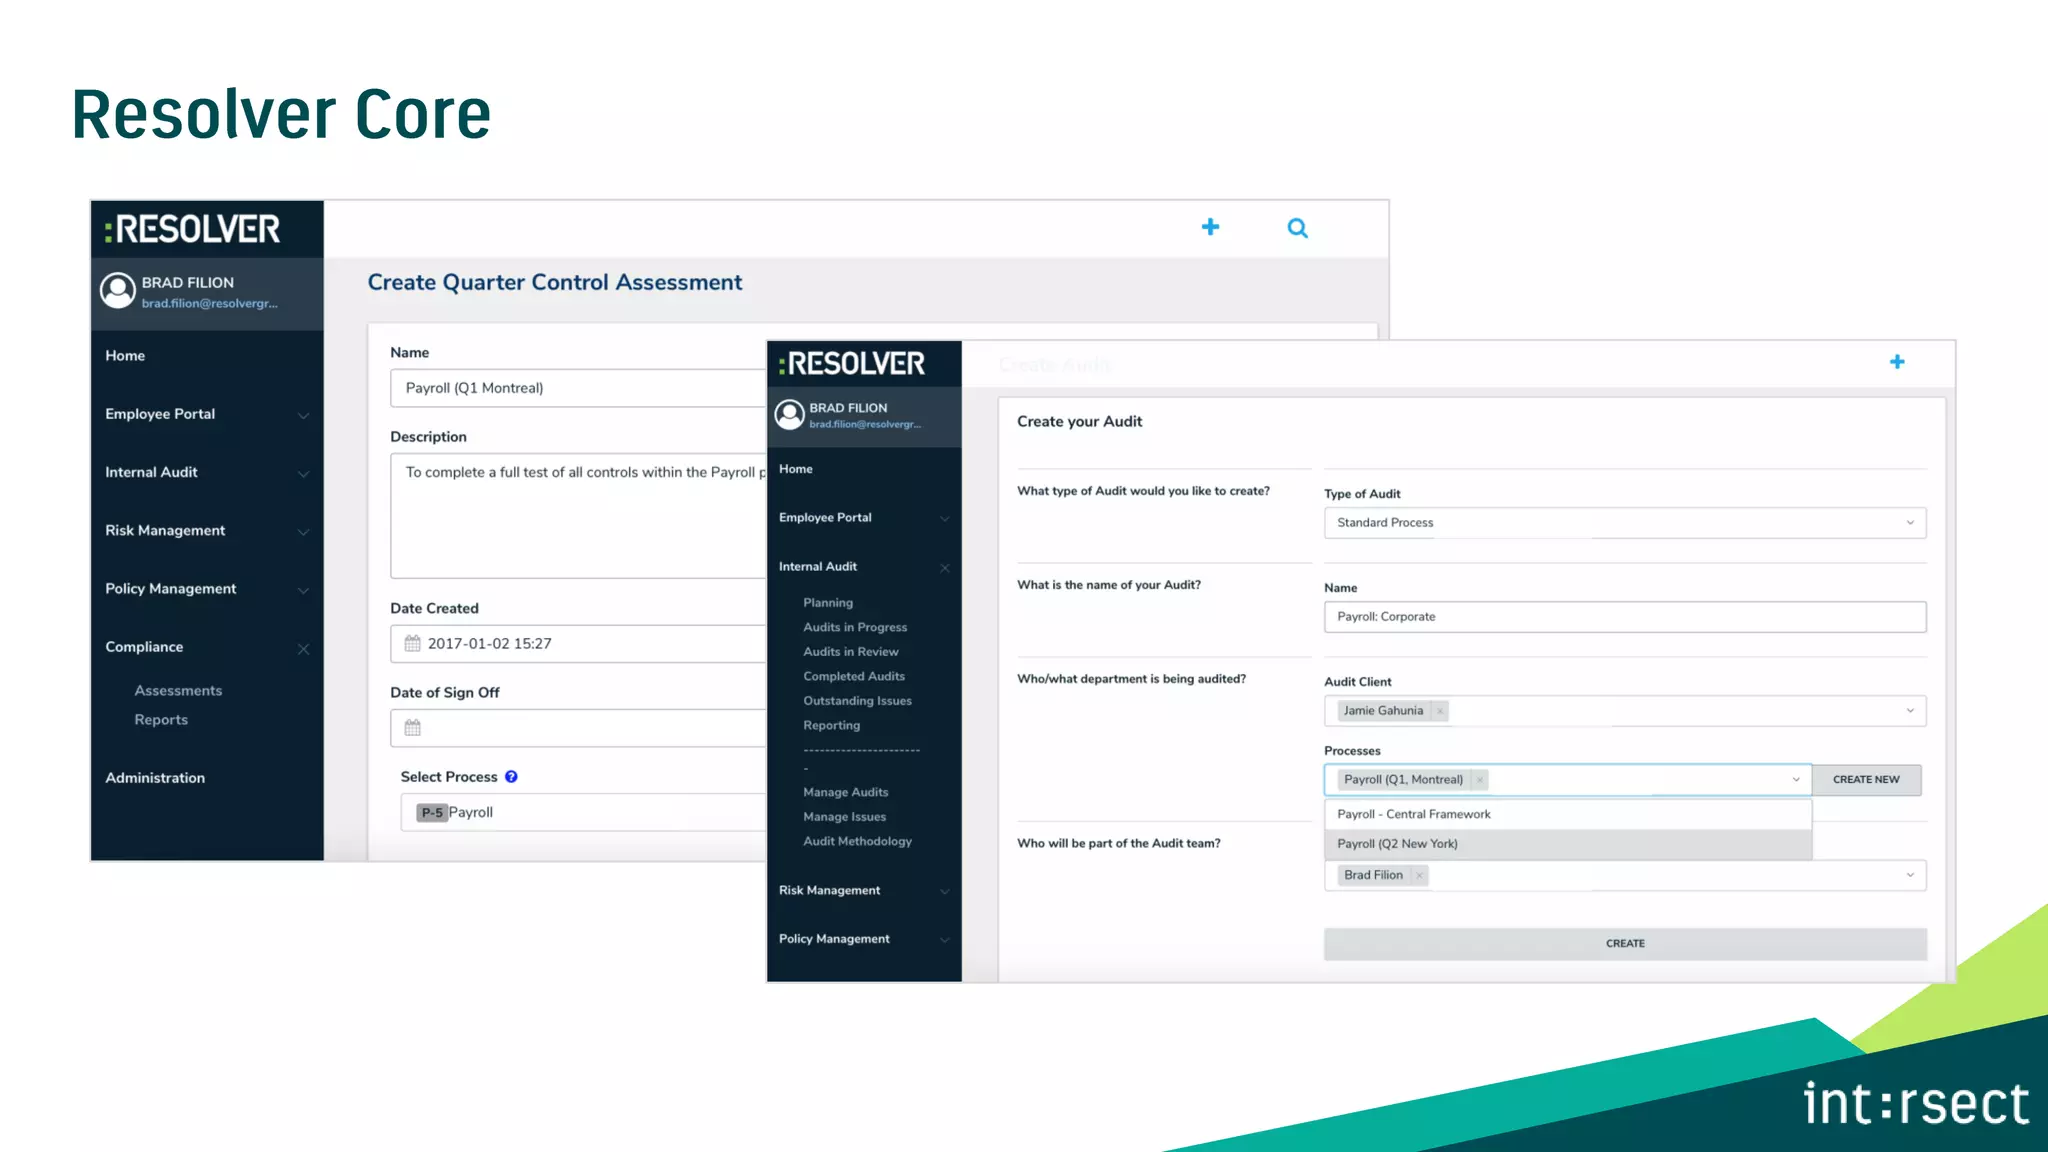
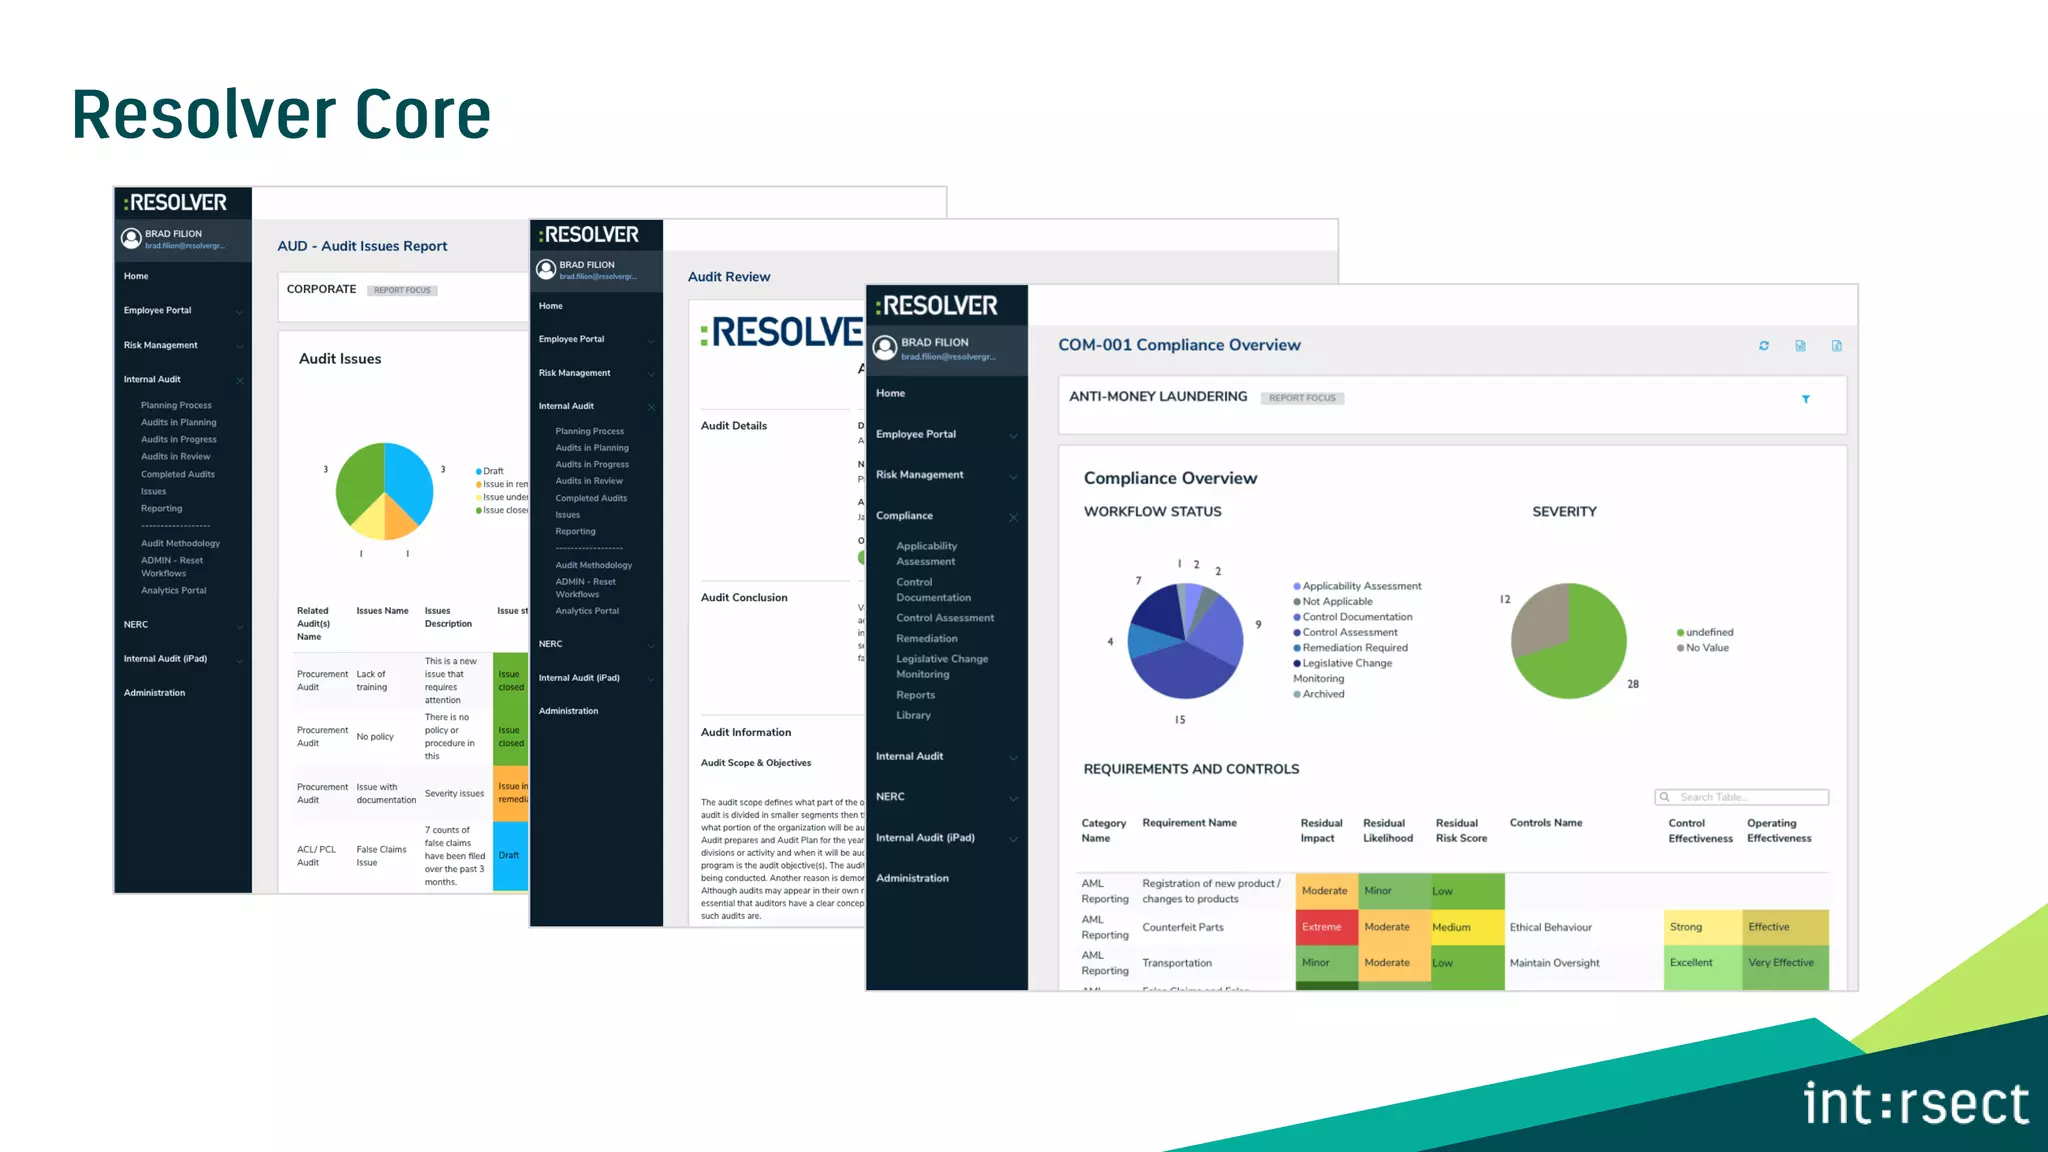
This document discusses assessments in Resolver software. It provides guiding principles for assessments, including collaborative sharing of data and templates, staying up to date with new information, focusing on important data, leveraging related data, enabling cross-organizational analysis, and preparing for the future with predictive analytics. Examples of assessments in different organizations, locations, and time periods are also shown.
13. ▪ Intuitive User Design
▪ Program Efficiency
▪ Real Time Response
▪ Data Exploration
▪ Smart Data
▪ Informed and Accurate Decision Making
▪ Educated Action
▪ Future Proof
20. Context
• Purpose: Re-Launch Control
Assessment for the Objective
• Focus: Objective
• Data: Process, Risk and Controls
• Dimensions: Location, Time
Deliver Outstanding Service at
Every Touch Point
TRAINING
Risks
and
Controls
Montreal
Q1
33. Context
• Purpose: Audit the Process
• Focus: Process
• Data: Risk and Controls
• Dimensions: Location, Time
Training
Related
Risks
and
Controls
Montreal
Q2
34. CONTROL ASSESSMENT
Deliver Outstanding Service
Montreal
Q1
AUDIT
Montreal
Q1
Montreal
Q1
CENTRAL LIBRARY
Montreal
Q2
P:Tr
1
RISK
1
RISK
2
CTR
1
CTR
3
CTR
2
Completed Assessments
LAUNCH
X
40. Context
• Purpose: Launch Control
Assessment around Objective
• Focus: Objective
• Data: Process, Risk and Controls
• Dimensions: Location, Time
Deliver Outstanding Service at
Every Touch Point
Related
Risks
and
Controls
New York
Q3
41. CONTROL ASSESSMENT
CENTRAL LIBRARY
New York
Q3
P:Tr
1
RISK
1
RISK
2
CTR
1
CTR
3
CTR
2
Completed Assessments
NEW
CTR
4
AUDIT
Training
Montreal
Q2
CONTROL ASSESSMENT
Deliver Outstanding Service
Montreal
Q1
42. CONTROL ASSESSMENT
CENTRAL LIBRARY
LAUNCH
New York
Q3
P:Tr
1
RISK
1
RISK
2
CTR
1
CTR
3
CTR
2
Completed Assessments
NEW
CTR
4
P:Tr
1.2
N/Q3
Risk
1.2
N/Q3
CTR
1.2
N/Q3
CTR
2.2
N/Q3
Risk
2.2
N/Q3
CTR
3.2
N/Q3
NEW
CTR
4.2
AUDIT
Training
Montreal
Q2
CONTROL ASSESSMENT
Deliver Outstanding Service
Montreal
Q1
43. CONTROL ASSESSMENT
CENTRAL LIBRARY
LAUNCH
New York
Q3
P:Tr
1
RISK
1
RISK
2
CTR
1
CTR
3
CTR
2
Completed Assessments
NEW
CTR
4
P:Tr
1.2
N/Q3
Risk
1.2
N/Q3
CTR
1.2
N/Q3
CTR
2.2
N/Q3
Risk
2.2
N/Q3
CTR
3.2
N/Q3
CTR
4.2
N/Q3
AUDIT
Training
Montreal
Q2
CONTROL ASSESSMENT
Deliver Outstanding Service
Montreal
Q1
44. CONTROL ASSESSMENT
CENTRAL LIBRARY
New York
Q3
P:Tr
1
RISK
1
RISK
2
CTR
1
CTR
3
CTR
2
Completed Assessments
NEW
CTR
4
P:Tr
1.2
N/Q3
Risk
1.2
N/Q3
CTR
1.2
N/Q3
CTR
2.2
N/Q3
Risk
2.2
N/Q3
CTR
3.2
N/Q3
MAPPED
AUDIT
Training
Montreal
Q2
CONTROL ASSESSMENT
Deliver Outstanding Service
Montreal
Q1
CTR
4.2
N/Q3
46. CONTROL ASSESSMENT
Deliver Outstanding Service
Montreal
Q1
AUDIT
Training
Montreal
Q2
CONTROL ASSESSMENT
Deliver Outstanding Service
New York
Q3
AUDIT
Payroll
New York
Q3
RISK
ASSESSMENT
Deliver Outstanding Service
Corporate
Q1
SITE AUDIT
Security
Toronto
Q4
CROSS ORG REPORTING
47.
48. ▪ Intuitive User Design
▪ Program Efficiency
▪ Real Time Response
▪ Exploration of Data
▪ Smart Data
▪ Informed and Accurate Decision Making
▪ Educated Action
▪ Future Proof
49. Define a relationship and understanding
between the user and the data giving:
▪ Purpose
▪ Focus
▪ Categorization of Data
▪ Perspective
For the users interacting with it.
50. Shared and Collaborative Approach Across the
Organization
▪ Data Model
▪ Data
▪ Templates
Results In
▪ less duplication of efforts
▪ streamline activities and reports
▪ maximizing team and organizational
efficiency
51. Stay current with Industry Demands and
Events
▪ Live Content Feeds introduce new,
relevant data
▪ Launches New Assessment
Results In
▪ Event Based Assessments
▪ Real time reaction to everday events
▪ Immediate Awareness and Coverage
Resolver
NYSE
Weather
Patterns
New
Content
Geo
Political
KPIs
KRIs
52. Focus on the Data that matters most
▪ Automated via Workflow
▪ Helps Scope Assessments
On Launch
▪ Leverage results and new data to launch and scope
future assessments
▪ Based off Patterns in Data identify areas of
Concerns
▪ Allocate Resources Accordingly
Payroll Audit Server Audit
Workflow
53. Provide Users the tools to make the right decisions
▪ During an assessment, leverage indirect, yet
contextually relevant, data
▪ From other: Programs, Teams, Departments,
Locations
▪ Look back at previous assessment data (Time: q1
vs q2)
Data becomes more accurate, is collected more quickly
and requires less review
54. Cross Org Insight and Analysis leads to Educated Action and
outputs
▪ Enables trending across Programs, Locations, Departments,
Time
▪ Draw a single or shared conclusion
▪ Encourages intelligent Action Items and Outputs
55. Explore the ‘What if’
▪ Scenario modelling & A/B Testing
▪ Identify unknowns
▪ Uncover and address any gaps.
▪ Explore cross team collaboration and
learning
C1
C3
C2
C4
C5
C7
C6
C8
Control Library
56. Build and execute a better plan to prepare
for the Future
▪ Data trending coupled with predictive
analytics / machine learning
▪ Encourages better Plan and Prepare
techniques
▪ Further Highlight Program Value
▪ Shift from Reactive to Proactive
57.
58.
59.
60.
61.
62. Objective
An ongoing evaluation of the Nature,
Quality or Status of your business’ ability to
Plan, Prepare, Respond, and Recover.
63.
64. Who We’re Looking For
▪ Customers
▪ New or Old
▪ Love to Collaborate
▪ Love to give Feedback
What’s Involved
▪ Time Commitment (Ranges)
▪ Share Your Insights and Needs
▪ Validate Concepts & UI Design
▪ Hands on Testing of Features