Download as PDF, PPTX


![Expressions
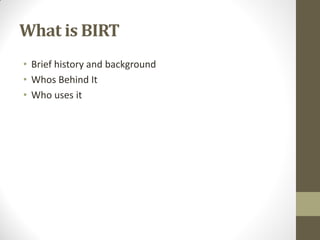
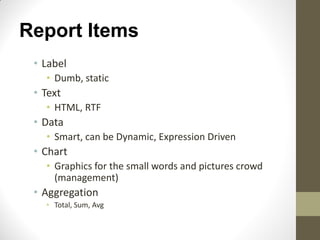
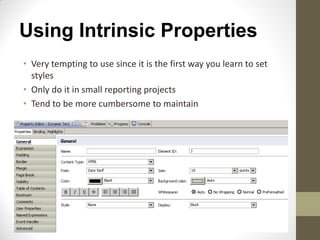
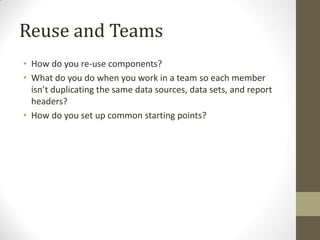
• A lot of things in BIRT are based on them
• Report Items
• Properties
• Outputs
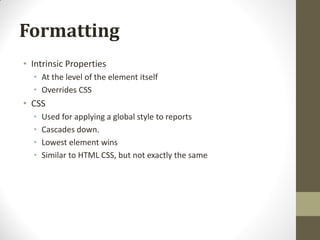
• Formatting
• Small snippets of Javascript that return single values
• You will see these everywhere
• Anytime you start off with row[“ColumnName”], you are starting
with an expression.
• Anywhere there is an expression editor.](https://image.slidesharecdn.com/introductiontobirt-130706132338-phpapp01/85/Introduction-to-birt-22-320.jpg)


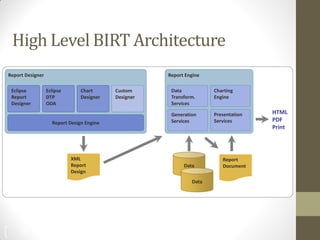
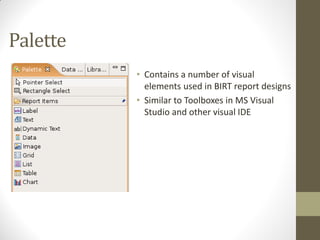
The document summarizes John Ward's presentation on report development using BIRT (Business Intelligence and Reporting Tools) at the 6th Annual EclipseCon. It includes an agenda that covers an introduction to BIRT, building reports, working with data and charts, report formatting, and event handling. It also discusses reuse of components through templates and libraries, deployment of reports, and extensions to BIRT's functionality.


![Bi mobile : état de l'art [french]](https://cdn.slidesharecdn.com/ss_thumbnails/bimobile-tatdelart-110916062216-phpapp02-thumbnail.jpg?width=640&height=640&fit=bounds)


![Eclipse Business Intelligence and Reporting Tools [BIRT] Project](https://cdn.slidesharecdn.com/ss_thumbnails/eclipse-birt-datasheet-120727110444-phpapp02-thumbnail.jpg?width=640&height=640&fit=bounds)