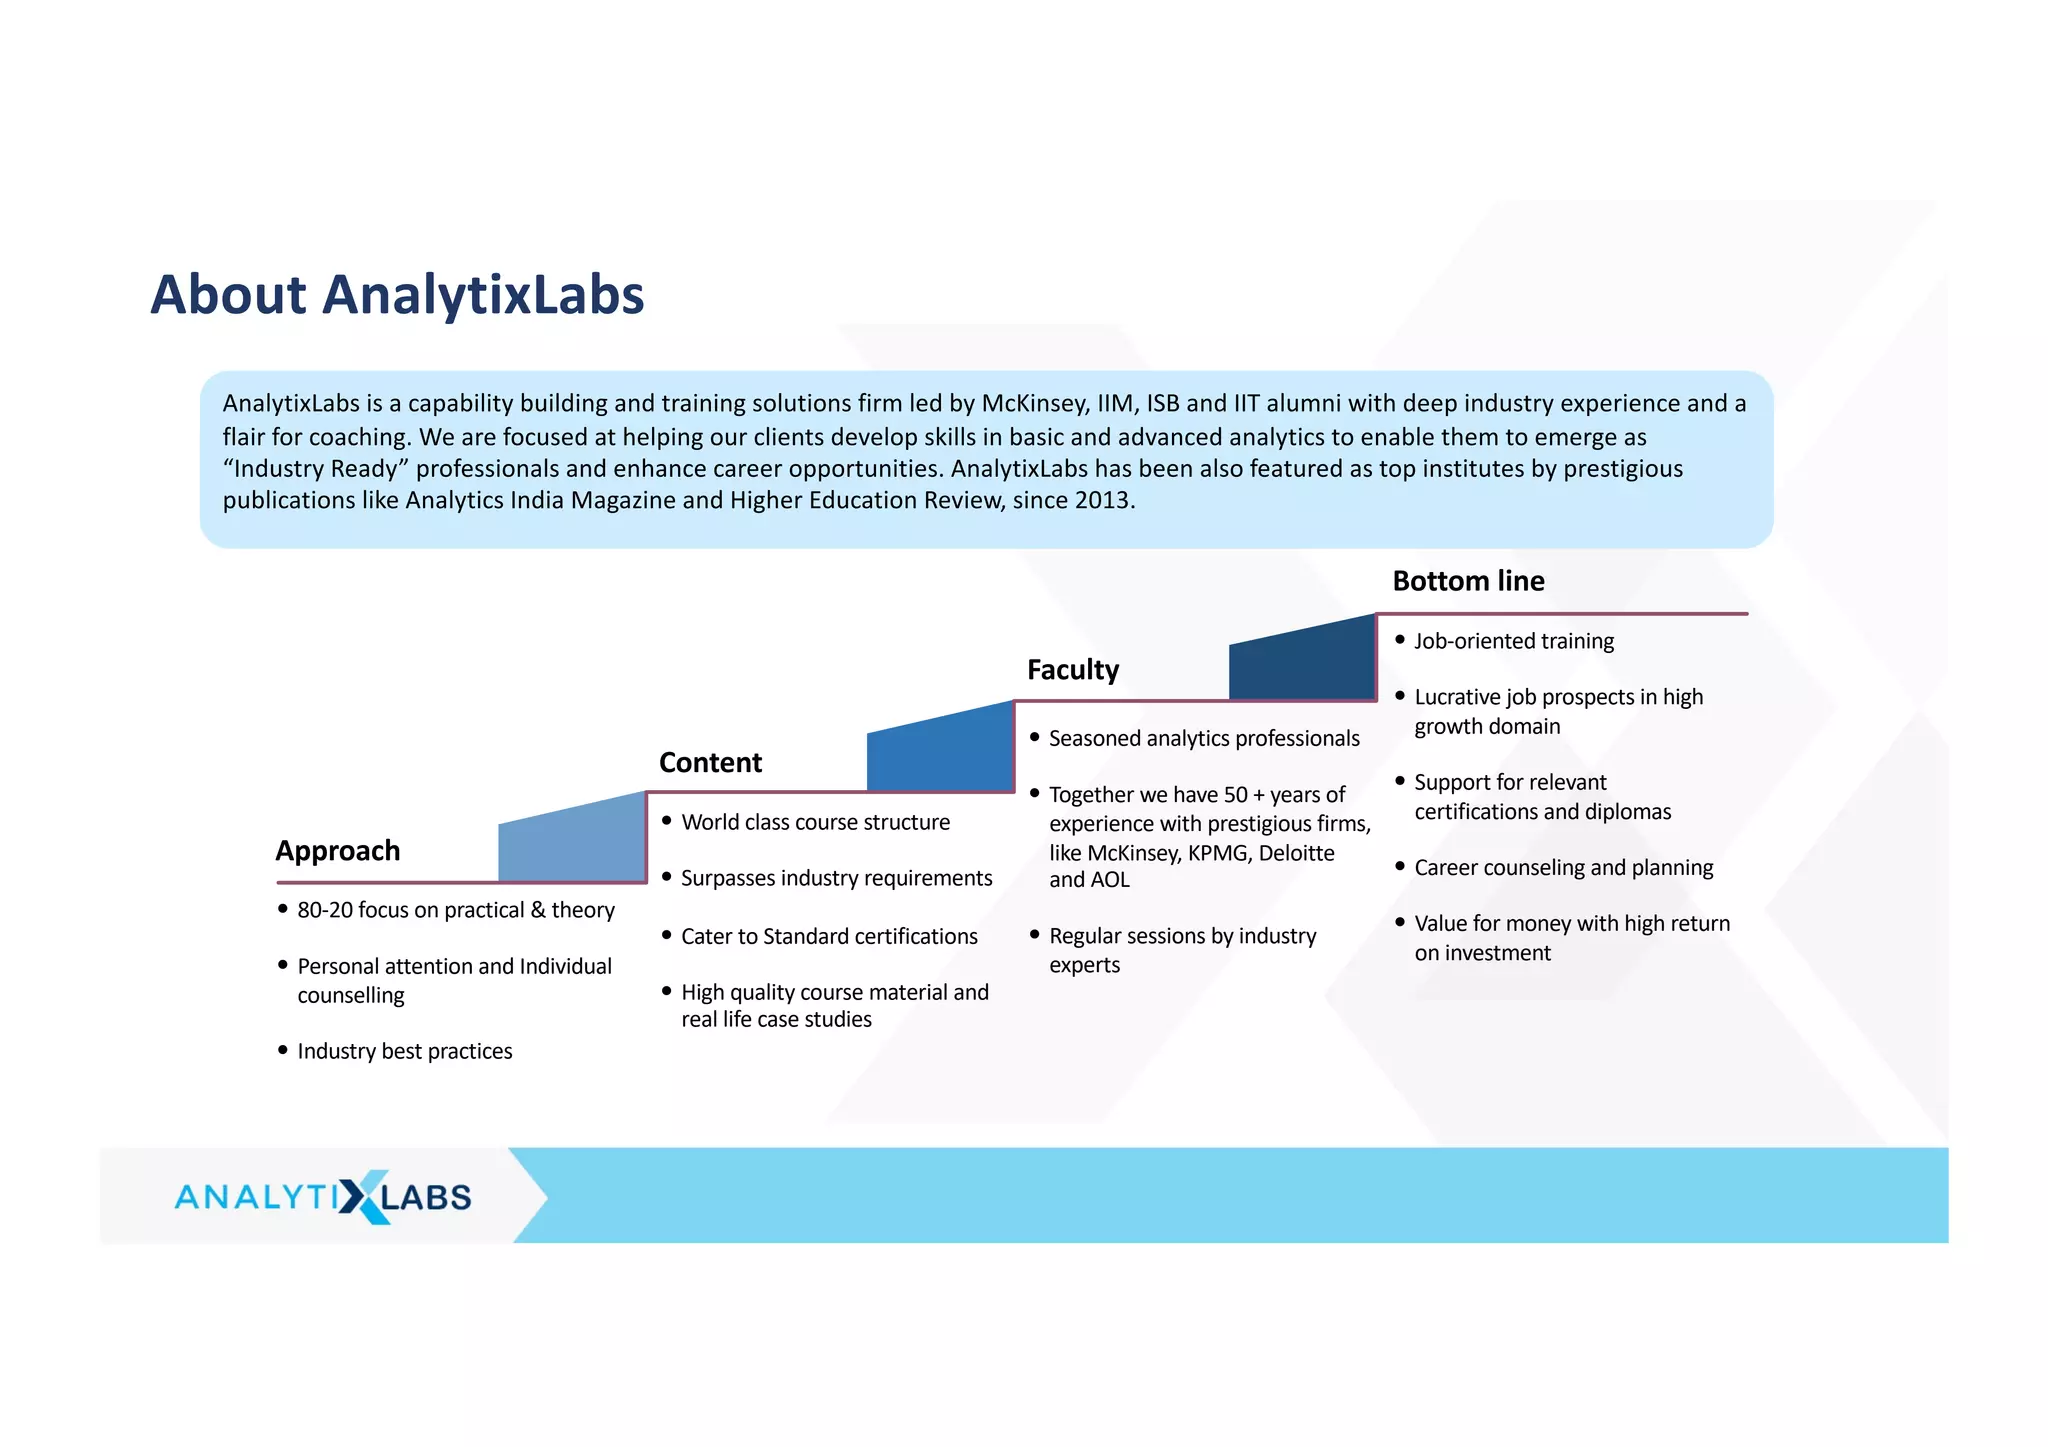
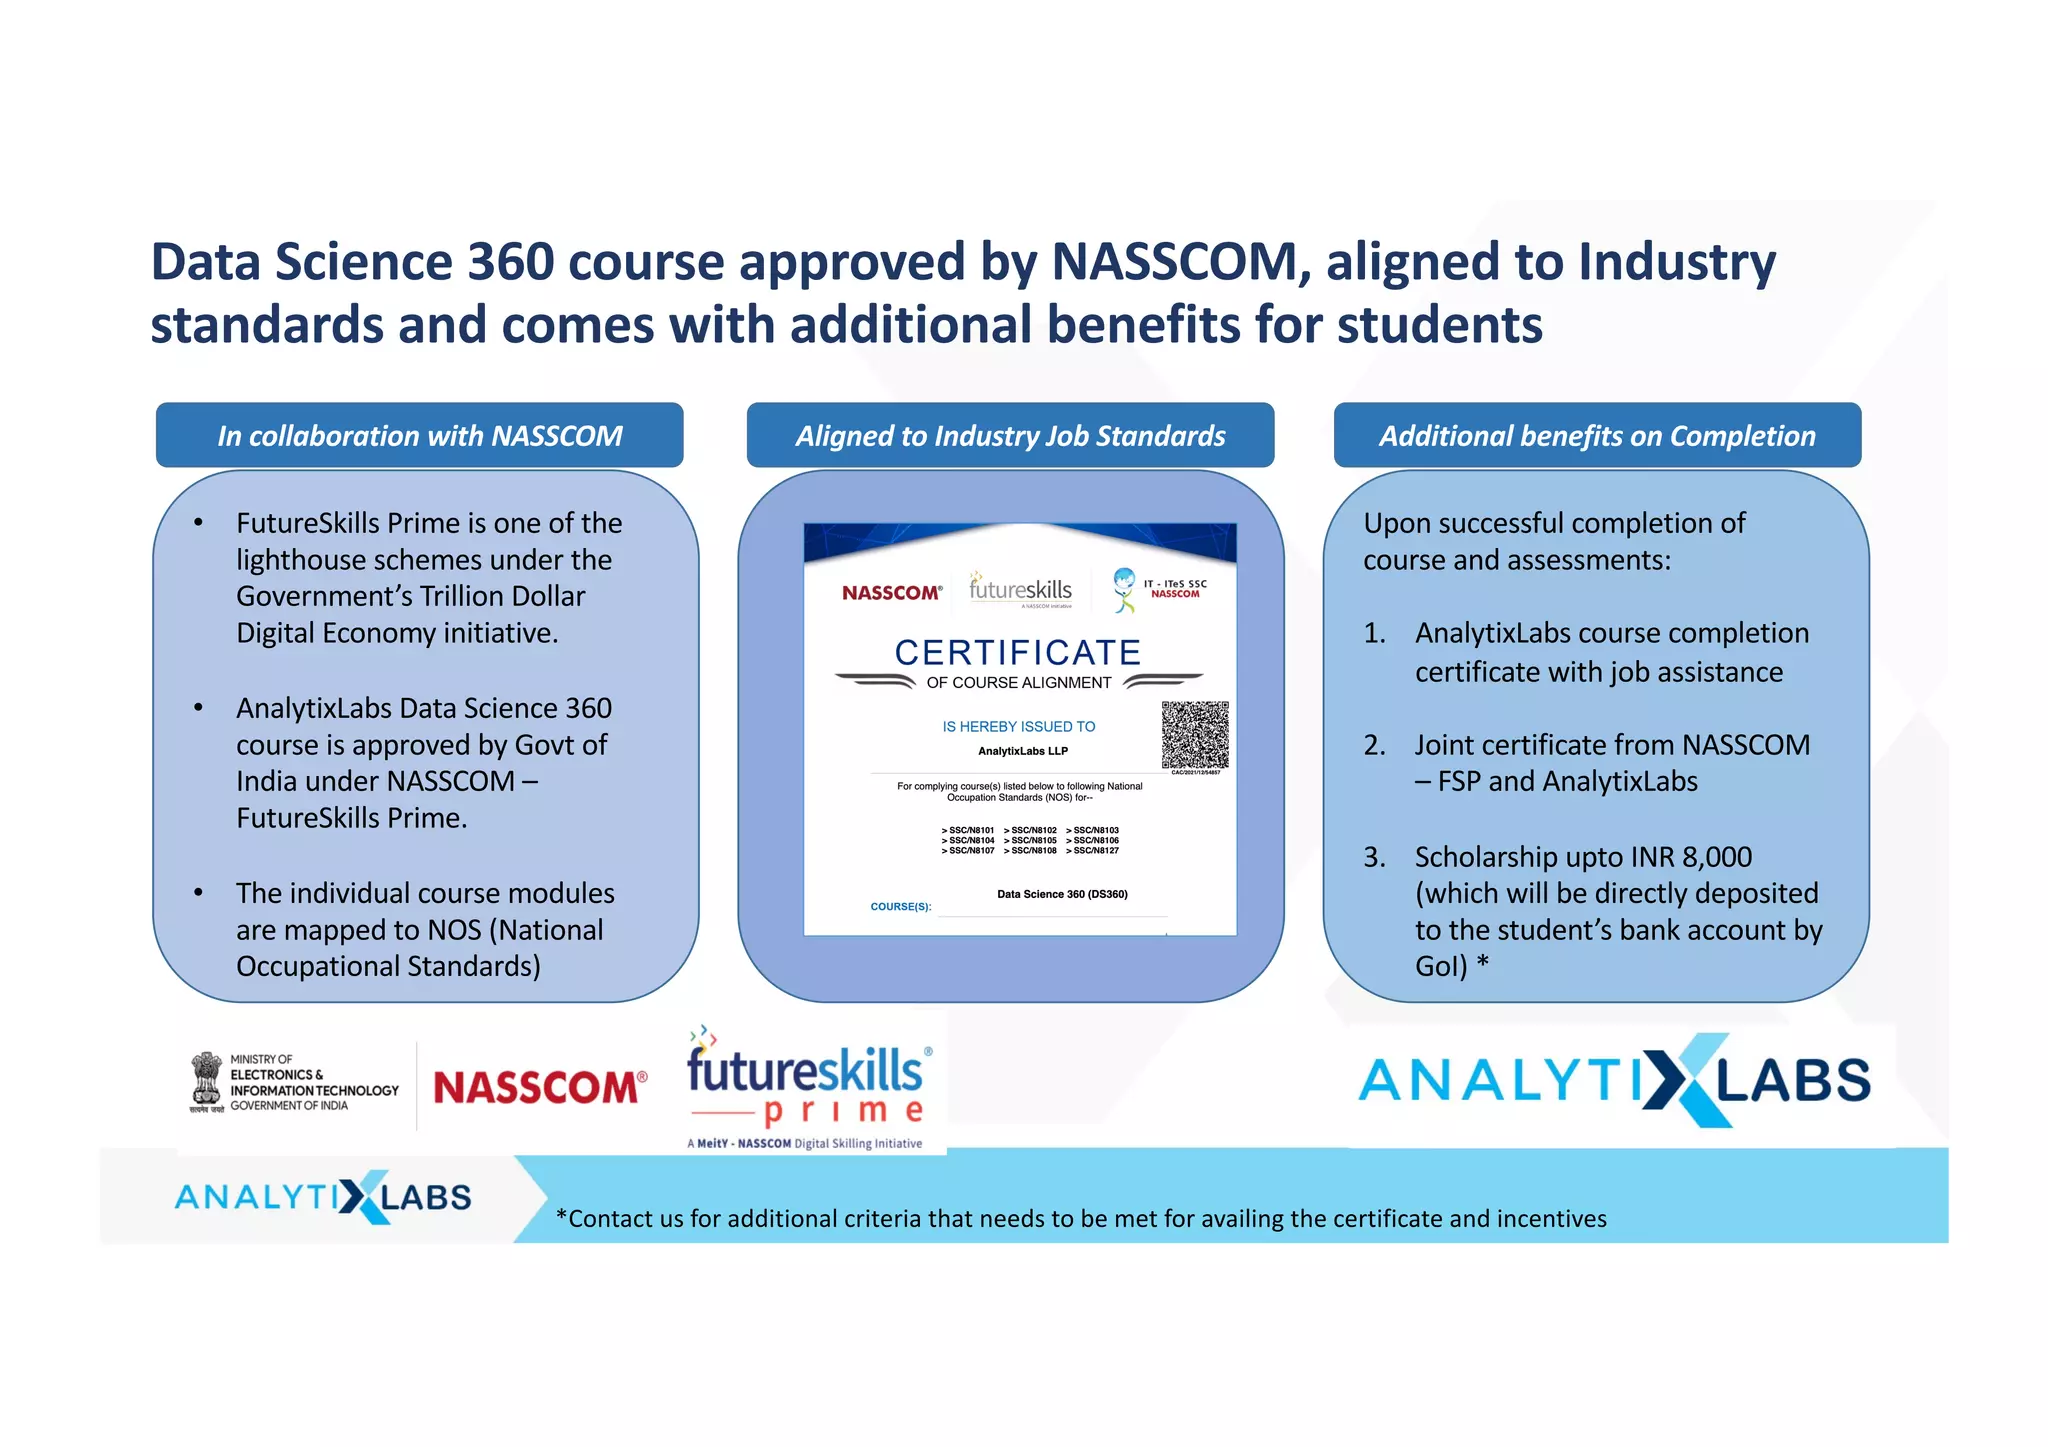
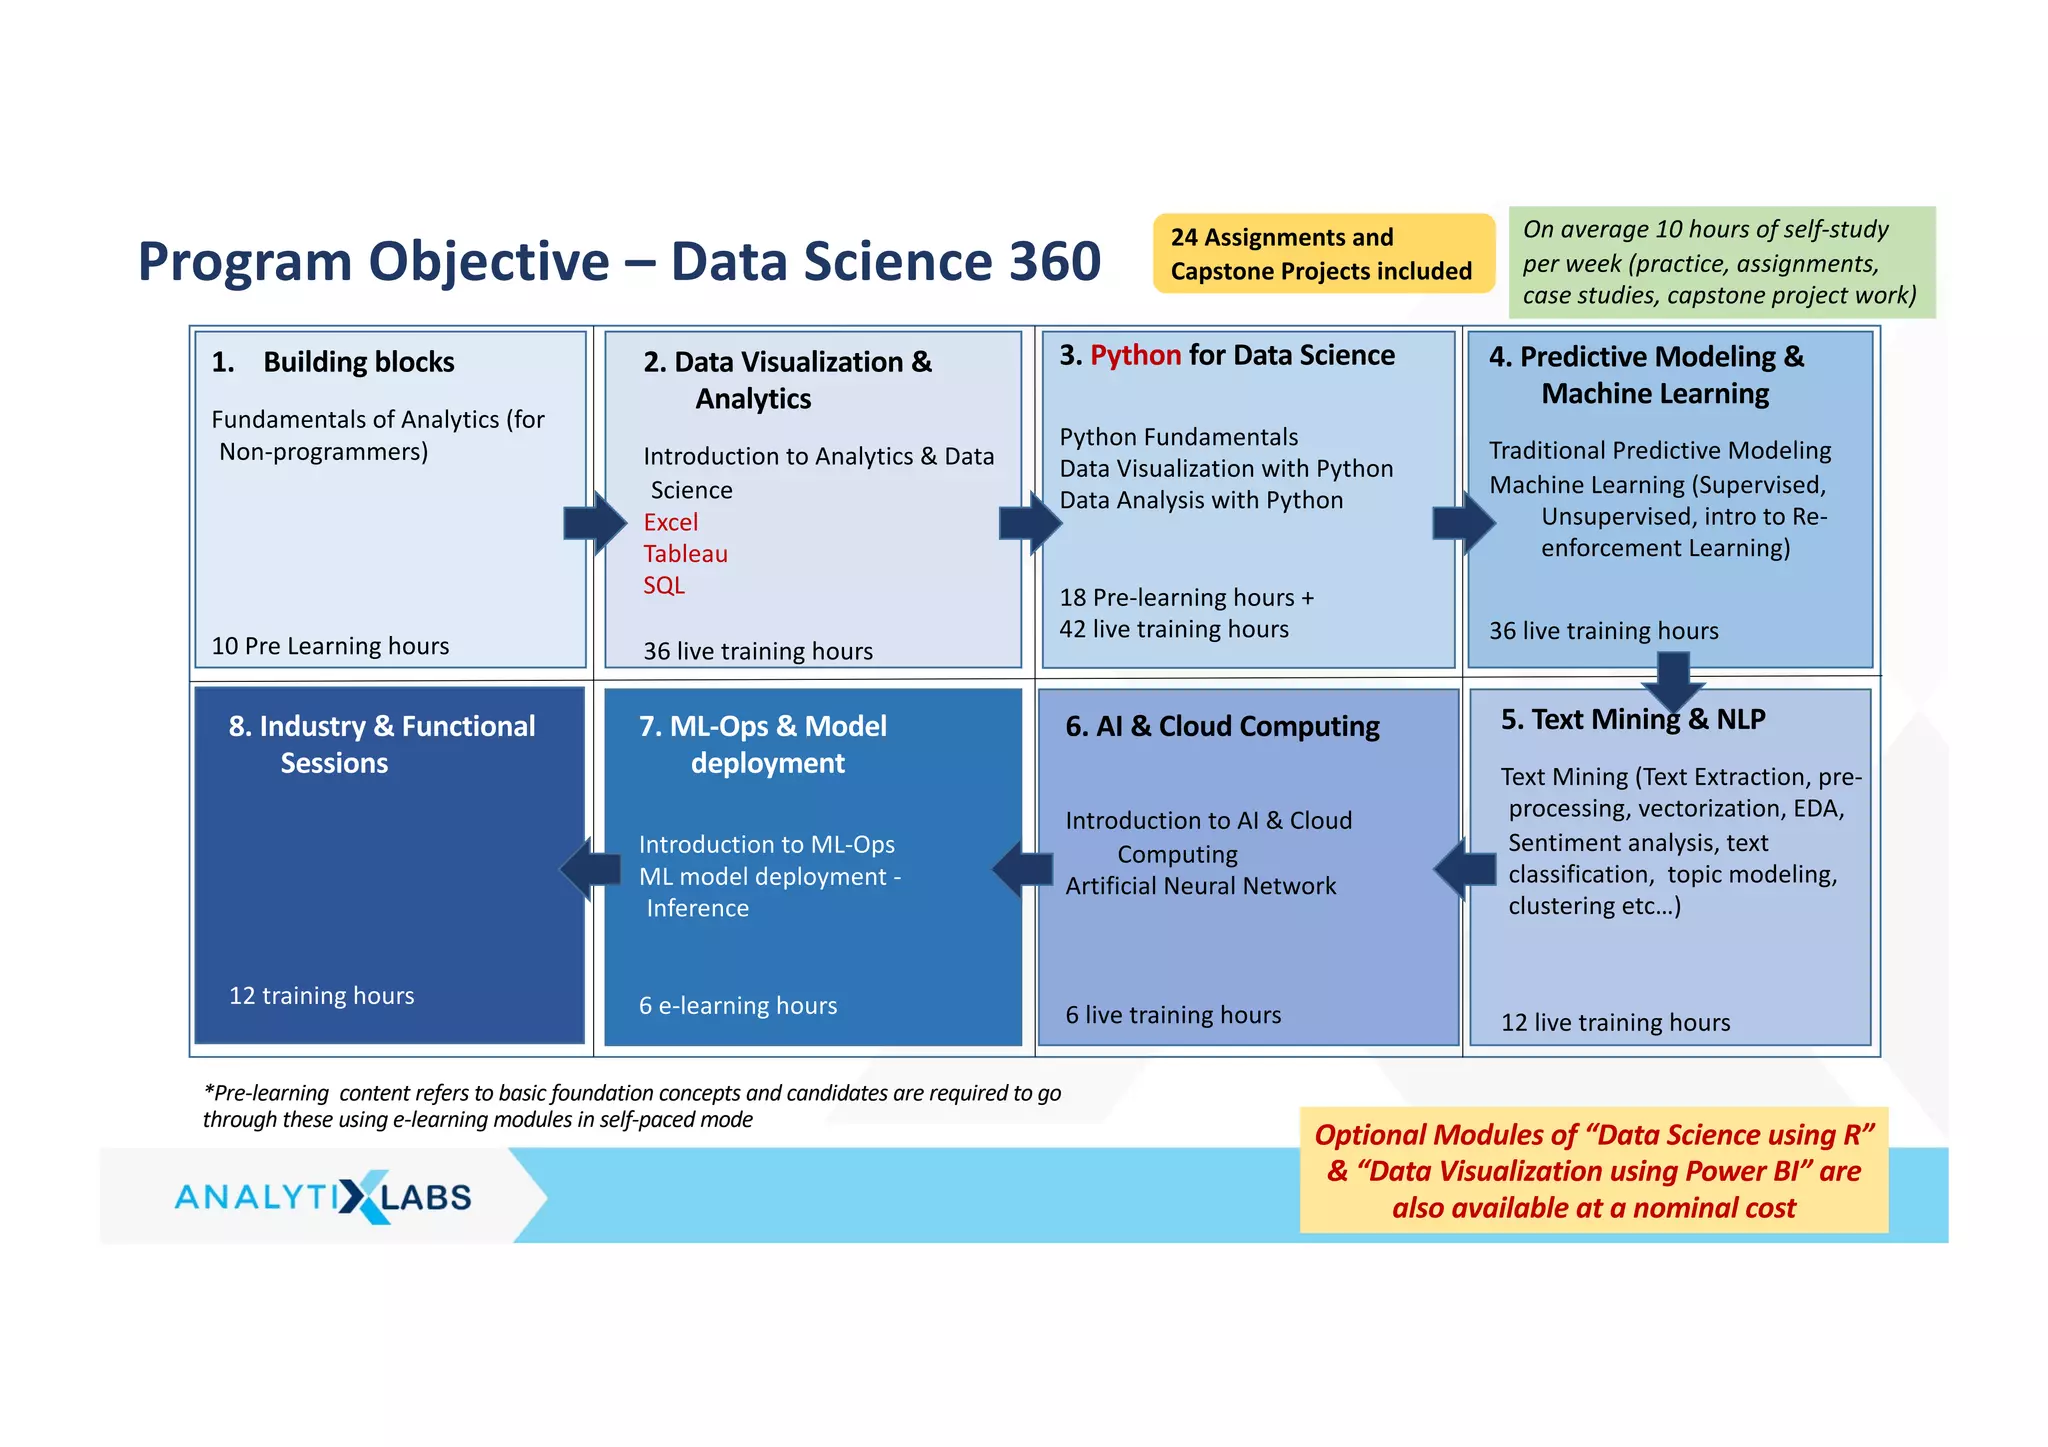
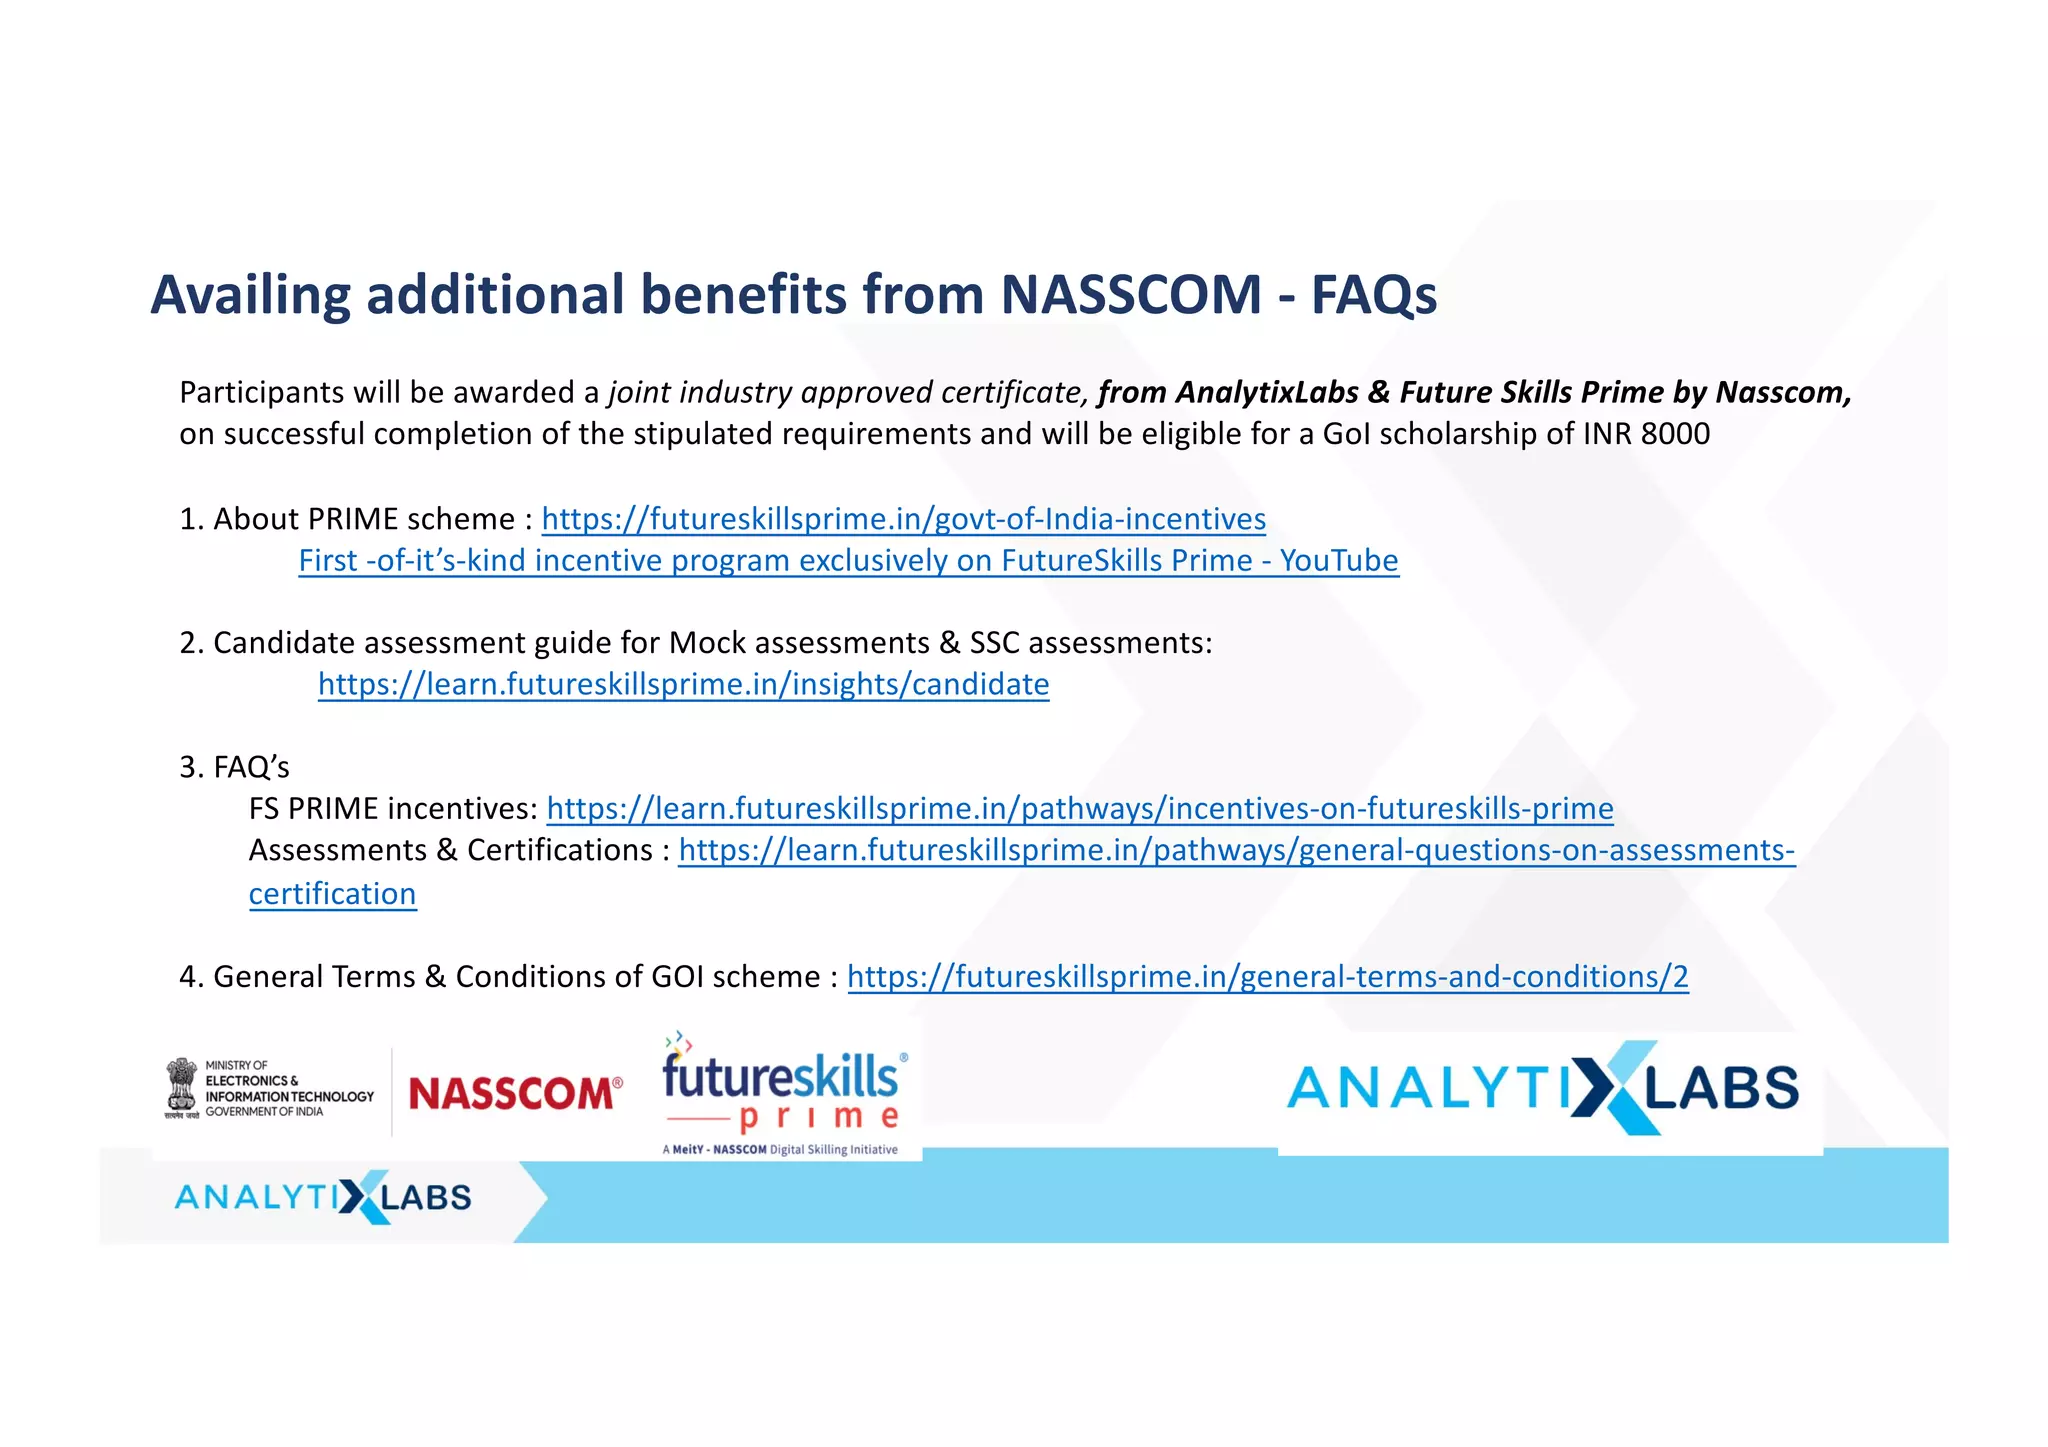
The document provides information about the Data Science 360 certification program offered by AnalytixLabs. It summarizes that the program focuses 80% on practical skills and industry best practices. It is led by experienced analytics professionals from top firms and includes high-quality course material, real-life case studies, and regular sessions with industry experts to help students become job-ready. Upon completion, students will receive a certificate and potential scholarship and job assistance.
![3. Python For Data Science (1/2)
Python Essentials (Core)
• Overview of Python- Starting with Python
• Why Python for data science?
• Anaconda vs. python
• Introduction to installation of Python
• Introduction to Python IDE's(Jupyter,/Ipython)
• Concept of Packages - Important packages
• NumPy, SciPy, scikit-learn, Pandas,
Matplotlib, etc
• Installing & loading Packages & Name Spaces
• Data Types & Data objects/structures (strings,
Tuples, Lists, Dictionaries)
• List and Dictionary Comprehensions
• Variable & Value Labels – Date & Time Values
• Basic Operations – Mathematical/string/date
• Control flow & conditional statements
• Debugging & Code profiling
• Python Built-in Functions (Text, numeric, date,
utility functions)
• User defined functions – Lambda functions
• Concept of apply functions
• Python – Objects – OOPs concepts
• How to create & call class and modules?
Operations with NumPy (Numerical Python)
• What is NumPy?
• Overview of functions & methods in NumPy
• Data structures in NumPy
• Creating arrays and initializing
• Reading arrays from files
• Special initializing functions
• Slicing and indexing
• Reshaping arrays
• Combining arrays
• NumPy Maths
Overview of Pandas
• What is pandas, its functions & methods
• Pandas Data Structures (Series & Data Frames)
• Creating Data Structures (Data import – reading
into pandas)
Cleansing Data with Python
• Understand the data
• Sub Setting / Filtering / Slicing Data
• Using [] brackets
• Using indexing or referring with column
names/rows
• Using functions
• Dropping rows & columns
• Mutation of table (Adding/deleting columns)
• Binning data (Binning numerical variables in to
categorical variables)
• Renaming columns or rows
• Sorting (by data/values, index)
• By one column or multiple columns
• Ascending or Descending
• Type conversions
• Setting index
• Handling duplicates /missing/Outliers
• Creating dummies from categorical data (using
get_dummies())
• Applying functions to all the variables in a data
frame (broadcasting)
• Data manipulation tools(Operators, Functions,
Packages, control structures, Loops, arrays etc.)
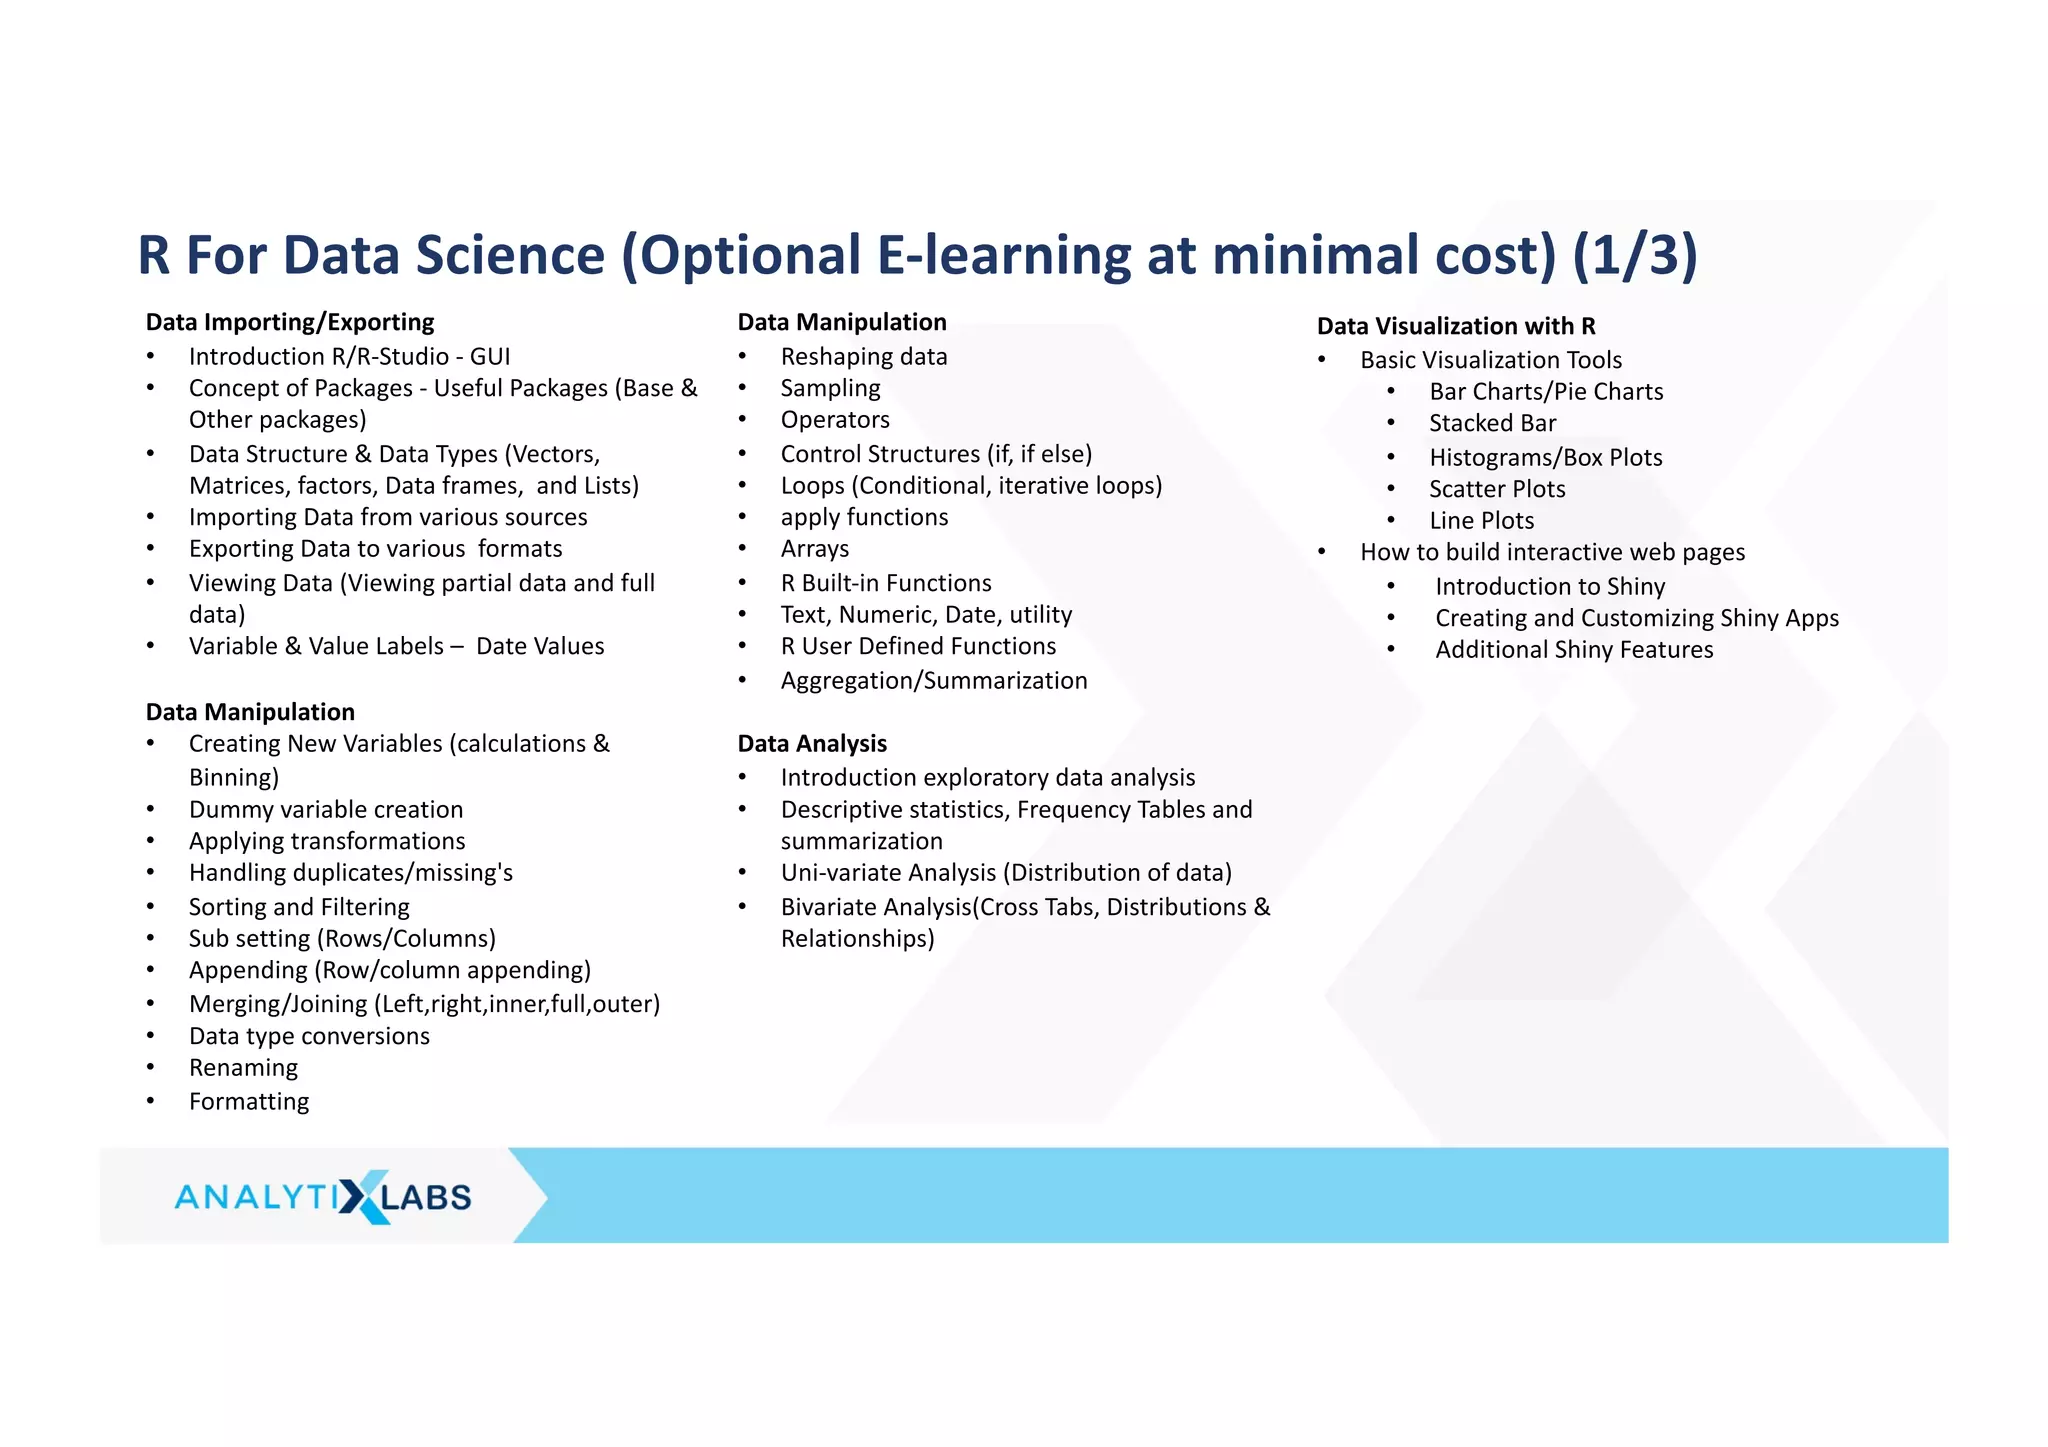
Data Analysis using Python
• Exploratory data analysis
• Descriptive statistics, Frequency Tables and
summarization
• Uni-variate Analysis (Distribution of data &
Graphical Analysis)
• Bi-Variate Analysis(Cross Tabs, Distributions &
Relationships, Graphical Analysis)](https://image.slidesharecdn.com/analytixlabs-datascience360nasscom-16481787202831-230305123728-fca36387/75/AnalytixLabs-Data-Science-360-Nasscom-1648178720283-1-pdf-11-2048.jpg)


![[DSC Europe 25] Ivan Peric - Intelligence Swarm Logic and Techno-Functional M...](https://cdn.slidesharecdn.com/ss_thumbnails/7my7c97fsduiccadgavw-2-251212103249-5a03f7c6-thumbnail.jpg?width=640&height=640&fit=bounds)


![[DSC Europe 25] Vladimir Jelic - The AI-Driven Security Shift From Reactive D...](https://cdn.slidesharecdn.com/ss_thumbnails/6g5gj25mtjwayniqem1t-6-251209104645-7a5a5fc6-thumbnail.jpg?width=640&height=640&fit=bounds)
![[DSC Europe 25] Branko Urosevic -Rethinking Financial Talent: Integrating Cod...](https://cdn.slidesharecdn.com/ss_thumbnails/8jjrus8ttko6qj64f58f-3-251212103250-642c6374-thumbnail.jpg?width=640&height=640&fit=bounds)
![[DSC Europe 25] Aleksandra Dragicevic - AI-Boosted Research in Healthcare: Fr...](https://cdn.slidesharecdn.com/ss_thumbnails/iqwngszurf2r7pi1lnnj-4-aleksandra-dragicevic-ad-dsc-europe-conference-20-251208151905-37c3238a-thumbnail.jpg?width=640&height=640&fit=bounds)
![[DSC Europe 25] Behzad Hosseini - AI Agents in the Wild: Deploying Models tha...](https://cdn.slidesharecdn.com/ss_thumbnails/3qtejajvsjqrzwfept2c-10-251212103250-7f2b1068-thumbnail.jpg?width=640&height=640&fit=bounds)


![[DSC Europe 25] Dunja Adzic Jovanovic - AI and Cybersecurity: Defending Data ...](https://cdn.slidesharecdn.com/ss_thumbnails/o1zylpbhrtwnixxq2xj8-7-251211083048-185086f6-thumbnail.jpg?width=640&height=640&fit=bounds)

![[DSC Europe 25] Bassam Maharmeh - Artificial Intelligence: Opportunities and ...](https://cdn.slidesharecdn.com/ss_thumbnails/thhfmr2fqpawzj7hsjpg-5-251211083048-2c23204f-thumbnail.jpg?width=640&height=640&fit=bounds)
![[DSC Europe 25] Milan Sekuloski - Data, Defence, and Development: Cybersecuri...](https://cdn.slidesharecdn.com/ss_thumbnails/dfrkwwx4qly6atqpbl4z-4-251209104645-c3d4b0ca-thumbnail.jpg?width=640&height=640&fit=bounds)

![[DSC Europe 25] Imai Jen-La Plante - The New Generation: AI and the Future of...](https://cdn.slidesharecdn.com/ss_thumbnails/kxi8t2l5rggivgcenyba-1-jenlaplante-dsc-251208152532-d1e076c2-thumbnail.jpg?width=640&height=640&fit=bounds)
![[DSC Europe 25] Milan Zdravkovic - The road less traveled in District Heating...](https://cdn.slidesharecdn.com/ss_thumbnails/nfaboniqwsz4ucyctnmy-2-milan-zdravkovic-dsc2025-the-road-less-traveled-in-district-heating-operation-251208151905-f56388a5-thumbnail.jpg?width=640&height=640&fit=bounds)


![[DSC Europe 25] Sara Polak - The Ancient Operating System: What Archaeology T...](https://cdn.slidesharecdn.com/ss_thumbnails/3vch2p6tttdnwhsgazoz-3-sara-polak-smart-cities-251208152532-64404202-thumbnail.jpg?width=640&height=640&fit=bounds)