Here are the measures of central tendency and variability I calculated from the given data:
Measures of Central Tendency:
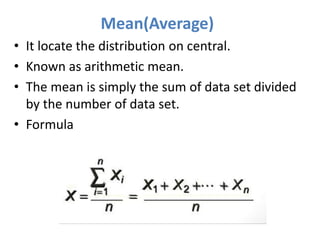
Mean = Sum of all values / Total number of observations
= (60 + 70 + 80 + 90 + 100 + 60 + 70 + 80 + 81 + 79) / 10
= 771 / 10 = 77.1
Measures of Variability:
Range = Highest value - Lowest value
= 100 - 60 = 40
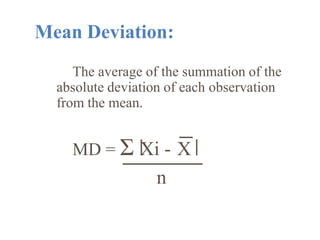
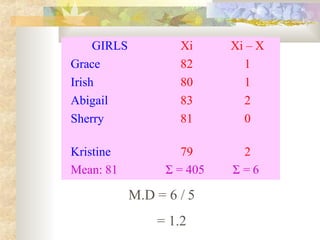
Mean Deviation = Sum of absolute deviations from the mean / Total number of observations
= |60 - 77.1| + |70 - 77.1| + ... + |79 - 77.1| / 10
= 62.1


![CASE_PRESENTATION_ON_subdural_hematoma(SDH)[1 FINAL PPT]-1.pptx](https://cdn.slidesharecdn.com/ss_thumbnails/casepresentationonsubduralhematomasdh1finalppt-1-260129172522-d405d375-thumbnail.jpg?width=640&height=640&fit=bounds)

