Next-generation AAM aircraft unveiled by Supernal, S-A2
Social network analysis (SNA) - Big data and social data - Telecommunications and more
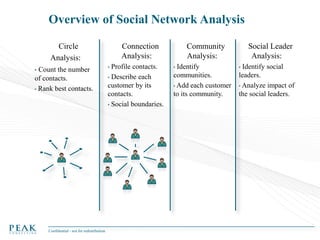
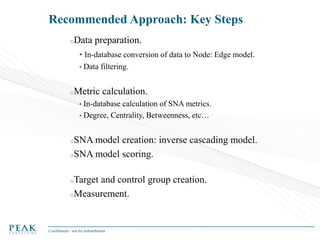
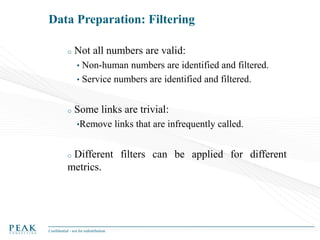
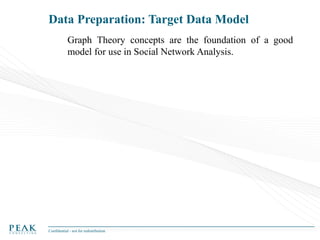
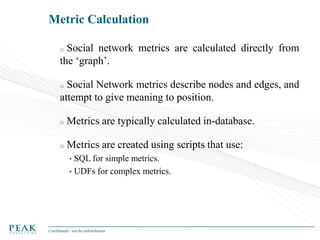
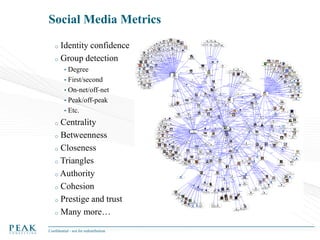
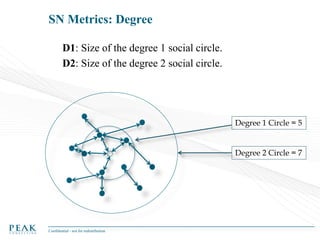
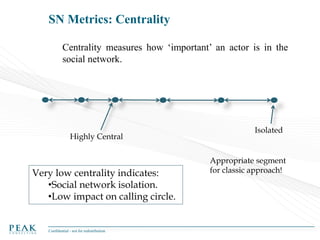
1. Social Network Analysis:
Practical Uses and Implementation
Presented by Wael Elrifai (WAEL@PEAKCONSULTING.EU)
London
-
New York
- Dubai - Hong Kong - Mumbai
2013
2. Table of Contents
Introduction
o Metrics and Implementation
o Social Network Analysis with Relationships
o Social Network Analysis with Transactions
o Conclusions
o
4. Definitions: Social Network
Social Network: A social structure composed of
individuals (or organizations) interconnected by one
or more specific types of interdependencies such as
friendship, kinship, financial exchanges,
communication exchanges, etc.
5. Definitions: Social Network Analysis
Social Network Analysis: The application of graph
theory to understand, categorize and quantify
relationships in a social network.
In the representation of a social network, nodes in
a graph represent the individuals or organizations
(actors) and edges in the graph represent
interdependencies. Edges may be either directed or
non-directed.
Confidential - not for redistribution
6. Why should you care about SNA?
oCustomer
are sceptical: if you want to sell your products
to your customers, convince their friends.
oIf
you want to sell lots of stuff to your customers… do it
in a viral way (target the “right” customers).
oUse
social network analysis to understand more about
your customers and their communities.
oEnhance
existing reports, modelling
methodologies with social metrics.
Confidential - not for redistribution
tools,
and
7. Why should you care about SNA?
Traditional marketing practices are becoming obsolete.
Test and control group methodologies no longer work as
intended.
o
•Information
exchange between individuals within an online social
network is extremely high.
•Difficult to keep control group “pure”.
Need to understand behaviour across and within
communities rather than focusing just on individuals.
o
Leverage (and protect against) high velocity of
information exchange within on-line social networks.
o
Confidential - not for redistribution
8. How does a Customer with the Role of an Influencer in
the Social Network Work?
Influential user adopts a product or behaviour.
o Influential user tells (and influences) his or her
immediate contacts within the community.
o These immediate contacts tell their contacts.
o ...and the viral marketing spreads.
o
It is important…
• To identify these people.
• To influence these people.
• To monitor the behaviour of these people.
Confidential - not for redistribution
9. Roles in a social Network
Malcom Gladwell characterized key actors in a social network
in his seminal work The Tipping Point:
Connector: people who “link us up with the world … people
with a special gift for bringing the world together”. Gladwell
characterizes these individuals as having social networks of
over one hundred people.
Salesperson: people who are charismatic with powerful
negotiation skills. They tend to have an indefinable trait that
goes beyond what they say, which makes others want to agree
with them.
Maven: people who are “information specialists” or “people
we rely upon to connect us with new information”. They
accumulate knowledge, especially about the marketplace, and
know how to share it with others.
Confidential - not for redistribution
10. Social Network Analysis
Recommended Approach
The Social Network
1.
Identify the Social Network
•Who contacts whom?
•How often?
•How long?
•Both directions?
•On Net, Off Net?
2.
There is no ‘general’
Identify Influencers for each Topic
influencer!
•Who influence whom, how much,
on what purchases?
Price
•Who influences whom, how much
John’s father
John
on churn?
•Who will acquire others?
Technology
Confidential - not for redistribution
11. Definitions: Social Network Analysis
Rather than treating individuals (persons, organizations) as
discrete units of analysis, social network analysis focuses on how
the structure of ties (links) affects individuals and their
relationships.
Not a new science:
oStarted
in the social sciences.
oFormalized by J.A. Barnes 50+ years ago.
oSix degrees of separation small world phenomena.
• Stanley Milgram’s post mail experiments.
• Watts, Dodds, Muhamed email study.
A boom of popular press:
oGladwell:
The tipping Point
oWatts: Small Worlds: The Dynamics of Networks Berween Order and
Randomness.
oBarabasi: Linked: The New Science of Networks
oWatts: Six Degrees: The Science of a Connected Age
Confidential - not for redistribution
12. Definitions: Graph Theory
Directed Edges: Captures the “direction” of a
relationship. For example, A calls B would have a
different direction than B calls A.
Non-directed Edges: Relationship has no direction.
For example A is married to B is the same as B is
married to A.
Edges can be binary (e.g., exist or not) or weighted
(e.g., representing a count of the number of calls
between two individuals).
Confidential - not for redistribution
13. Definitions: Graph Theory
A scale-free network is a network whose degree
distribution follows a power law, at least asymptotically.
That is, the fraction P(K) of nodes in the network having
k connections to other nodes goes for large values of k as
P(K) ~ K-Y where Y is a constant whose value is typically
in the range 2 < Y < 3, although occasionally it may lie
outside these bounds.
Node connectivity is defined by power law.
Confidential - not for redistribution
14. Definitions: Graph Theory
The shape of a social network can influence its behaviour
and usefulness.
“Closed” social networks are tightly knit with many
redundant ties.
• In-breeding of ideas: persons who only interact with
each other share the same ideas and opportunities.
• Characterized by a (near) fully connected graph.
o
“Open” social networks have loose ties (weak links)
across multiple communities.
• More likely to introduce new ideas and opportunities
to their members.
• Requires connector nodes to bridge across.
o
Confidential - not for redistribution
15. Definitions: Graph Theory
A clique is a fully connected set of nodes within a graph.
o An N-Clique is a subgraph of N nodes (actors) which are
fully connected (“closed” network).
o Maximum clique detection within a graph is an NPcomplete computational problem.
o A K-plex is a less strict subset of the graph.
o A giant component is a connected subgraph that contains
a majority of an entire graph’s nodes.
o
Confidential - not for redistribution
16. Social Network Analysis
Circle analysis:
o Neighbours of a node.
o
Count neighbours (degree).
o
Count those in circle@
• Who churned,
• Who have a product P,
• Who became customers after node A,
• …..
o
Enrich node label with these metrics.
Confidential - not for redistribution
A
17. Key Observation: Few Isolated Communities
Exist in the Real World
Most
subscribers are part
of a single mega-community.
Splitting them up requires
artificial decisions.
Experiment:
oFive random starting
osubscribers.
oCount number of new subscribers in degree 1,
degree 2, etc.
oConclusion:
• Peak numbers between degree 5 and degree 7.
• Very few new subscribers after degree 8.
• Most subscribers are interconnected, rather than in
discrete communities.
Confidential - not for redistribution
18. Key Observation: Few Isolated Communities
Exist in the Real World
An example with real world data:
73,277
Singletons
15,666
2,658
653
pairs
triangles
From 5 to 22 nodes:
- 320 communities.
- 1905 nodes.
squares
Large Component of 1.1M nodes
(with off-network nodes = 3.6M)
Confidential - not for redistribution
20. Calculation of Metrics from a Social Network
o
In networks, connection is power.
• Centrality is a key measure.
• “Social Degree” measures how well a node
is connected.
An “influencer” is a node that is well
connected.
o
•
Capable of propagating information to
lots of people via Word-of-Mouth
(Mouse).
There exist many measures to identify
the power to influence.
o
•
Depending on your data, some might be
easier to compute than others.
• Some might bring more useful information
than others.
Confidential - not for redistribution
21. Overview of Social Network Analysis
Circle
Analysis:
Count the number
of contacts.
• Rank best contacts.
•
Confidential - not for redistribution
Connection
Analysis:
Profile contacts.
• Describe each
customer by its
contacts.
• Social boundaries.
•
Community
Analysis:
Identify
communities.
• Add each customer
to its community.
•
Social Leader
Analysis:
Identify social
leaders.
• Analyze impact of
the social leaders.
•
22. Recommended Approach: Key Steps
oData
preparation.
• In-database conversion of data to Node: Edge model.
•
Data filtering.
oMetric
calculation.
•
In-database calculation of SNA metrics.
• Degree, Centrality, Betweenness, etc…
oSNA
model creation: inverse cascading model.
oSNA model scoring.
oTarget
and control group creation.
oMeasurement.
Confidential - not for redistribution
23. Data Preparation Example:
From XDR to Node/Edge Graph
oA
can communicate with B in various ways:
Voice, SMS, MMA. Thus, we allow a separate
Edge for each type of communication.
Master Out 8
Voice Out 6
SMS Out 1
A
The Mater Edge defines that a
communication exists, and is irrespective of
the actual type.
o
MMS Out 1
B
MMS In 2
SMS In 3
Voice Out 20
Master Out 25
Performed for on-net
and off-net numbers.
Of course, B can reciprocate communicate
with A in various ways also: Voice, SMS or
MMS. Thus, we allow a separate Edge for that
too.
o
That means from A’s perspective there could
be a maximum of 8 Edges associated with A if
all communication types are used and
reciprocated with B.
o
o
Confidential - not for redistribution
Edge IDs are unique system wide.
24. Data Preparation: Filtering
o
Not all numbers are valid:
•
Non-human numbers are identified and filtered.
• Service numbers are identified and filtered.
o
Some links are trivial:
•Remove
links that are infrequently called.
Different filters can be applied for different
metrics.
o
Confidential - not for redistribution
25. Data Preparation: Target Data Model
Graph Theory concepts are the foundation of a good
model for use in Social Network Analysis.
Confidential - not for redistribution
26. Metric Calculation
Social network metrics are calculated directly from
the ‘graph’.
o
Social Network metrics describe nodes and edges, and
attempt to give meaning to position.
o
o
Metrics are typically calculated in-database.
o
Metrics are created using scripts that use:
•
SQL for simple metrics.
• UDFs for complex metrics.
Confidential - not for redistribution
27. Social Media Metrics
Identity confidence
o Group detection
o
•
Degree
• First/second
• On-net/off-net
• Peak/off-peak
• Etc.
Centrality
o Betweenness
o Closeness
o Triangles
o Authority
o Cohesion
o Prestige and trust
o Many more…
o
Confidential - not for redistribution
28. SN Metrics: Degree
D1: Size of the degree 1 social circle.
D2: Size of the degree 2 social circle.
Degree 1 Circle = 5
Degree 2 Circle = 7
Confidential - not for redistribution
29. SN Metrics: Centrality
Centrality measures how ‘important’ an actor is in the
social network.
Highly Central
Very low centrality indicates:
•Social network isolation.
•Low impact on calling circle.
Confidential - not for redistribution
Isolated
Appropriate segment
for classic approach!
30. Centrality According to Philip Bonacich
Being connected to many people is good, but what indicates the
most influence is to be connected to ‘important’ people.
• Similar to Google’s page rank.
o Bonacich Centrality measures the total number of paths starting
from a node, with a decay factor favouring shorter paths over
longer ones.
• C is vector of centralities
• A is graph matrix.
• Alpha is a scaling factor.
• Beta is decay factor between 0 and 1.
• C = alpha * SUM _ (k = 0 to infinity) Beta ^ k * A ^ (k + 1)
• If Beta = 0, this is degree count.
• If Beta = 1, this is eigenvalue centrality (page rank).
Ideal for computation in parallel!
o
Confidential - not for redistribution
31. Examples of Bonacich Centrality
(with decay factor of 0.5)
0.64
1.12
1.12
11.28
0.76
0.76
1
0.64
1
1
0.76
1.77
1
1
1
0.73
0.76
0.76
1.30
0.73
Confidential - not for redistribution
1.46
1.30
0.73
0.73
32. SN Metrics: Reciprocal Degree
RD: Reciprocal Degree.
- Communication in both directions.
Reciprocal
Edge
Reciprocal Degree = 2
Confidential - not for redistribution
33. SN Metrics: In-Network Degree
RDNetwork: Reciprocal Degree within the network.
- Communication on-network in both directions.
Reciprocal
Edge
Network
Reciprocal Degree within Network = 1
Confidential - not for redistribution
34. SN Metrics: Triangles
TRG: a count of the number of triangles within a
social network involving a particular focus node.
Degree of interconnectedness in the social network.
In this example, four triangles
exist within the social network
– three of which involve the
focus node.
Triangles = 3
Confidential - not for redistribution
35. SN Metrics: Betweenness
Betweenness: The number of node pairs that have only a
direct link through the focus node.
This is a simpler (faster) calculation than the more precise
definition that involves an all node pair shortest path
calculation.
Betweenness is a measure of how essential the focus node
is to facilitate communication within the social network.
Betweenness = 6
These subscribers
need the focus node
to communicate
with each other.
Confidential - not for redistribution
These
subscribers
do not..
36. SN Metrics: Density
DEN: Density is the number of actual edges divided by
the number of possible edges (n * ( n – 1 ) / 2) within a
social network (simplified).
How dense is the calling pattern within the calling
circle?
Low if many nodes in the calling circle are not
connected. Usually low when calling circle is large.
Inversely related to Betweenness.
Density = 3/10
Confidential - not for redistribution
Only three edges for a
calling circle of five nodes.
37. Social Network Model Creation
Models are created using SN metrics and other
data.
o
Apply the inverse cascading model: Edges are
modelled for the chance that a message or behaviour
will be transmitted.
o
o
Example types of models:
•
Churn risk: how likely is churn spread from A to B?
• Product/service spread: if A uses product/service X,
how likely is it to be taken up by B?
• Viral marketing: if we send A an offer, will they pass
it to B?
Confidential - not for redistribution
38. Example: Product Affinity Model Timeline
Focus Node
t0
Feb
Mar
Training ADS
Apr
May
June
July
Target
At t0 the subscriber is still active.
o He does not have product X.
o Has a non-trivial centrality score.
o Positive target:
o
• Within
30 days of t0 the subscriber adopts product X.
Confidential - not for redistribution
39. Example: Viral Adoption Model Timeline
Focus Node
Adjacent Node
t0
Feb
Mar
Training ADS
Apr
May
June
July
Target
At t0 the subscriber is still active.
o He does not have product X.
o Has a non-trivial centrality score.
o Positive target:
o
• Within
30 days of t0 the subscriber adopts product X.
Confidential - not for redistribution
40. Example: Model Inputs
Affinity Model
Viral Model
Usage History
SN Metrics
Focus Node:
Usage History
SN Metrics
Adjacent Node:
Usage History
SN Metrics
Historical Edge
Information:
Edge Usage History
Confidential - not for redistribution
41. Measurement and Testing
o
Need to define target and control groups.
The number and size of control groups will vary
according to the effect being testing:
• Control group for direct take up.
• Control group for viral take up.
• Control groups for different messages.
o
o
For example: to control for a X-sell message and model
• A group of high scoring customers should not be
contacted ( control of message).
• A group of low scoring customers should be contacted
(control of model).
Confidential - not for redistribution
42. Data Mining Using Social Network Analysis
Confidential - not for redistribution
43. Output of Social Network Analysis
oA
set of metrics than can be input to other analytics and
directly to marketing actions. These metrics are applied to each
customer:
•
Degree
• Centrality
• Betweenness
• Triangles
• Etc.
SN Metrics along with traditional attributes are used to derive
characteristics such as influence, but these should scored
relative to specific topics (price, technology, churn, etc.)
o
o Analysis
is often done in the context of specific
domains…defining time horizon for the analysis, customer
segments, types of call to consider, weekly vs weekend call
patterns, filtering outliers calls, etc.
Confidential - not for redistribution
45. Social Networks are Not New to Analytics
The idea of understanding relationships to enhance
analytic capabilities is not a new idea.
o Householding, for example, is something that most
sophisticated analytic organizations have been doing
for years.
o Most common use cases:
• Marketing analytics.
• Risk analytics.
• Crime investigation.
• Health care.
o Householding is a very simple form of network
analysis.
o
Confidential - not for redistribution
46. Traditional Householding
Construction of ‘decision-making units’ based on social
relationships (marriage, co-habitation) for the purpose of
marketing and risk analytics.
Traditional relationship indicators:
•Common address.
•Common last name.
•Marital (or other) relationships.
New scoring variables:
•Pooled assets.
•Pooled purchases.
•Pooled behaviours.
•Derived ‘head of household’ variables.
Used to construct new variables for the purpose of propensity
scoring, risk scoring, segmentation, etc.
Tracking of relationships over time to give visibility to life stage
transitions.
Confidential - not for redistribution
47. Classic example: 15th Century Florence Family
Politics (Padgett, 1994)
o
o
Degree.
o
Centrality.
o
Betweenness.
o
Geodesic distance.
o
Influence.
o
Confidential - not for redistribution
Links are marriages.
Pressure.
48. Beyond Householding
Extend an understanding of name, address, and
marital relationships to other kinds of relationships:
Investment accounts
• Credit card accounts
• Mortgages
• Insurance policies
• Frequent flyer accounts
• Buyer-supplier relationships
• Many other possibilities…
•
Confidential - not for redistribution
49. Beyond Householding
There are many different kinds of relationships:
Joint tenancy with rights of survivorship versus
primary owner on a financial account.
• Credit guarantor (co-signer) versus recipient on a loan
or credit card.
• Custodian versus trustee on a financial account.
• Beneficiary versus owner on a life insurance policy.
• Insured versus payer on a driver’s insurance policy.
• Sponsor versus recipient for frequent flyer status.
• And so on…
•
Confidential - not for redistribution
50. Marketing Analytics Use Cases
Customer acquisition.
o Cross Selling.
o Customer retention.
o Price bundling.
o Profitability management.
o Customer segmentation.
o
Key concept: Derive new variables for analytic
purposes based on characteristics and events related
to a group of individuals (social network) rather than
looking at individuals in isolation.
Confidential - not for redistribution
51. Marketing Analytics Use Cases
Simple extension of model variables from an individual level to a
household level gives significant uplift in predictive accuracy:
• Total
customer value by product category
• Total number of accounts or purchases by product category
• Date of last account open or purchase by product category
• Date of first account open or purchase by product category
• Date of last account close or purchase by product category
• Date of first account close or purchase by product category
• Date of last inquiry
• Date of first inquiry
• Total number of inquiries in the last three months
• Total number of inquiries over customer lifetime
• Date of last complaint.
• Date of first complaint
• Total number of complaints in last three months
• Total number of complaints over customer lifetime
• Etc..
Confidential - not for redistribution
52. Customer Retention by Identifying At-Risk
for Defection Relationships
Individual defection impacts household defection:
When one individual closes all accounts or has a bad
experience, all individuals in the household may be put at
risk. Retention programs identifying these situations can be
put into place to ‘save’ at-risk for defection customers.
Broker defection impacts customer defection:
If the broker for a customer of a financial or insurance
company takes a job with the competition, the customer is
likely to be highly at-risk for defection. Again, explicit
retention programs can be used to ‘save’ these customers.
Important note: roles in the relationships matter.
Confidential - not for redistribution
53. Risk Analytics Use Cases
Better understand financial risk of incurring bad debt
based on relationships:
•
Scoring for consumer loans/collections based on
household characteristics rather than on an
individual in isolation.
•
Scoring for commercial loans/collections based
on supplier and/or customer relationships with
insight related to industry or customer
concentration as a measure of risk.
Confidential - not for redistribution
54. Crime Investigation Use Cases
Fraud rings.
• Likely suspects.
• Terrorist networks.
•
Confidential - not for redistribution
56. Health Care Use Cases
Understanding relationships helps to determine
how diseases spread and therefore how to
better perform disease management:
Tracing epidemics to their origin.
• Prioritizing vaccines and health education.
•
Confidential - not for redistribution
58. Social Network Analysis with Transactions
Relationships can be inferred through transactions.
There are many different kinds of transactions:
• Telephone calls.
• Messages (SMS, MMS, etc.)
• Emails.
• Package Shipments.
• Financial transactions.
• Physician referrals.
Cardinality of transactions can be used to indicate
intensity of the relationship.
Confidential - not for redistribution
59. Employee Retention
Google was given a ‘2010 Best HR Ideas’ award from HR
Executive for using analytics to improve employee retention.
Social network analysis can enhance algorithms used to
predict risk of defection.
Use intra-company interactions to understand social network
within the company:
•Telephone
calls.
•Messages (SMS, MMS, etc.)
•Emails.
•Meeting interactions.
•Organizational Structure.
•How ‘connected’ is the employee to the company?
•If one employee leaves, what is the risk of defection for adjacent
nodes in that employees social network.
Combine SN Metrics with traditional metrics (salary, years of
service, performance evaluations, commute distance, etc.) to
build predictive models.
Confidential - not for redistribution
60. Organizational Effectiveness
Social network analysis can be used to build algorithms to identify
dysfunctions within an organization.
Use intra-company interactions to understand social network within
the company:
Telephone calls.
• Messages (SMS, MMS, etc,.)
• Emails.
• Meeting interactions.
• Organizational Structure.
• What is the level (intensity) of communication between departments that
should be cooperating?
• What is the richness’ and ‘diversity’ of the communications between
departments?
• Always email with no face-to-face meetings or telephone conversations
may indicate a problem.
• Are there a small number of connectors between the departments?
•
• At
what level are they within the organization?
Confidential - not for redistribution
61. Social Network Analysis (SNA)
in Telecommunications
Social Network Analysis (SNA) is focused on the relations
between subscribers (customers); traditional propensity or
segmentation models are based on individual subscriber attributes.
Map of ties among subscribers provide a useful framework to
identify role played by each individual within the network.
Ties between two subscribers can be identified using voice, calls,
sms, mms, etc.
SNA is often used to:
Define targeted treatments based on network roles of an
individual to encourage/discourage specific events (churn,
acquisition, product adoption).
Monitor new product adoption by studying diffusion within a
social network.
Identify unusual behaviours (fraud detection).
Confidential - not for redistribution
62. Social Network Analysis for Mobile Network
Operators
Mobile communication is an essential and basic
form of communication between persons in a
social network.
o
There are many communication
channels/mediums; call data captures just a portion
of communication among people.
o
Data availability is quite good for mobile
network operators who capture CDR data – more
data leads to better results.
o
Confidential - not for redistribution
63. Application of Social Network Analysis
Critical success factors for effective
social network analysis:
Need a critical mass of mobile
phone penetration within the country.
Market share matters:
•
New versus established operators.
• The flower pattern.
Data collection: Need detailed and cleaned history
data.
Understand the profile of your customers
segments (consumer, small business, corporate,
pre-paid, post-paid, etc.)
Confidential - not for redistribution
64. Application of Social Network Analysis
Challenges with high returns:
• Uncover hidden social network information in your data
– such as phone books in the phones of subscribers.
• Identify key parameters of measured call data
(normalization, skew elimination).
• Separate random connections and weak connections.
• Understand the size and density of the social network.
• Understand the dynamics in the social network: stable
versus volatile communities.
• Target selection, test/control groups, and measurement.
• Read correctly and understand the results of the Social
Network Analysis.
Confidential - not for redistribution
65. What Kind of Social Networks can be created?
CDRs (Call Detail Records) are generated for each call:
Node1
Node 2
Date
Class
Duration
705 626 2002
416 414 6454
1 Dec 07
Voice
00:04:22
778 388 4363
604 805 5682
1 Dec 07
SMS
00:00:12
…
…
…
…
…
From these CDRs, many different social networks can be built:
•Product
focused:
•Voice Network (Individual A calls Individual B on voice)
•SMS Network (Individual A sends a SMS to Individual B)
•MMS Network *Individual A sends a MMS to Individual B)
•All services Network (Individual A calls or sends SMS or MMS to B)
•Intensiity focused:
•At least 5 communications; duration at least 15 seconds.
•Period focused:
•Interactions during this month, or week, or day…
•Directed or Un-directed
Using different definitions to calculate links gives different networks
for different purposes.
Confidential - not for redistribution
66. Network Structure
Weak ties: Connection between
communities; connection to the rest of the
‘World’.
Strong ties: Communication ties with high
call frequency and/or high call duration.
Importance of ties from the perspective of:
•
Information diffusion..
• Networrk integrity.
• Kind of tie (driend, intimate, parent/child).
Confidential - not for redistribution
67. Calculating Social Network Attributes
•Counts
for incoming and outgoing contacts.
•Triangle counts (centrality measure).
•First Circle Statistics: counts, averages,
proportions. Separate counts for nominal variables
(gender, brand).
•Counts and ratios for neighbours on-network and
off-network.
•Sums for link labels (total minutes between
phones).
•Statistics for the community of a user (more than
first circle).
Confidential - not for redistribution
69. Conclusions on Social Network Analysis
o
Social Network Analysis is not a silver bullet:
•
Can enrich existing marketing, fraud detection, and
other analytic capabilities…
• ….but does not replace traditional analytical
techniques.
• Combine SN Metrics with traditional metrics for
scoring.
Social Network Analysis provides insights as to
how individual customers behave in the context of
larger communities.
o
•
Need to think differently about test and control groups.
• Viral marketing opportunities.
Confidential - not for redistribution
70. Conclusions on Social Network Analysis
The success of marketing with techniques based on Social
Network Analysis will depend on many factors:
•
Success rates will be different in different cultures and
demographic groups.
• What works in Europe will be different from what works in
Asia or the United States.
The answers are in your data!
For marketing activities to have a viral component there has
to be value to both the A and B nodes:
• Value
can be in terms of prestige (true viral marketing) or can
be financial.
• Most marketing messages have no viral component.
• Any viral marketing must have a fulfilment method to match.
• Product and offer characteristics can have a dramatic impact on
effectiveness of program targeting.
Confidential - not for redistribution
71. Conclusions on Social Network Analysis
Data! Data! Data!
•It’s
all about the data!
•Don’t under estimate the amount of work and time required to
cleanse and understand the data.
•Want to combine event data with SN data to maximize impact.
•Scalable solutions needed when dealing with large volumes of
data.
Social Network Analysis is different than traditional
analysis.
•New
lingo, new concepts.
•Many different forms of SNA.
•Lots of market confusion between social network analysis and
social media analysis.
•Want to track how networks change over time.
•Measure, learn and improve.
Confidential - not for redistribution
72. Contact PEAK for more information
You can reach me directly at WAEL@PEAKCONSULTING.EU
or by calling me directly at +44 74 4743 0757.
www.peakconsulting.eu
Confidential - not for redistribution
73. Recommended Reading
Gladwell, M. The Tipping Point. Little Brown, and Company.
2002.
Green, H. The Rise of Niche Social Networks and that Money
Question. Business Week. On-line Blog. March 15, 2007.
Finkeldey, D. and V. Liu. User Survey Analysis: U.S. SocialMedia Adoption Across Industries. Gartner Research Presentation.
2009.
Pandit, S., D. Chau, S. Wang, and C. Faloutsos.
NetProbe: A Fast and Scalable System for Fraud Detection in
Online Auction Networks. Proceedings of WWW 2007. 2007. pp.
201-210.
Confidential - not for redistribution