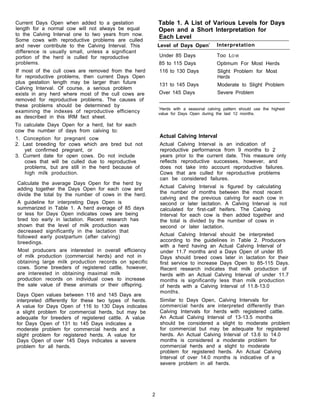
Interpreting Reproductive                                                                             IRM-5

Efficiency Indexes
                                                                                  Dairy Integrated
                                                                                  Reproductive
                                                                                  Management
Dr. M.A. Varner, Dr. J.L. Majeskie,
and S.C. Garlichs
University of Maryland


Introduction                                           The breeding records necessary for calculation of
                                                       the indexes discussed in this fact sheet are:
Reproductive efficiency is the ability of a dairy
producer to get cows bred back rapidly after           1. Date (month, day, and year) of the most recent
calving with a minimum number of breedings per            calving
cow. Inefficient reproduction decreases profit by      2. Date of the previous calving for second and
reducing both the efficiency of milk production            later lactation cows
and the number of available replacement heifers.
                                                       3. Reproductive status (pregnant, open, and bred
Also, there may be increased breeding costs and
                                                          but too early to detect pregnancy)
veterinary fees. Breeding records, summarized as a
reproductive efficiency index, provide the best        4. Number of breedings for all cows, and
indication of breeding problems. More importantly,     5. Date(s) of first breeding and most recent
indexes can give clues as to what the cause of            breeding if a cow has been bred more than
problems might be.                                        once.
Reproductive efficiency indexes are also useful to
dairy producers who currently do not have              Indexes of
problems getting cows pregnant. Trends in these        Reproductive Efficiency
indexes can be used to detect problems as they
develop. Steps to correct the problem can be taken     Days Open
before the problem becomes more serious.               Days Open measures overall reproductive
The index values for a herd should not be              performance for the previous 12 months. Problems
compared only to guidelines contained in this fact     with fertility (Fact Sheet IRM-10) and/or estrous
sheet, but also to index values for the state and/or   detection (Fact Sheet IRM-6) increase Days Open.
county in which the herd is located. The guidelines    Projected Minimum Calving Interval is calculated
are goals for optimal efficiency. Regional             by adding Days Open to the gestation length for a
differences, such as weather, may make goals           normal cow. It is interpreted in a manner similar to
more difficult to reach for some producers.            Days Open.
Consequently, comparing state and county index         A small portion of cows with high Days Open
values to herd values can provide an indication of     usually inflates the herd’s average Days Open to a
how good a job a particular producer is doing          small degree. If Days Open is inflated significantly
when compared to neighbors. State and/or county        by a few problem breeding cows, these cows
values can usually be obtained from Cooperative        should be culled. The culling policy for
Extension Service state specialists or county          reproductive problems in the herd should be
agents.                                                examined. Fact Sheet IRM-17 can provide a basis
                                                       for understanding the costs of keeping problem
                                                       breeders in the herd too long.
Current Days Open when added to a gestation                 Table 1. A List of Various Levels for Days
length for a normal cow will not always be equal            Open and a Short Interpretation for
to the Calving Interval one to two years from now.
Some cows with reproductive problems are culled
                                                            Each Level
and never contribute to the Calving Interval. This          Level of Days Open1         Interpretation
difference is usually small, unless a significant
portion of the herd is culled for reproductive              Under 85 Days               Too LO W
problems.                                                   85 to 115 Days              Optimum For Most Herds
If most of the cull cows are removed from the herd          116 to 130 Days             Slight Problem for Most
for reproductive problems, then current Days Open                                       Herds
plus gestation length may be larger than future             131 to 145 Days             Moderate to Slight Problem
Calving Interval. Of course, a serious problem
exists in any herd where most of the cull cows are          Over 145 Days               Severe Problem
removed for reproductive problems. The causes of
these problems should be determined by                      1
                                                              Herds with a seasonal calving pattern should use the highest
examining the indexes of reproductive efficiency            value for Days Open during the last 12 months.
as described in this IRM fact sheet.
To calculate Days Open for a herd, list for each
cow the number of days from calving to:
1. Conception for pregnant cow                              Actual Calving Interval
2. Last breeding for cows which are bred but not            Actual Calving Interval is an indication of
    yet confirmed pregnant, or                              reproductive performance from 9 months to 2
3. Current date for open cows. Do not include               years prior to the current date. This measure only
    cows that will be culled due to reproductive            reflects reproductive successes, however, and
    problems, but are still in the herd because of          does not take into account reproductive failures.
    high milk production.                                   Cows that are culled for reproductive problems
                                                            can be considered failures.
Calculate the average Days Open for the herd by
adding together the Days Open for each cow and              Actual Calving Interval is figured by calculating
divide the total by the number of cows in the herd.         the number of months between the most recent
                                                            calving and the previous calving for each cow in
A guideline for interpreting Days Open is                   second or later lactation. A Calving Interval is not
summarized in Table 1. A herd average of 85 days            calculated for first-calf heifers. The Calving
or less for Days Open indicates cows are being              Interval for each cow is then added together and
bred too early in lactation. Recent research has            the total is divided by the number of cows in
shown that the level of milk production was                 second or later lactation.
decreased significantly in the lactation that
followed early postpartum (after calving)                   Actual Calving Interval should be interpreted
breedings.                                                  according to the guidelines in Table 2. Producers
                                                            with a herd having an Actual Calving Interval of
Most producers are interested in overall efficiency         under 11.7 months and a Days Open of under 85
of milk production (commercial herds) and not in            Days should breed cows later in lactation for their
obtaining large milk production records on specific         first service to increase Days Open to 85-115 Days.
cows. Some breeders of registered cattle, however,          Recent research indicates that milk production of
are interested in obtaining maximal milk                    herds with an Actual Calving Interval of under 11.7
production records on individual cows to increase           months is significantly less than milk production
the sale value of these animals or their offspring.         of herds with a Calving Interval of 11.8-13.0
                                                            months.
Days Open values between 116 and 145 Days are
interpreted differently for these two types of herds.       Similar to Days Open, Calving Intervals for
A value for Days Open of 116 to 130 Days indicates          commercial herds are interpreted differently than
a slight problem for commercial herds, but may be           Calving Intervals for herds with registered cattle.
adequate for breeders of registered cattle. A value         An Actual Calving Interval of 13-13.5 months
for Days Open of 131 to 145 Days indicates a                should be considered a slight to moderate problem
moderate problem for commercial herds and a                 for commercial but may be adequate for registered
slight problem for registered herds. A value for            herds. An Actual Calving Interval of 13.6 to 14.0
Days Open of over 145 Days indicates a severe               months is considered a moderate problem for
problem for all herds.                                      commercial herds and a slight to moderate
                                                            problem for registered herds. An Actual Calving
                                                            Interval of over 14.0 months is indicative of a
                                                            severe problem in all herds.


                                                        2
Table 2. A List of Actual Calving Intervals                  Table 3. The Relationship of Average Days
and a Brief Interpretation for Each                          to First Service (DFS) and DFS Goal to
Interval.                                                    Reproductive Efficiency.

Calving Interval                                             Average DFS Minus
(Months)               Interpretation                        DFS Goal                     Interpretation
Under 11.7             Too LOW                               Under 18 Days                No Problem
11.8 -13.0             Optimum for Most Herds                19 to 26 Days                Moderate Problem1
13.0 -13.5             Slight Problem for Most               Over 26 Days                 Severe Problem1
                       Herds
13.6 -14.0             Moderate to Slight Problem            1
                                                               The cause of the problem may be due to cows being anestrus
Over 14.0              Severe Problem                        and/or to estrous periods being missed.


Days in Milk at                                              Services Per
First Service (DFS)                                          Conception (S/Conc)
The average DFS for a herd is influenced by a                Average S/Conc for a herd is a measure of fertility
management decision of when first breeding will              in cows which were reproductive successes and
occur postpartum. This earliest number of days               have become pregnant. Breedings for cull cows
decided upon by management (DFS Goal) varies                 and repeat breeder cows (Fact Sheet IRM-23) not
greatly between herds. Some cows can be safely               diagnosed pregnant are not included in this index.
bred as early as 40 days postpartum; however,                Average S/Conc can be figured as follows:
highest fertility levels usually are not reached until
60 days. Many producers breed cows at their first            1. Count the total number of breedings (this
estrus after 45 days postpartum. These producers                lactation) for each pregnant cow,
avoid many fertility problems by having their                2. Add the numbers together,
veterinarian palpate all cows prior to 45 days
                                                             3. Calculate the average S/Conc by dividing the
postpartum to diagnose reproductive problems                     total number of breedings by the number of
such as severe uterine infections (metritis; Fact                 pregnant cows.
Sheet IRM-22). Breeding of cows with metritis can
then be delayed until the uterine infection is               Average S/Cone should be interpreted according to
eliminated and the uterus is healthy. The average            the guidelines in Table 4. Poor levels of fertility
DFS for a herd is influenced by when the ovaries             may be due to inaccurate estrous detection (Fact
of a cow begin to function again postpartum and              Sheet IRM-6). Accurate estrous detection may be
the number of unobserved estrous periods.                    confirmed by milk progesterone analysis (Fact
                                                             Sheet IRM-9). Improper techniques for artificial
The average DFS for a herd is figured as follows:            insemination (Fact Sheet IRM-12) may also lead to
1. Calculate the number of days from calving                 S/Conc greater than 2.0. An examination of
   until first service for all cows inseminated.             techniques used in artificial insemination or a
2. Calculate the average DFS for the herd by                 refresher course could be beneficial.
    adding together the DFS for each cow and
    dividing the total by the number of cows
    inseminated.
After determining the earliest number of days
postpartum that a cow can be bred in a herd (DFS
Goal), the average DFS for a herd should be
interpreted according to the guidelines in Table 3.
Problems in herds with average DFS minus DFS
Goal over 18 days can be due to cows being
anestrus and/or unobserved estrous periods. A
method for determining the cause of the problem
is described in Fact Sheet IRM-7.


                                                         3
Table 4. The Relationship Between                           Table 5. The Relationship of Actual
Services Per Conception (S/Conc) and                        Calving Interval (Cl) and Projected
Level of Fertility.                                         Minimum Calving Interval (PMCI) to Level
                                                            of Reproductive Efficiency.
S/Conc                Fertility Level
Under 1.75            Good level                            Comparison of Cl          Level of
1.76-2.00             Adequate Level                        and PMCI                  Reproductive Efficiency
2.01-2.30             Moderate Problem
                                                            Cl Greater than PMCI      Improving
Over 2.30             Severe Problem
                                                            Cl Similar to PMCI        Staying Same
                                                            Cl Less the PMCI          Growing Worse


Interpreting Indexes of
Reproductive Efficiency
Compare Actual Calving Interval to                          Calculate Estrous
Projected Minimum                                           Detection Efficiency
Calving Interval (Days Open)                                Estrous detection efficiency can be expressed as
This comparison can indicate whether overall                the percentage of Heats Detected (total estrous
reproductive efficiency during the last nine months         periods when a cow was detected in estrus).
is better, the same, or worse than the herd                 The percentage of Heats Detected can be estimated
reproductive efficiency during the previous year.           by first calculating an average breeding interval for
To compare Days Open to Actual Calving Interval             the herd and then comparing the breeding interval
(Cl), a Projected Minimum Calving Interval (PMCI)           to Table 6. Breeding interval is the average number
is calculated. Average Days Open is added to the            of days between first breeding and the
gestation length, in days, for the most common              insemination resulting in pregnancy. Average
breed in a herd (Ayrshire, 278 days; Brown Swiss,           breeding interval, can be calculated by the
290 days; Guernsey, 284 days; Holstein, 279 days;           following formula:
and Jersey, 279 days). This total is then divided by        Breeding Interval = Average Days Open-DFS
30.25 days/month. For example, PMCI for a
                                                                                (S/Cone-l)
Holstein herd averaging 123 Days Open would be
calculated:                                                 An example for a herd with an average Days Open
                                                            of 140, an average DFS of 2.6 would be:
123 days + 279 days= 13.3 months for PMCI.
30.25 days/month                                            Breeding Interval = 140-75=41 days
                                                                                (2.6-1)
Comparisons of Cl and PMCI should be interpreted
according to the guidelines in Table 5. Herd                Comparing the breeding interval to Table 6, 41
reproductive management does not need to be                 days corresponds to 50% of Heats Detected.
changed with improving reproductive efficiency,             A guideline for interpreting percentage of Heats
unless the number of missed estrous periods or              Detected is summarized in Table 7. Producers with
repeat breeders still requires improvement. For             severe problems should improve their estrous
herds with an unchanging level of reproductive              detection program (Fact Sheet IRM-6). Moderate
efficiency, the effectiveness of reproductive               problems may be caused by not observing estrus
management procedures should be evaluated if                in certain cows. Examining records of individual
the value for Days Open indicates a problem                 cows may be useful. Anestrous cows or cows with
exists. If overall reproductive efficiency has gotten       feet and leg problems may be difficult to observe
worse during the last nine months, the                      in estrus.
effectiveness of management procedures
concerning reproduction should be evaluated.


                                                        4
Table 6. An Estimation of Percentage of                                  Some herds may have excellent estrous detection
                                                                         efficiency yet have poor fertility (S/Conc over 2.0),
Heats Detected Based on Breeding Interval.                               suggesting a problem in estrous detection
                                                                         accuracy. (Cows are thought to be in estrus when
                                                                         they are not.) Progesterone analysis of milk
Breeding                                                                 samples collected on the day of breeding can be
Interval (Days)                 % Heats Detected                         used to determine accuracy of estrous detection
                                                                         (Fact Sheet IRM-9).
23                               90
26                               80                                      Summary
30                               70
35                               60                                      Inefficient reproduction is costly and can be
41                               50                                      caused by different problems. Records,
50                               40                                      summarized into indexes of reproductive
60                               30                                      efficiency, are valuable tools because they can be
                                                                         used to identify causes of breeding problems.
                                                                         Indexes can also be used to spot developing
Source: Grusenmeyer, D., et al., Evaluating Dairy Herd Repro-            problems before they become more serious.
ductive Status Using DHI Records. Washington
State University, Western Regional Extension Publication,
                                                                         Profits can be increased significantly by most
WREP 0067, 1983.                                                         producers if breeding problems are solved.


Table 7. The Relationship of Percentage
Heats Detected to Estrous Detection
Efficiency.
                                                                          Trade or brand names are mentioned only for information.
Percent Heats                Level of Estrous                             The Cooperative Extension Service intends no endorsement nor
                                                                          implies discrimination to the exclusion of other products which
Detected                     Detection Efficiency                         also may be suitable.

Under 50%                    Severe Problem
50-65%                       Moderate Problem
66-80%                       Adequate Efficiency
Over 80%                     Excellent Efficiency’

1
  Herds that also have a poor level of fertility (S/Conc over 2.0)
should use milk progesterone analysis to determine the
accuracy of heats detected.


Programs and activities offered by the West Virginia University Extension Service are available to all persons without regard to race, color,
                      sex, disability, religion, age, veteran status, sexual orientation or national origin.
Issued in furtherance of Cooperative Extension work, Acts of May 8 and June 30, 1914, in cooperation with the U.S. Department of
                         Agriculture. Director, Cooperative Extension Service, West Virginia University.


                                                                     5

Interpreting Reproductive Efficiency Indexes

  • 1.
    Interpreting Reproductive IRM-5 Efficiency Indexes Dairy Integrated Reproductive Management Dr. M.A. Varner, Dr. J.L. Majeskie, and S.C. Garlichs University of Maryland Introduction The breeding records necessary for calculation of the indexes discussed in this fact sheet are: Reproductive efficiency is the ability of a dairy producer to get cows bred back rapidly after 1. Date (month, day, and year) of the most recent calving with a minimum number of breedings per calving cow. Inefficient reproduction decreases profit by 2. Date of the previous calving for second and reducing both the efficiency of milk production later lactation cows and the number of available replacement heifers. 3. Reproductive status (pregnant, open, and bred Also, there may be increased breeding costs and but too early to detect pregnancy) veterinary fees. Breeding records, summarized as a reproductive efficiency index, provide the best 4. Number of breedings for all cows, and indication of breeding problems. More importantly, 5. Date(s) of first breeding and most recent indexes can give clues as to what the cause of breeding if a cow has been bred more than problems might be. once. Reproductive efficiency indexes are also useful to dairy producers who currently do not have Indexes of problems getting cows pregnant. Trends in these Reproductive Efficiency indexes can be used to detect problems as they develop. Steps to correct the problem can be taken Days Open before the problem becomes more serious. Days Open measures overall reproductive The index values for a herd should not be performance for the previous 12 months. Problems compared only to guidelines contained in this fact with fertility (Fact Sheet IRM-10) and/or estrous sheet, but also to index values for the state and/or detection (Fact Sheet IRM-6) increase Days Open. county in which the herd is located. The guidelines Projected Minimum Calving Interval is calculated are goals for optimal efficiency. Regional by adding Days Open to the gestation length for a differences, such as weather, may make goals normal cow. It is interpreted in a manner similar to more difficult to reach for some producers. Days Open. Consequently, comparing state and county index A small portion of cows with high Days Open values to herd values can provide an indication of usually inflates the herd’s average Days Open to a how good a job a particular producer is doing small degree. If Days Open is inflated significantly when compared to neighbors. State and/or county by a few problem breeding cows, these cows values can usually be obtained from Cooperative should be culled. The culling policy for Extension Service state specialists or county reproductive problems in the herd should be agents. examined. Fact Sheet IRM-17 can provide a basis for understanding the costs of keeping problem breeders in the herd too long.
  • 2.
    Current Days Openwhen added to a gestation Table 1. A List of Various Levels for Days length for a normal cow will not always be equal Open and a Short Interpretation for to the Calving Interval one to two years from now. Some cows with reproductive problems are culled Each Level and never contribute to the Calving Interval. This Level of Days Open1 Interpretation difference is usually small, unless a significant portion of the herd is culled for reproductive Under 85 Days Too LO W problems. 85 to 115 Days Optimum For Most Herds If most of the cull cows are removed from the herd 116 to 130 Days Slight Problem for Most for reproductive problems, then current Days Open Herds plus gestation length may be larger than future 131 to 145 Days Moderate to Slight Problem Calving Interval. Of course, a serious problem exists in any herd where most of the cull cows are Over 145 Days Severe Problem removed for reproductive problems. The causes of these problems should be determined by 1 Herds with a seasonal calving pattern should use the highest examining the indexes of reproductive efficiency value for Days Open during the last 12 months. as described in this IRM fact sheet. To calculate Days Open for a herd, list for each cow the number of days from calving to: 1. Conception for pregnant cow Actual Calving Interval 2. Last breeding for cows which are bred but not Actual Calving Interval is an indication of yet confirmed pregnant, or reproductive performance from 9 months to 2 3. Current date for open cows. Do not include years prior to the current date. This measure only cows that will be culled due to reproductive reflects reproductive successes, however, and problems, but are still in the herd because of does not take into account reproductive failures. high milk production. Cows that are culled for reproductive problems can be considered failures. Calculate the average Days Open for the herd by adding together the Days Open for each cow and Actual Calving Interval is figured by calculating divide the total by the number of cows in the herd. the number of months between the most recent calving and the previous calving for each cow in A guideline for interpreting Days Open is second or later lactation. A Calving Interval is not summarized in Table 1. A herd average of 85 days calculated for first-calf heifers. The Calving or less for Days Open indicates cows are being Interval for each cow is then added together and bred too early in lactation. Recent research has the total is divided by the number of cows in shown that the level of milk production was second or later lactation. decreased significantly in the lactation that followed early postpartum (after calving) Actual Calving Interval should be interpreted breedings. according to the guidelines in Table 2. Producers with a herd having an Actual Calving Interval of Most producers are interested in overall efficiency under 11.7 months and a Days Open of under 85 of milk production (commercial herds) and not in Days should breed cows later in lactation for their obtaining large milk production records on specific first service to increase Days Open to 85-115 Days. cows. Some breeders of registered cattle, however, Recent research indicates that milk production of are interested in obtaining maximal milk herds with an Actual Calving Interval of under 11.7 production records on individual cows to increase months is significantly less than milk production the sale value of these animals or their offspring. of herds with a Calving Interval of 11.8-13.0 months. Days Open values between 116 and 145 Days are interpreted differently for these two types of herds. Similar to Days Open, Calving Intervals for A value for Days Open of 116 to 130 Days indicates commercial herds are interpreted differently than a slight problem for commercial herds, but may be Calving Intervals for herds with registered cattle. adequate for breeders of registered cattle. A value An Actual Calving Interval of 13-13.5 months for Days Open of 131 to 145 Days indicates a should be considered a slight to moderate problem moderate problem for commercial herds and a for commercial but may be adequate for registered slight problem for registered herds. A value for herds. An Actual Calving Interval of 13.6 to 14.0 Days Open of over 145 Days indicates a severe months is considered a moderate problem for problem for all herds. commercial herds and a slight to moderate problem for registered herds. An Actual Calving Interval of over 14.0 months is indicative of a severe problem in all herds. 2
  • 3.
    Table 2. AList of Actual Calving Intervals Table 3. The Relationship of Average Days and a Brief Interpretation for Each to First Service (DFS) and DFS Goal to Interval. Reproductive Efficiency. Calving Interval Average DFS Minus (Months) Interpretation DFS Goal Interpretation Under 11.7 Too LOW Under 18 Days No Problem 11.8 -13.0 Optimum for Most Herds 19 to 26 Days Moderate Problem1 13.0 -13.5 Slight Problem for Most Over 26 Days Severe Problem1 Herds 13.6 -14.0 Moderate to Slight Problem 1 The cause of the problem may be due to cows being anestrus Over 14.0 Severe Problem and/or to estrous periods being missed. Days in Milk at Services Per First Service (DFS) Conception (S/Conc) The average DFS for a herd is influenced by a Average S/Conc for a herd is a measure of fertility management decision of when first breeding will in cows which were reproductive successes and occur postpartum. This earliest number of days have become pregnant. Breedings for cull cows decided upon by management (DFS Goal) varies and repeat breeder cows (Fact Sheet IRM-23) not greatly between herds. Some cows can be safely diagnosed pregnant are not included in this index. bred as early as 40 days postpartum; however, Average S/Conc can be figured as follows: highest fertility levels usually are not reached until 60 days. Many producers breed cows at their first 1. Count the total number of breedings (this estrus after 45 days postpartum. These producers lactation) for each pregnant cow, avoid many fertility problems by having their 2. Add the numbers together, veterinarian palpate all cows prior to 45 days 3. Calculate the average S/Conc by dividing the postpartum to diagnose reproductive problems total number of breedings by the number of such as severe uterine infections (metritis; Fact pregnant cows. Sheet IRM-22). Breeding of cows with metritis can then be delayed until the uterine infection is Average S/Cone should be interpreted according to eliminated and the uterus is healthy. The average the guidelines in Table 4. Poor levels of fertility DFS for a herd is influenced by when the ovaries may be due to inaccurate estrous detection (Fact of a cow begin to function again postpartum and Sheet IRM-6). Accurate estrous detection may be the number of unobserved estrous periods. confirmed by milk progesterone analysis (Fact Sheet IRM-9). Improper techniques for artificial The average DFS for a herd is figured as follows: insemination (Fact Sheet IRM-12) may also lead to 1. Calculate the number of days from calving S/Conc greater than 2.0. An examination of until first service for all cows inseminated. techniques used in artificial insemination or a 2. Calculate the average DFS for the herd by refresher course could be beneficial. adding together the DFS for each cow and dividing the total by the number of cows inseminated. After determining the earliest number of days postpartum that a cow can be bred in a herd (DFS Goal), the average DFS for a herd should be interpreted according to the guidelines in Table 3. Problems in herds with average DFS minus DFS Goal over 18 days can be due to cows being anestrus and/or unobserved estrous periods. A method for determining the cause of the problem is described in Fact Sheet IRM-7. 3
  • 4.
    Table 4. TheRelationship Between Table 5. The Relationship of Actual Services Per Conception (S/Conc) and Calving Interval (Cl) and Projected Level of Fertility. Minimum Calving Interval (PMCI) to Level of Reproductive Efficiency. S/Conc Fertility Level Under 1.75 Good level Comparison of Cl Level of 1.76-2.00 Adequate Level and PMCI Reproductive Efficiency 2.01-2.30 Moderate Problem Cl Greater than PMCI Improving Over 2.30 Severe Problem Cl Similar to PMCI Staying Same Cl Less the PMCI Growing Worse Interpreting Indexes of Reproductive Efficiency Compare Actual Calving Interval to Calculate Estrous Projected Minimum Detection Efficiency Calving Interval (Days Open) Estrous detection efficiency can be expressed as This comparison can indicate whether overall the percentage of Heats Detected (total estrous reproductive efficiency during the last nine months periods when a cow was detected in estrus). is better, the same, or worse than the herd The percentage of Heats Detected can be estimated reproductive efficiency during the previous year. by first calculating an average breeding interval for To compare Days Open to Actual Calving Interval the herd and then comparing the breeding interval (Cl), a Projected Minimum Calving Interval (PMCI) to Table 6. Breeding interval is the average number is calculated. Average Days Open is added to the of days between first breeding and the gestation length, in days, for the most common insemination resulting in pregnancy. Average breed in a herd (Ayrshire, 278 days; Brown Swiss, breeding interval, can be calculated by the 290 days; Guernsey, 284 days; Holstein, 279 days; following formula: and Jersey, 279 days). This total is then divided by Breeding Interval = Average Days Open-DFS 30.25 days/month. For example, PMCI for a (S/Cone-l) Holstein herd averaging 123 Days Open would be calculated: An example for a herd with an average Days Open of 140, an average DFS of 2.6 would be: 123 days + 279 days= 13.3 months for PMCI. 30.25 days/month Breeding Interval = 140-75=41 days (2.6-1) Comparisons of Cl and PMCI should be interpreted according to the guidelines in Table 5. Herd Comparing the breeding interval to Table 6, 41 reproductive management does not need to be days corresponds to 50% of Heats Detected. changed with improving reproductive efficiency, A guideline for interpreting percentage of Heats unless the number of missed estrous periods or Detected is summarized in Table 7. Producers with repeat breeders still requires improvement. For severe problems should improve their estrous herds with an unchanging level of reproductive detection program (Fact Sheet IRM-6). Moderate efficiency, the effectiveness of reproductive problems may be caused by not observing estrus management procedures should be evaluated if in certain cows. Examining records of individual the value for Days Open indicates a problem cows may be useful. Anestrous cows or cows with exists. If overall reproductive efficiency has gotten feet and leg problems may be difficult to observe worse during the last nine months, the in estrus. effectiveness of management procedures concerning reproduction should be evaluated. 4
  • 5.
    Table 6. AnEstimation of Percentage of Some herds may have excellent estrous detection efficiency yet have poor fertility (S/Conc over 2.0), Heats Detected Based on Breeding Interval. suggesting a problem in estrous detection accuracy. (Cows are thought to be in estrus when they are not.) Progesterone analysis of milk Breeding samples collected on the day of breeding can be Interval (Days) % Heats Detected used to determine accuracy of estrous detection (Fact Sheet IRM-9). 23 90 26 80 Summary 30 70 35 60 Inefficient reproduction is costly and can be 41 50 caused by different problems. Records, 50 40 summarized into indexes of reproductive 60 30 efficiency, are valuable tools because they can be used to identify causes of breeding problems. Indexes can also be used to spot developing Source: Grusenmeyer, D., et al., Evaluating Dairy Herd Repro- problems before they become more serious. ductive Status Using DHI Records. Washington State University, Western Regional Extension Publication, Profits can be increased significantly by most WREP 0067, 1983. producers if breeding problems are solved. Table 7. The Relationship of Percentage Heats Detected to Estrous Detection Efficiency. Trade or brand names are mentioned only for information. Percent Heats Level of Estrous The Cooperative Extension Service intends no endorsement nor implies discrimination to the exclusion of other products which Detected Detection Efficiency also may be suitable. Under 50% Severe Problem 50-65% Moderate Problem 66-80% Adequate Efficiency Over 80% Excellent Efficiency’ 1 Herds that also have a poor level of fertility (S/Conc over 2.0) should use milk progesterone analysis to determine the accuracy of heats detected. Programs and activities offered by the West Virginia University Extension Service are available to all persons without regard to race, color, sex, disability, religion, age, veteran status, sexual orientation or national origin. Issued in furtherance of Cooperative Extension work, Acts of May 8 and June 30, 1914, in cooperation with the U.S. Department of Agriculture. Director, Cooperative Extension Service, West Virginia University. 5