Downloaded 122 times
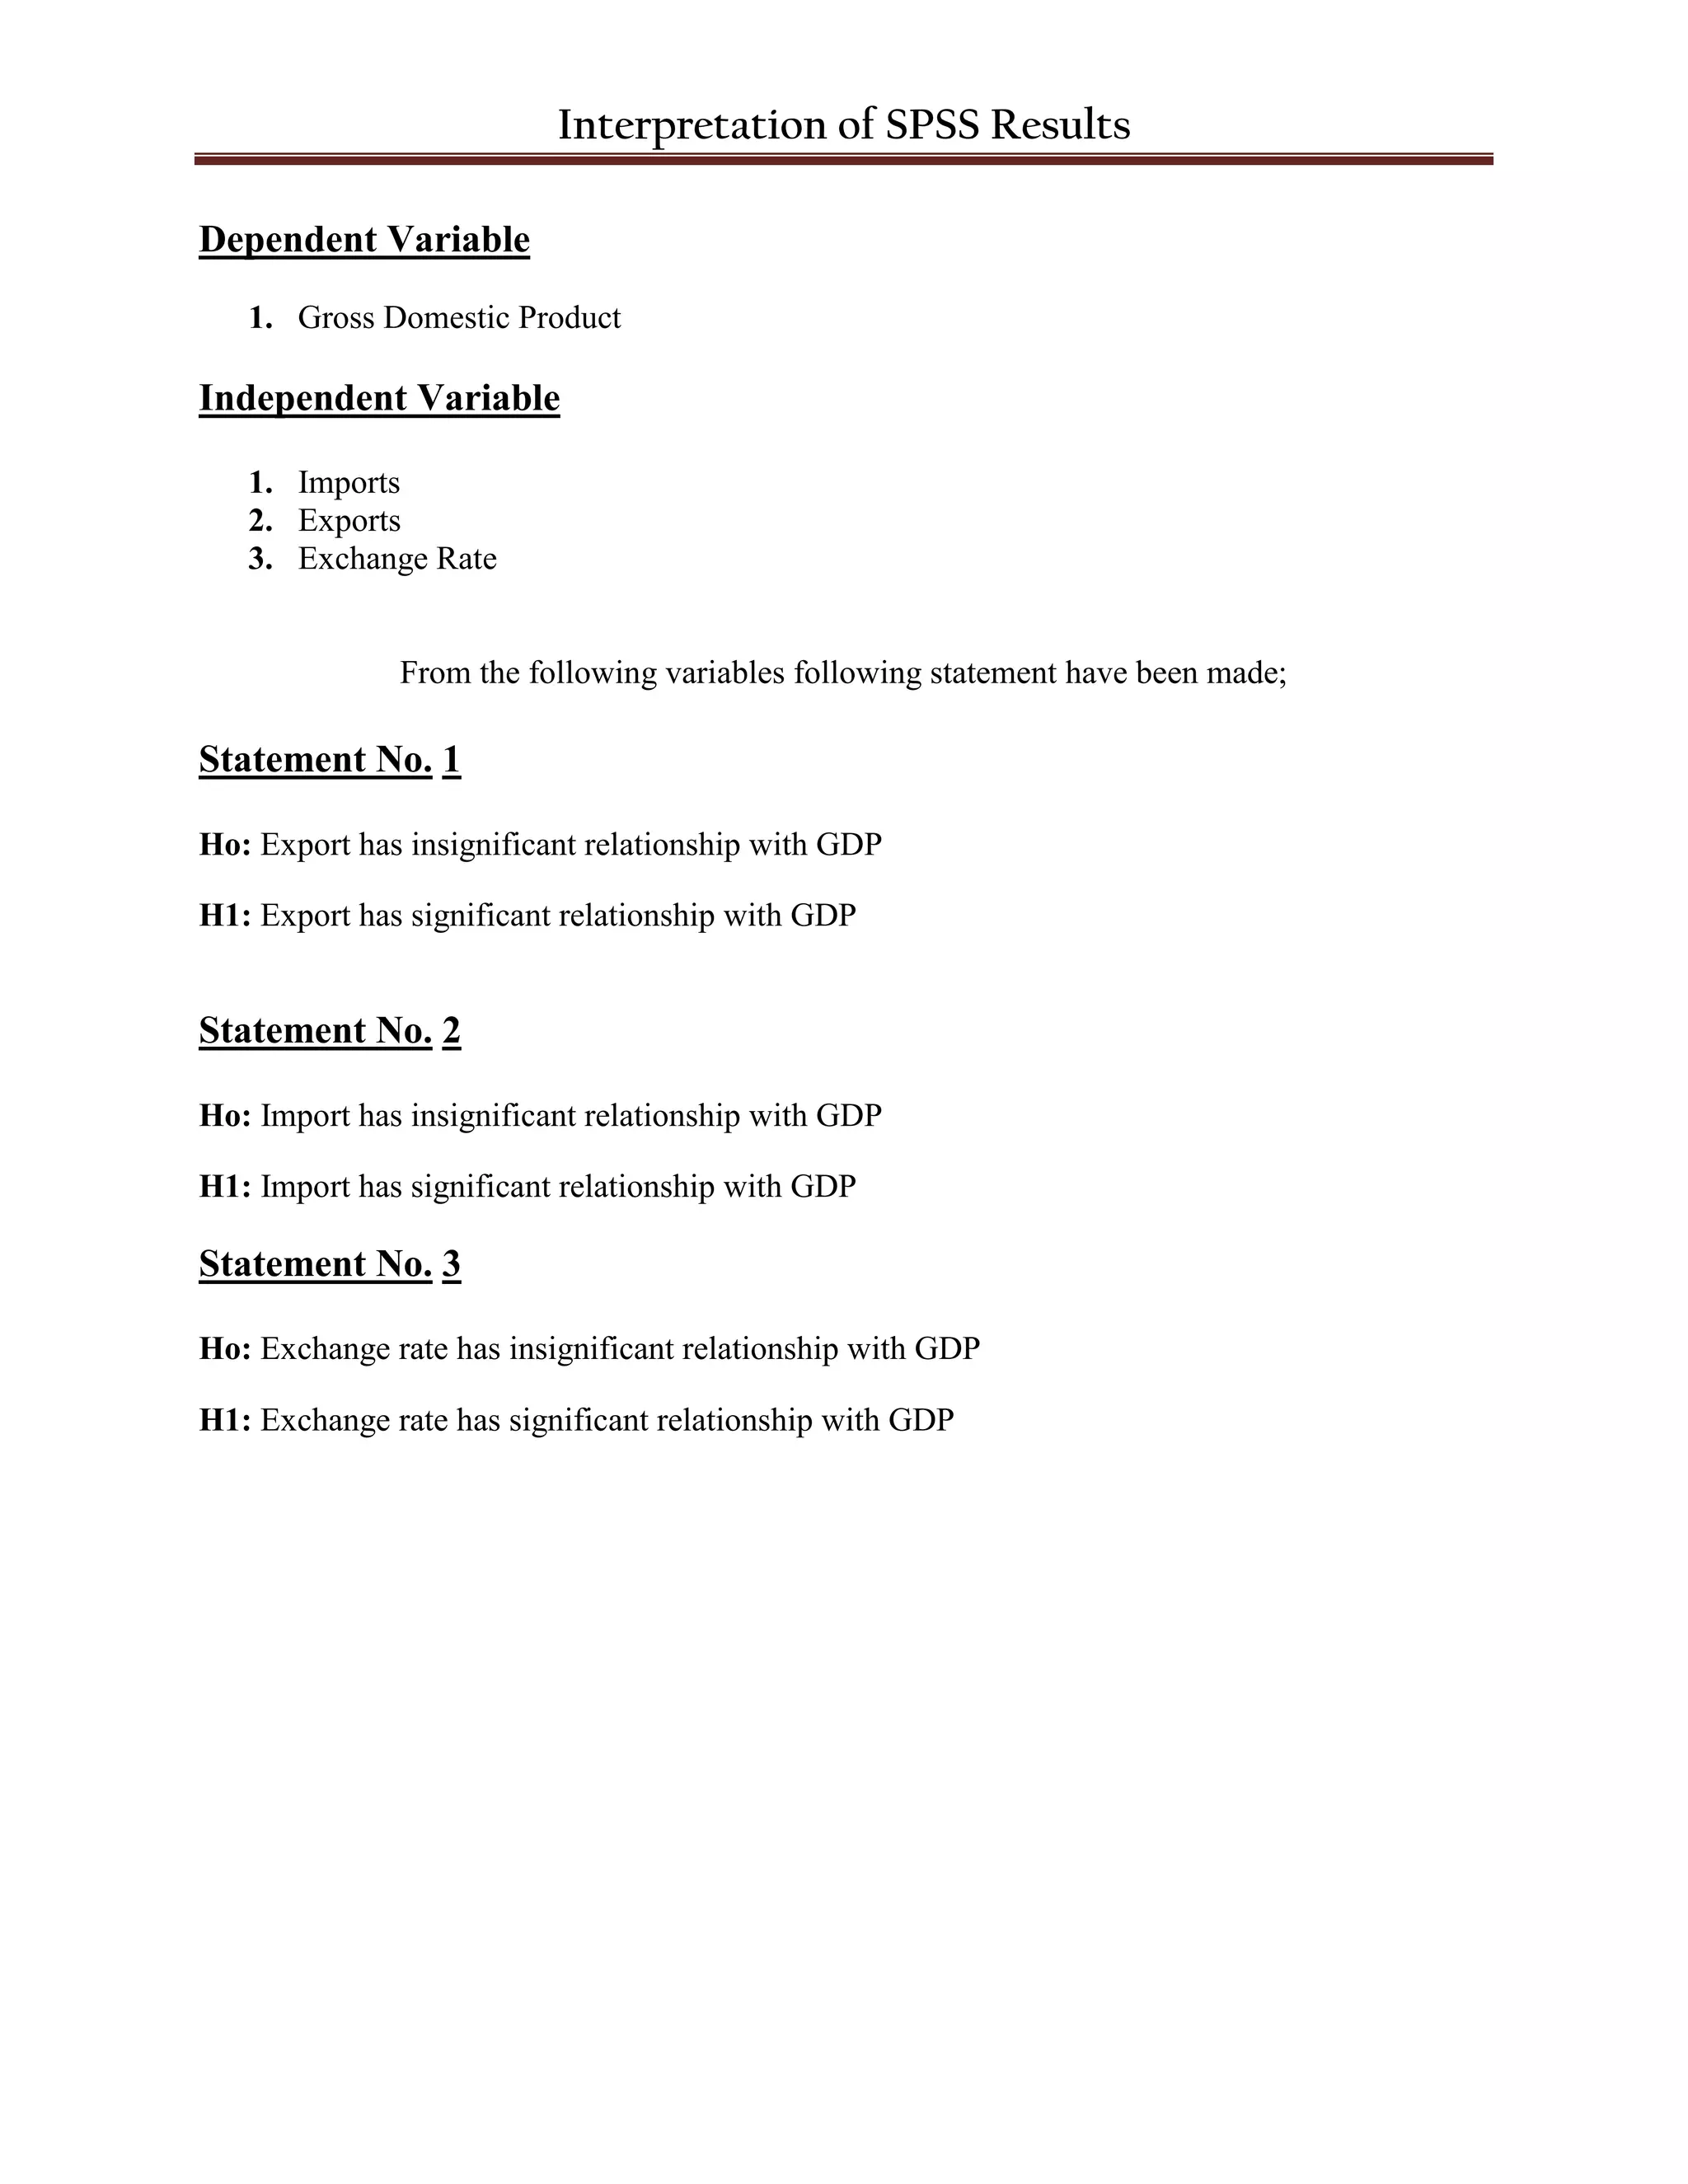
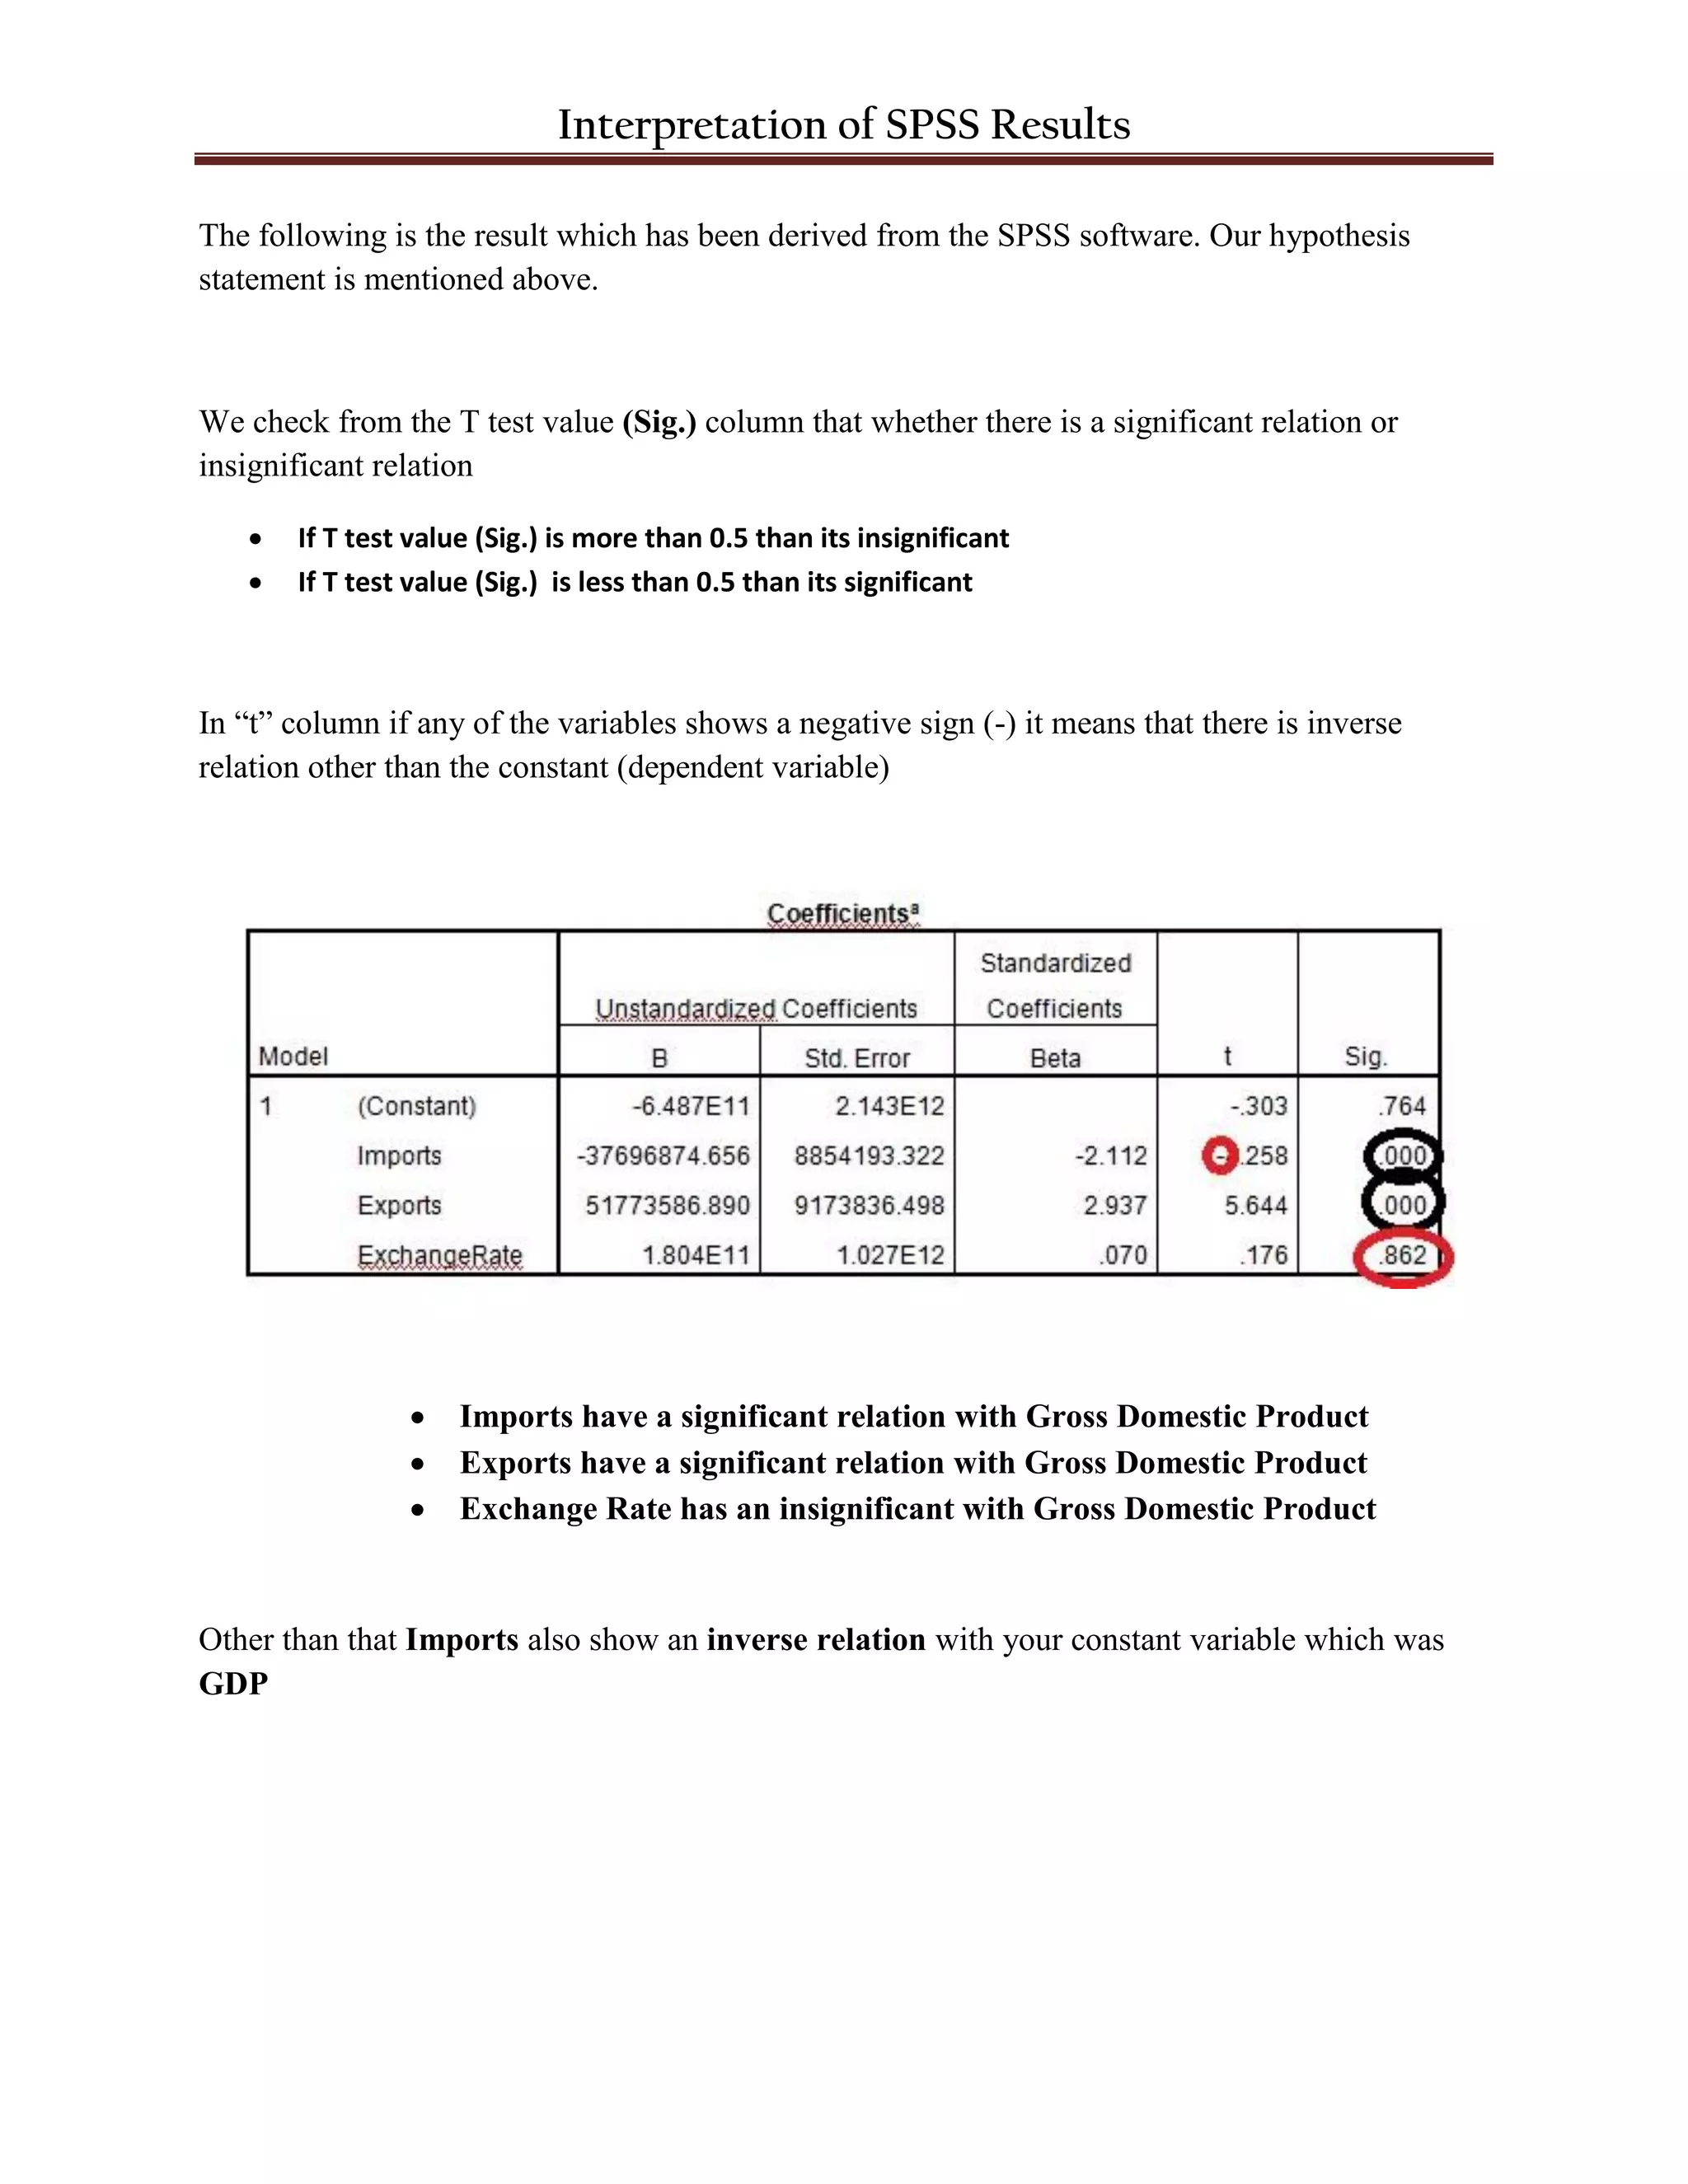
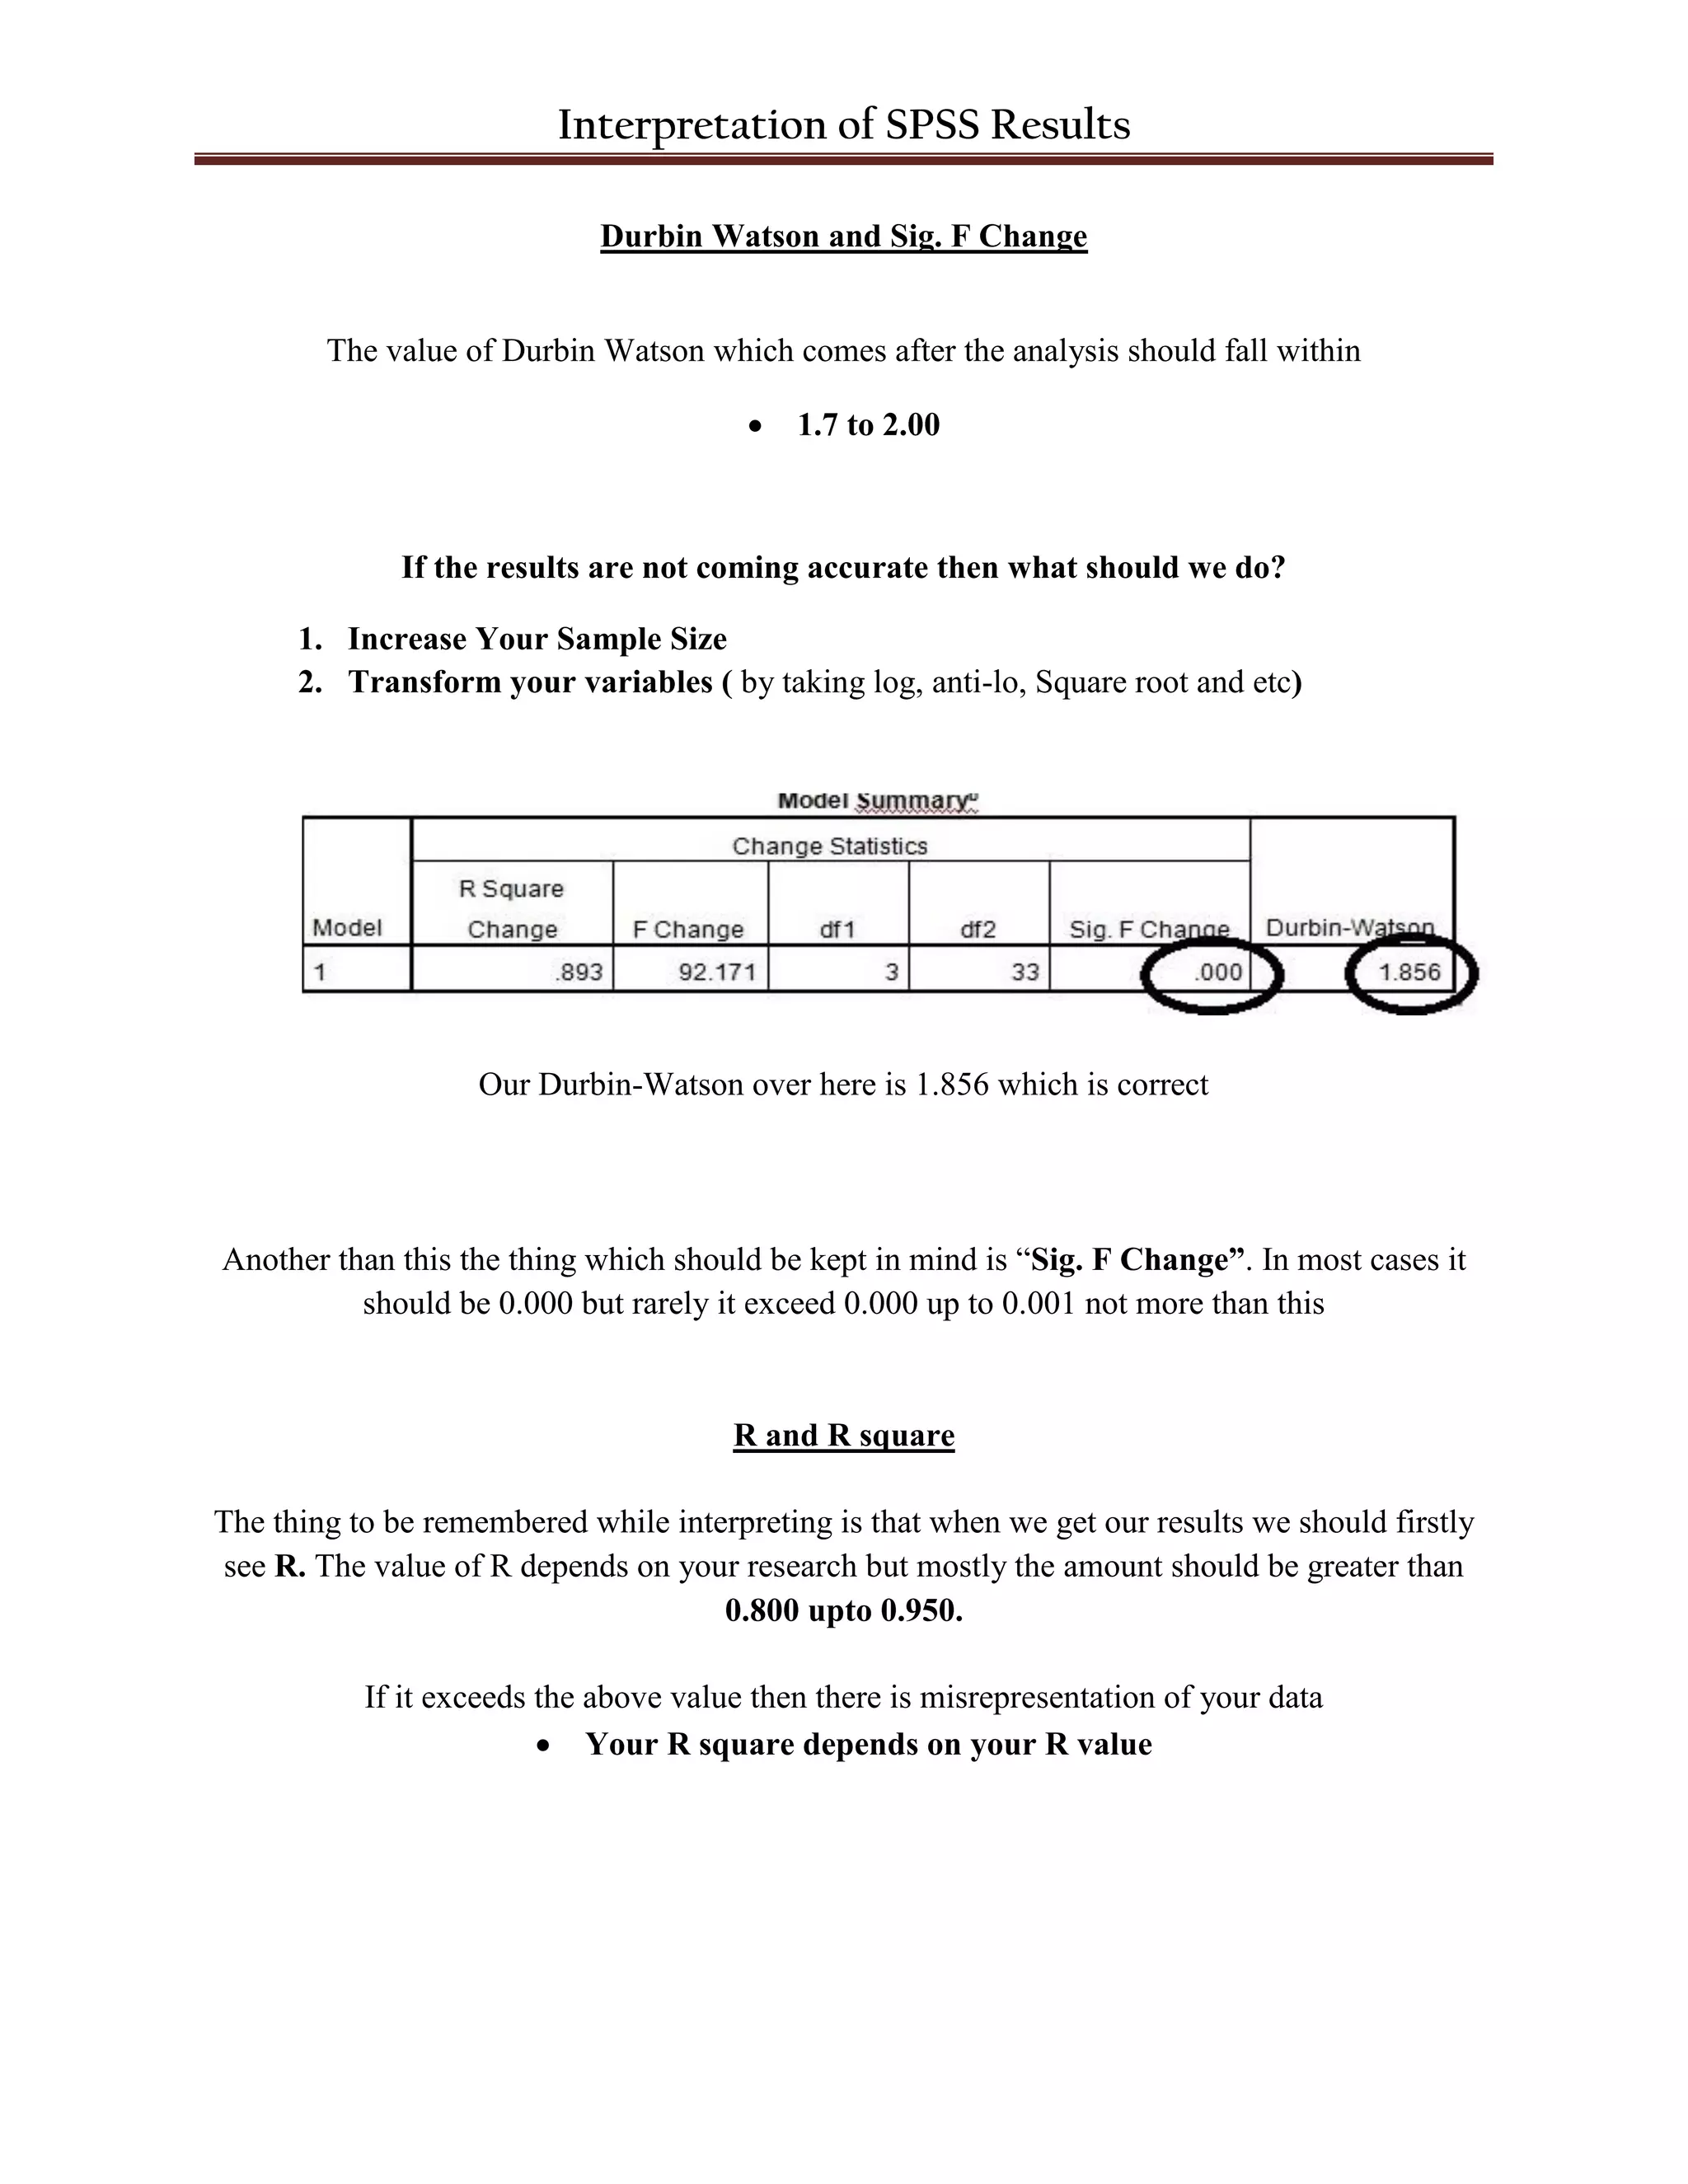
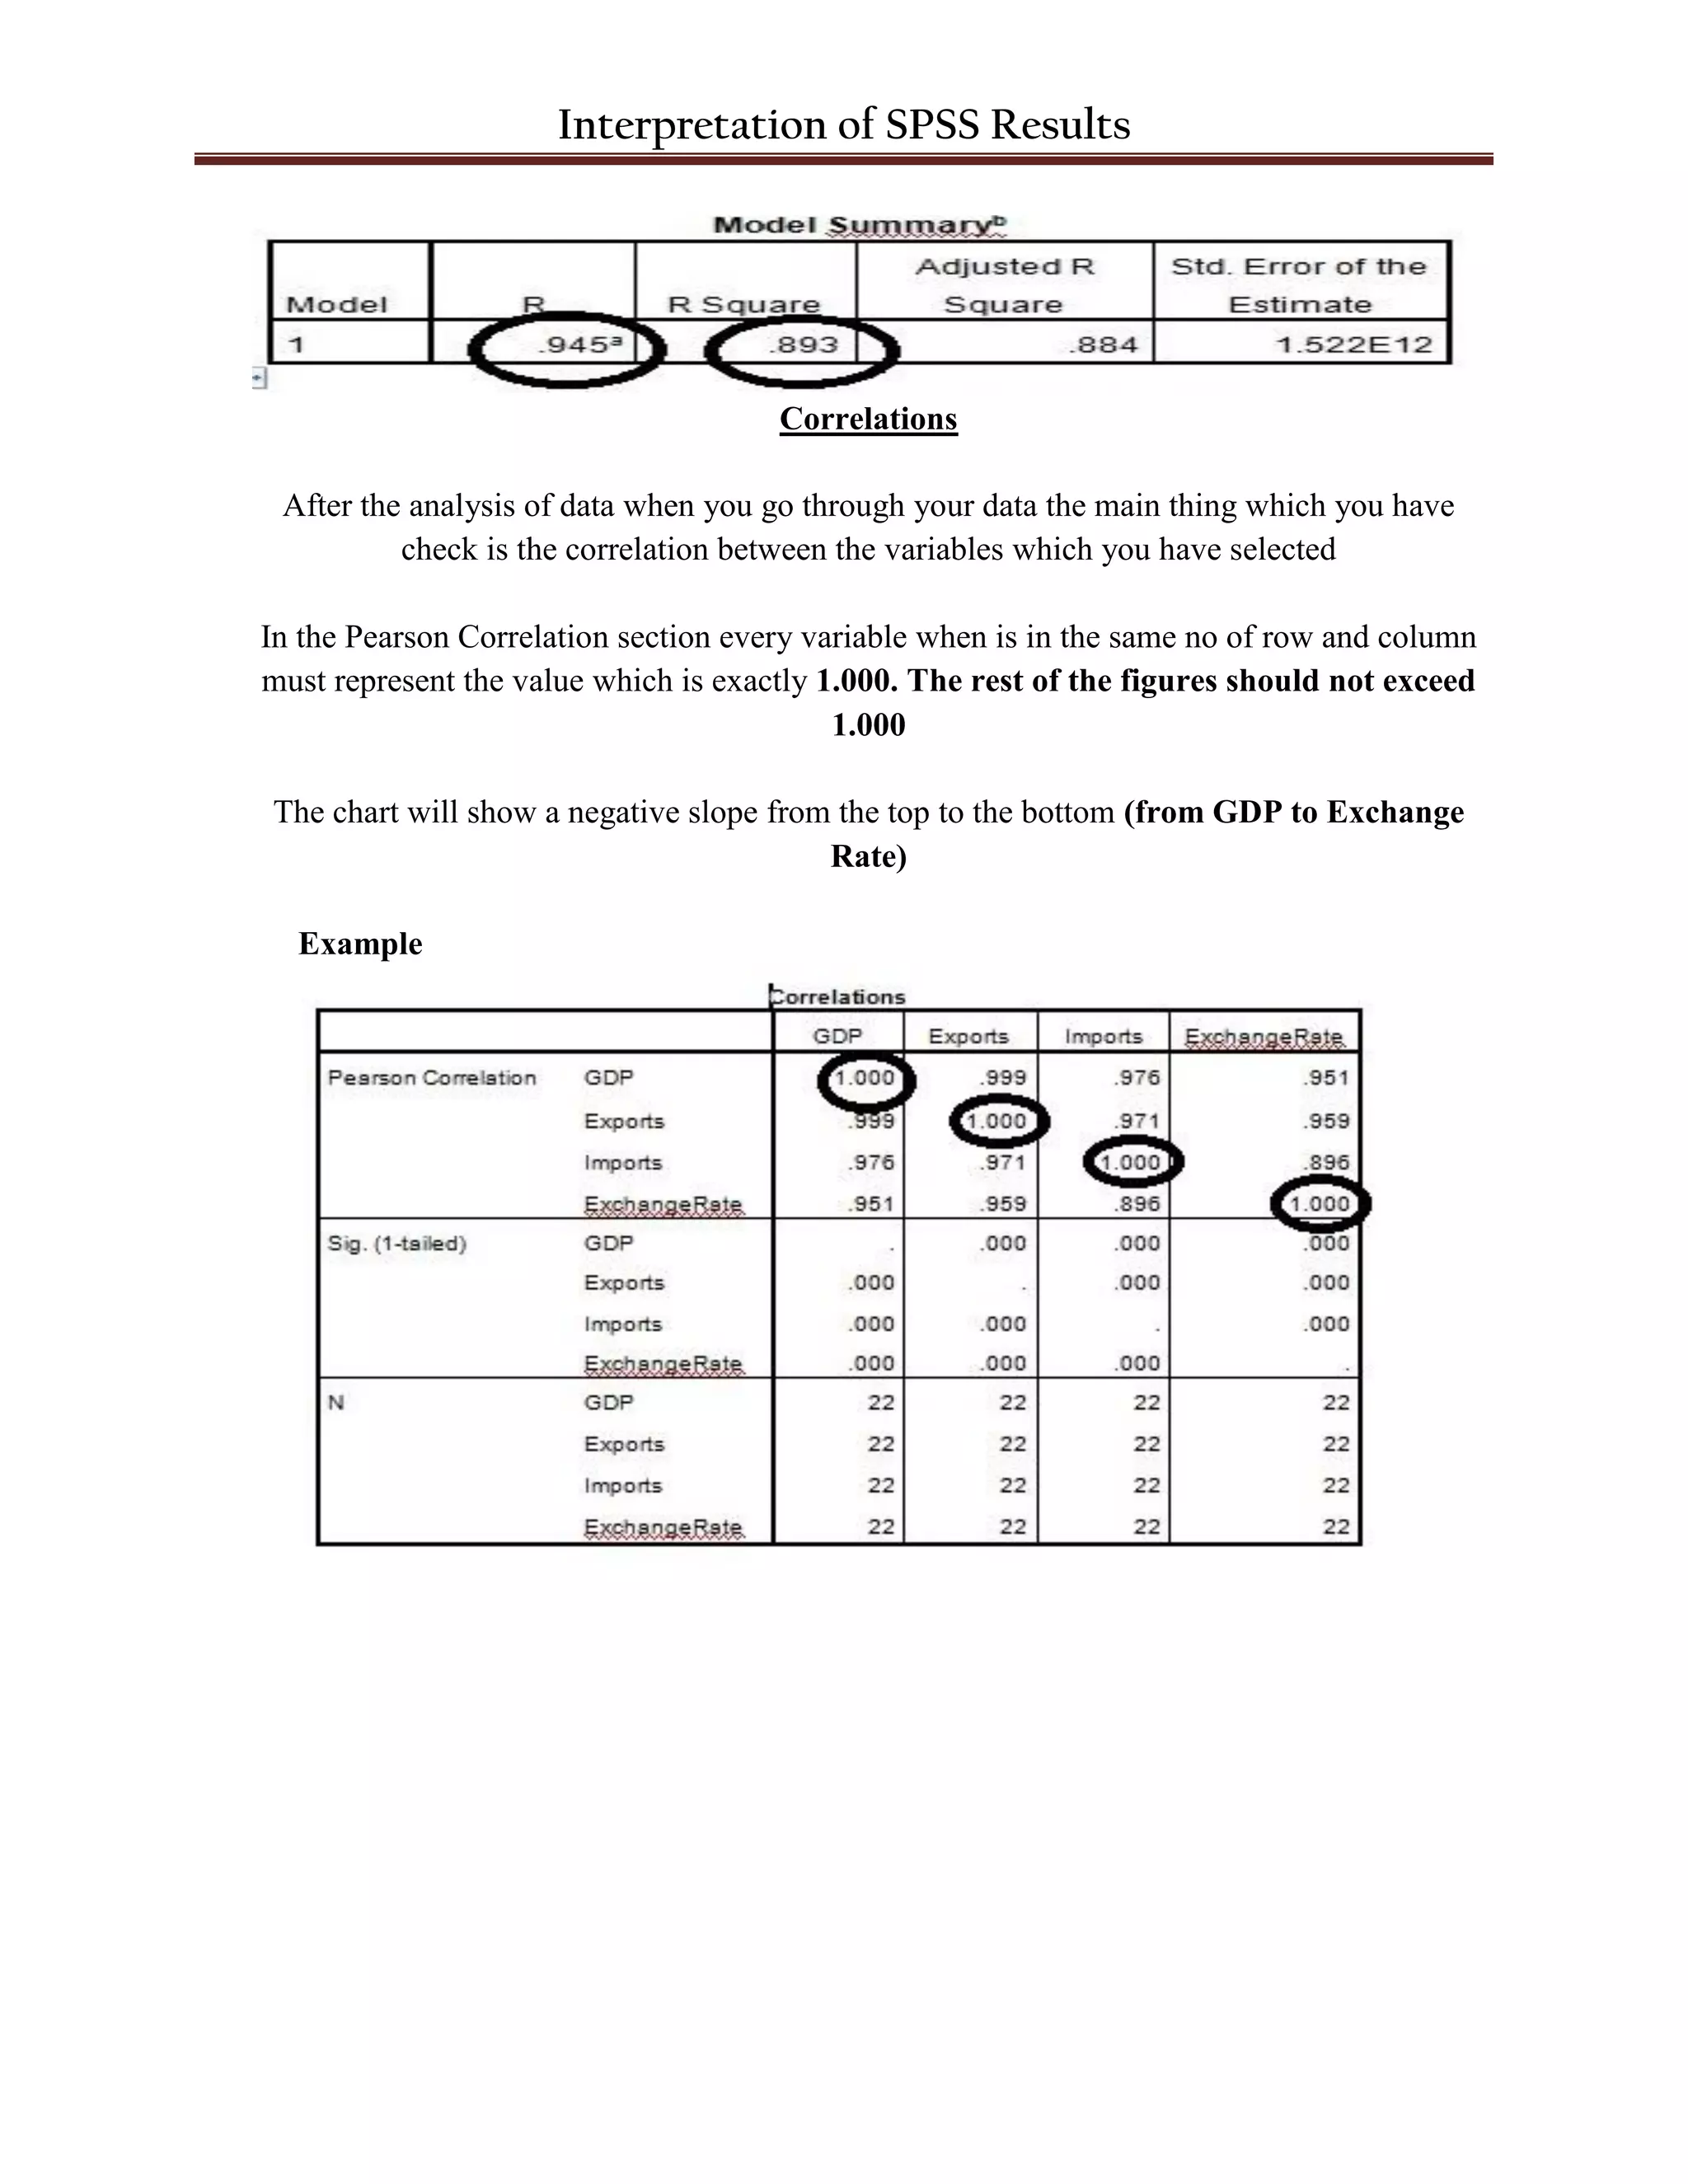

The document discusses interpreting results from SPSS analysis with GDP as the dependent variable and imports, exports, and exchange rate as independent variables. It states that imports and exports have a significant relationship with GDP based on their t-test values being less than 0.5, while exchange rate does not due to its t-test value being greater than 0.5. Imports also have an inverse relationship with GDP. The Durbin-Watson value of 1.856 is within the acceptable range of 1.7 to 2.0. R should be greater than 0.8 and R-square depends on R. Correlations between variables should be exactly 1.000.