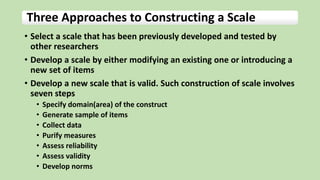
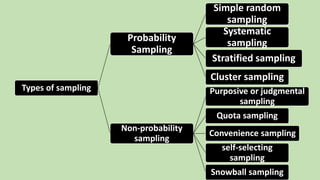
Measurement, Scaling and Sampling
Measurement
It is the process of assigning numbers or symbols to object, event or issue on
the basis of certain rules.
In social science research also measurement is done by assigning numbers to
the qualitative phenomenon.
According to S. Steven,” Measurement is the equipment of providing numbers
to objects or events according to rule.”
According to Goode and Hatt,”Measurement is the method of turning the
series of qualitative facts into a quantitative series.”
Scaling
A scale is a continuum, consisting of the highest point in terms of some
characteristic e.g. satisfaction level, preference, etc. and the lowest point along
with several intermediate points between these two extreme points.
Scaling is a process of preparing a continuum.
Scaling is attempting to determine quantitative measures of subjective
abstract concepts.
Scaling provides mechanism for measuring abstract concepts
Attitude Measurement
Attitude is a reaction made by a person over any event,
product or other thing
It is the judgement of any individual about any event or
situation or object or person
Those scales used in social science which help measure a
persons attitude are known as attitude measurement scales
Measurement helps to convert qualitative facts in
quantitative figures
Three Approaches to Constructing a Scale
• Select a scale that has been previously developed and tested by
other researchers
• Develop a scale by either modifying an existing one or introducing a
new set of items
• Develop a new scale that is valid. Such construction of scale involves
seven steps
• Specify domain(area) of the construct
• Generate sample of items
• Collect data
• Purify measures
• Assess reliability
• Assess validity
• Develop norms
Techniques for Developing Attitude Scale
(Mechanisms for Measuring Attitude)
• Ranking
• Respondents are asked to rank the objects or characteristics
• Rating
• The respondents are asked to rate the characteristics or
attribute. Maximum and minim rating are specified.
• Sorting
• Several concepts are provided to the respondents and asked to
arrange them in order on the basis of their priority/value. Such
arrangements reflect the attitude of the respondents.
• Choice
• Respondents are offered a number of choices and asked to select
any one.
Construction of Scale
• Number or symbols are provided for the
measurement of such qualitative subject
• Various scales can be used for measurement of
attitude of human beings.
1. Arbitrary Scale
2. Summated Rating Scale or Likert Scale
3. Differential Scale or Thurstone Scale
4. Cumulative or Guttman Scale
Arbitrary Scale
• Social phenomena change over time and new phenomenon
exist
• To study such phenomenon need new and different scales
• An arbitrary scale is a new scale developed by the researcher
for her research
• Mostly done if the arear of research is new
• For such scale to be used, the researcher should ensure the
reliability and validity first
Likert Scale (Summated Rating Scale)
• Developed by Rensis Likert
• Most widely used scale in social science research
• Measures the degree of agreement or disagreement to a series of
statements
• It can be 5, 7 or 9 point scale
• After the responses are collected, an average of each questions is
calculated and the inferences are made
Table Likert Scale Items
3.
2.
1.
________
________
________
Agree
________
________
________
Strongly
Agree
________________________
Students involved in politics
are less performing than the
one not involved in politics
________________________
College management is
responsible for involvement of
students in politics
________________________
Students should not be
involved in politics
Neither
Agree nor
Disagree
DisagreeStrongly
Disagree
Procedure for Construction of Likert Scale
1. Collect the large number of statements which are relevant to the
attitude under study
2. A prior test is to be made by selecting a small number of
respondents after gathering the statements
3. Most favorable attitude should be given the highest score of 5/7
/9
4. Most unfavorable attitude is given the lowest score 1
5. Total score of each respondent is obtained by adding their scores
obtained in separate statements
6. Find out those statements which have a highest discriminatory
power
7. Only those statements that correlate with the total test should be
included in the final instrument and the other should be discarded
Differential Scale or Thurstone Scale
• Developed by L.L. Thurstone
• The scale items are selected by the a panel of judges
• Selection is made on the basis of relevance of items to
the topic and the level of ambiguity in implication
• Judges are involved in ranking the statements from
most favourbale to least favourable of certain attitude
Procedure of construction of Differential Scale
1.Gather the large number of statements that express
various points of view toward a subject, group , event or
practice
2.These statements are presented to the panel of judges,
every judge is requested to place in the piles to the
statements from most unfavorable to most favorable
3.Items which are market disagreement by the judges in
assigning a position are discarded
4.Every retained item is given median scale value between
the highest and lowest value as set by the panel of judges
5.The position of each statement on the scale is determined
by the judges
Example
Following statement and median values are set by the panel of judges
to measure the employees attitude toward organization
Here if a respondent is asked to select any two statements, and he
selected statements second and fourth, the score is calculated as
Average value = (7.5 + 6.3)/2 = 6.9
Statements Scale
I am satisfied with this organization for the time being 8.2
If I leave this organization, I face the problem 7.5
Working environment of the organization is good 4.0
Rules and regulation of this organization are clear 6.3
Cumulative or Guttman Scale
• Also called Louis Guttman’s Scalogram analysis
• It involves gathering of series of statements as in other
scales
• In this scale, items are arranged in an order so that an
individual who agrees with a particular item also agrees
with items of lower rank-order.
• It eases analysis of data
Example
Bogardus Social Distance Scale
(Least Extreme)
1.Are you willing to permit immigrants to live in your country?
2.Are you willing to permit immigrants to live in your community?
3.Are you willing to permit immigrants to live in your neighborhood?
4.Are you willing to permit immigrants to live next door to you?
5.Would you permit your child to marry an immigrant?
(Most Extreme)
Here agreement with item 3 implies agreement with items 1 and 2
Procedure of Construction of Guttman Scale
1.Select the statements in clear terms on the basis of the
issue/objective we want to deal with
2.Pre-testing of statements o the sample of about 100 people
3.Removing those statements which possess more than 80
percent agreements or disagreements
4.Arranging the statements on the basis of high response and
low response
5.Response which does not indicate clearly the favorableness
and unfavorableness should be removed
6. Determining the coefficient of reproducibility.
a)Determining the number of errors
b)Reproducibility = 1- no. of errors/no. of responses
(No. of errors - those responses which do not
follow the pattern)
c)if value of reproducibility is 90 or more, then the
scale is considered as unidimensional
7. Value of respondents is assessed base on the
favorable answers provided by them
Scales and Techniques Commonly Used in Business Research
Likert scale
Graphic rating scale
Itemized rating scale
Rank order rating scale
Semantic differential scale
Other simple scales
• simple category questions
• multiple choice questions
• Open-ended questions
Likert Scale
Graphic Rating Scale
• Commonly used in business research
• Respondents are asked to indicate the response to a particular question
by placing a mark at appropriate point to express their opinions
• A graphic rating scale presents a continuum, in the form of a straight
line, along which a theoretically infinite number of ratings are possible
• E.g. How do your rate your departmental head
Itemized Rating Scale
• Respondents are provided with a category of responses
out of which the respondent selects one that is most
relevant for answer
• E.g.
How do you rate your interest in changing
organizational policies?
a. extremely poor b. not at all
c. some what well d. very well
Rank Order Rating Scale
• It is a comparative method
• Respondents are asked to rank the given items on the basis
of their priority and preference
• Items are arranged from the top most priority to the lowest
priority
• It only develops ordinal data
• e.g. Rate the following brands of beer (1- most
preferred, 5 least preferred)
Beer Rank
Carlsberg
Nepal Ice
Tuborg
Sanmiguel
Gorkha Beer
Semantic Differential Scale (Bipolar Scale)
• It is typically a seven point rating scale
• Respondents are asked to rate their opinion on a linear scale
between two points
• Rating is done on bipolar scales defined with contrasting
adjectives at each end
Example: Please rate your supervisor on the following
dimensions
Cooperative 1 2 3 4 5 6 7 Non-
cooperative
Other Simple Scales
Simple Category Questions
• It is called dichotomous scale
• Provides two mutually exclusive choices
• Example: Are you aware about the basic human rights?
• Yes b. No
Multiple Choice Question
• Many choices are offered but asked to select one or few choices
• Example: Which bath soap do you prefer the most?
• Lux
• Dettol
• Liril
• Pears
• Lifebuoy
Open-ended Questions
• Respondents are asked to give their opinion in subject
form
• Provides chance to respond in detail
• Example: Which subjects do you prefer the most in BBA 5th
semester?
• -------------------------------------------------------------.
Validity and Reliability of Measurement
Validity of Measurement
• Validity of an instrument is the degree to which it
measures what it is supposed to measure.
• Validity refers to the question of whether our
measurements are actually hitting on the construct
we think they are
• According to Goode and Hatt,” A scale processes its
validity when it actually measures what it claims to
measure.”
Types of Validity
Content Validity
•Also called face validity
•It ensures whether the measurement tools
include an adequate and representative set of
items that would tap the concept
•Methods: Judgmental, panel evaluation with
content validity ratio, correlation
Criterion-Related Validity
• It refers to the success of the measures to predict or estimate
• This validity is used when measures differentiate individual on a
criterion it is expected to predict
• Helps to establish correlation between actual and standard work
• Concurrent Validity: scale should different individuals who are
known to be different, they should score differently in the
instrument
• Predictive Validity: differentiate individual with reference to
future
•E.g. one scoring lower in aptitude should be a
lower performer than one scoring higher
•A criterion should have some qualities as below
•Relevance:
•Freedom from biases
•Reliability
•Availability: information specified by the criterion
should be available
•Method: Correlation
•It is internal validity
•It testifies how well the results obtained from the use of the
measure fit the theories around which it is designed
•It is assessed through
•Convergent Validity: it is established when the scores
obtained with two different instruments measuring the
same concept are highly correlated
Construct Validity
• Discriminant Validity: it is established when, based on
theory, two variables are predicted to be
uncorrelated, and the score obtained by measuring
them are indeed empirically found to be so
• Methods: individual judgement, correlation of
proposed test with established one, convergent-
discriminant techniques, factor analysis
Reliability of Measurement
•Reliability refers to the consistency of the measurement
•Reliability refers to a measure’s ability to capture an
individual’s true score, i.e. to distinguish accurately one
person from another
•While a reliable measure will be consistent, consistency
can actually be seen as a by-product of reliability, and in a
case where we had perfect consistency (everyone scores
the same and gets the same score repeatedly)
Features of reliability
• Stability: stable and consistent result.
• Equivalence: equivalent results in different samples by
the same researcher
• Internal consistency: if the similar instruments are
used and the responses are highly correlated then
such measuring instruments are considered as
internally consistent
Methods of Measuring Reliability
•Test-retest method:
• Researcher measures any phenomena using the same
instrument time and again and checks the correlation
between the results
• checking the correlation between the results, if correlation
is high, instrument is reliable and vice versa
•Alternative or Parallel Form Method:
• Researcher develops two measuring instruments(forms)
under the same concept
• Measures the same phenomena using the two instruments
• If the results are highly correlated, the instrument is reliable
• Split-half Method
• Checks the correlation between two halves of an instrument
• Instrument is divided into two equal halves
• Two instruments are divided to two different group of samples
• If the results from both samples is highly correlated, instrument is
reliable
• Inter-rater Method
• Consistency of the judgement of several respondents or raters on
the same issue or question is evaluated
• If several respondents rate in the similar way, then the instrument
is reliable
• It is used for checking the reliability in case of observation,
unstructured interview, etc.
Sampling
• A population is a collection of elements about which
we wish to make an inference.
• A sampling frame is a list of sampling units.
• A sample is a collection of sampling units drawn from
a sampling frame.
Important terminologies
• Sampling is the process of selecting sub-set of the
population by the study of which a researcher would
be able to draw conclusions that would be
generalizable to the populations.
• Reason for sampling
• Census study may incur high cost
• Census study may not be timely feasible
Define the
population
Specify the
sampling
frame
Specify
sampling
unit
select the
sampling
method
Determine
the sample
size
Specify the
sampling
plan
Select the
sample
Sampling Process
Types of sampling
Probability
Sampling
Simple random
sampling
Systematic
sampling
Stratified sampling
Cluster sampling
Non-probability
sampling
Purposive or judgmental
sampling
Quota sampling
Convenience sampling
self-selecting
sampling
Snowball sampling
Probability Sampling
• Every item in the population has equal chance of
being selected as sample
• Used if there is necessity of generalizing the findings
of the research in large population
A.Simple Random Sampling
• Every item of population has equal probability of getting
selected
• Required samples are selected by lottery method, random
number table method, computerized lottery method, etc.
B. Systematic Sampling
• It involves selection of first item of sample in pure
random fashion and the subsequent units in Kth
interval.
• Sampling interval (K)= Size of Population (N)/Size of
Sample (n)
• Initially a number is randomly selected from 1 to K.
• Subsequent units are selected in the Kth interval
C. Stratified Sampling
•Strata is the group of items having common characteristics
•Whole population is divided in several groups called strata
•Certain Items are selected from each strata to form the
sample
•It is of two types
• Proportionate stratified sample – The size of the sample selected
from each subgroup is proportional to the size of that subgroup in
the entire population.
• Disproportionate stratified sample – The size of the sample
selected from each subgroup is disproportional to the size of that
subgroup in the population.
D. Cluster Sampling
• A cluster is a heterogeneous group that is in the
population
• A group(cluster) is selected as sample having all the
types of elements of population
• Random sampling method is used while selecting the
clusters as sample
• Usually convenient for collection of data as a cluster is
a mini population and has all the features of
population
Non-probability Sampling
• A method of sampling where every unit of population does
not have equal chance of getting selected as a sample unit
• Findings may not be generalized to the whole population
• Helps to collect data at lower cost and or time
A. Purposive or Judgmental Sampling
• Samples are selected based on the judgement or
discretion of the researcher
• Researcher should know every unit of population and
their features for applying this sampling method
• Generally used by experts
B. Quota Sampling
• Population is divided into different groups based on
their characteristics and sample is selected from each
group in a certain rate
• Widely used because every society and work field has
heterogeneous groups
C. Convenience Sampling
• Researcher selects each unit of sample on the basis of
easiness or convenience to him
• The researcher selects those units that are available , nearby
and willing to participate or has relationship
• Mostly used if the is limitation of time and resources
• E.g. if a researcher is conducting study about the job
satisfaction of the bankers, he may select the banker of
Mahendranagar. Where Mahendranagar is his hometown.
D. Self-selecting Sampling
• Respondents voluntarily participate to render the
information
• If the researcher circulates information through media to the
respondents and respondents provide information on the
basis of information, it is called self-selecting sampling
• Those who provide information on the basis of information
are considered sample
E. Snowball Sampling
•Also called reference sampling or network sampling
•If the population size is infinite or can not be fixed, or
the samples are hard to find at once this method is
used
•It may be extremely difficult or cost prohibitive to
locate respondents in these situations.
•This technique relies on referrals from initial subjects
to generate additional subjects.
•Few people or single person is identified and other
persons are identified based on the reference of
previously selected persons
• It lowers search costs; however, it introduces bias because
the technique itself reduces the likelihood that the sample
will represent a good cross section from the population.
• Mostly used by police to find out criminals, and to study over
the group activities, culture and relationship of society, etc.
Sampling and Non-sampling Error
• Population specification
error
• Sample frame error
• Selection error
• Non-response error
• Error in taking sample
Sampling
Error
• Errors of poor sampling design
• Over and under coverage
• Misinterpretation of questions
• Processing errors
• Respondent related errors
• Errors of researcher
• Measuring errors
Non-sampling
Error
Sampling Error
It is the error of non-representativeness of sample
It arises as a result of taking a sample from a
population rather than using the whole population
Sampling error is thus zero in census study
•Population specification error
• Occurs when a researcher does not understand who
should be surveyed
• E.g. in selling baby toys, parents make the purchase
decision where as child influence the choice
•Sample frame error
• It occurs when wrong sub-population is used to select a
sample
• E.g. use of telephone directories for selecting samples
•Selection error
• It occurs when respondents self select their participation
in the study- only those who are interested to respond
• Can be controlled by increasing participation
Methods of Minimizing Sampling Errors
• Increase sample Size
• Cross check sample
• Unbiased sampling
• Appropriate sampling design
• Clear questionnaire
Non-sampling Error
• Exists in both census study and sampling study
• They are the errors except the non-representative sample
• Can occur at any time: during collection of data, processing
of data, planning of survey and execution of survey
• Errors of poor sampling design
• If the researcher fails to identify appropriate respondent and lack
the proper planning
• Over and under coverage
• Sometimes researcher may select more elements or leave the
essential elements as sample
• Misinterpretation of questions
• Respondents may interpret the questions differently
• May occur due to ambiguous and vague language
• Processing errors
• Errors in coding, decoding, editing, analyzing data and interpreting
results
• Respondent related errors
• When respondents do not give response, give biased response,
not become able to give response, or researcher can not record
the accurate response
• Errors in researcher
• Weak definition of variables
• Selection of wrong method
• Preparing of weak questionnaire
• Weak administration of questionnaire
• Measuring errors
• Weak measurement instruments
• Unclear understanding of questionnaire due to poor preparation
• Unskilled and untrained surveyor
Methods of Minimizing Non-sampling Errors
• Checking the sampling process
• Preparation of questionnaire
• Pilot survey
• Fix procedures
• Use of competent manpower
• Provide information
• Provide training
• Use of experts
• Checking data processing and analysis

Measurement, scaling and sampling

  • 1.
  • 2.
    Measurement It is theprocess of assigning numbers or symbols to object, event or issue on the basis of certain rules. In social science research also measurement is done by assigning numbers to the qualitative phenomenon. According to S. Steven,” Measurement is the equipment of providing numbers to objects or events according to rule.” According to Goode and Hatt,”Measurement is the method of turning the series of qualitative facts into a quantitative series.”
  • 3.
    Scaling A scale isa continuum, consisting of the highest point in terms of some characteristic e.g. satisfaction level, preference, etc. and the lowest point along with several intermediate points between these two extreme points. Scaling is a process of preparing a continuum. Scaling is attempting to determine quantitative measures of subjective abstract concepts. Scaling provides mechanism for measuring abstract concepts
  • 4.
    Attitude Measurement Attitude isa reaction made by a person over any event, product or other thing It is the judgement of any individual about any event or situation or object or person Those scales used in social science which help measure a persons attitude are known as attitude measurement scales Measurement helps to convert qualitative facts in quantitative figures
  • 5.
    Three Approaches toConstructing a Scale • Select a scale that has been previously developed and tested by other researchers • Develop a scale by either modifying an existing one or introducing a new set of items • Develop a new scale that is valid. Such construction of scale involves seven steps • Specify domain(area) of the construct • Generate sample of items • Collect data • Purify measures • Assess reliability • Assess validity • Develop norms
  • 6.
    Techniques for DevelopingAttitude Scale (Mechanisms for Measuring Attitude) • Ranking • Respondents are asked to rank the objects or characteristics • Rating • The respondents are asked to rate the characteristics or attribute. Maximum and minim rating are specified. • Sorting • Several concepts are provided to the respondents and asked to arrange them in order on the basis of their priority/value. Such arrangements reflect the attitude of the respondents. • Choice • Respondents are offered a number of choices and asked to select any one.
  • 7.
    Construction of Scale •Number or symbols are provided for the measurement of such qualitative subject • Various scales can be used for measurement of attitude of human beings. 1. Arbitrary Scale 2. Summated Rating Scale or Likert Scale 3. Differential Scale or Thurstone Scale 4. Cumulative or Guttman Scale
  • 8.
    Arbitrary Scale • Socialphenomena change over time and new phenomenon exist • To study such phenomenon need new and different scales • An arbitrary scale is a new scale developed by the researcher for her research • Mostly done if the arear of research is new • For such scale to be used, the researcher should ensure the reliability and validity first
  • 9.
    Likert Scale (SummatedRating Scale) • Developed by Rensis Likert • Most widely used scale in social science research • Measures the degree of agreement or disagreement to a series of statements • It can be 5, 7 or 9 point scale • After the responses are collected, an average of each questions is calculated and the inferences are made
  • 10.
    Table Likert ScaleItems 3. 2. 1. ________ ________ ________ Agree ________ ________ ________ Strongly Agree ________________________ Students involved in politics are less performing than the one not involved in politics ________________________ College management is responsible for involvement of students in politics ________________________ Students should not be involved in politics Neither Agree nor Disagree DisagreeStrongly Disagree
  • 11.
    Procedure for Constructionof Likert Scale 1. Collect the large number of statements which are relevant to the attitude under study 2. A prior test is to be made by selecting a small number of respondents after gathering the statements 3. Most favorable attitude should be given the highest score of 5/7 /9 4. Most unfavorable attitude is given the lowest score 1 5. Total score of each respondent is obtained by adding their scores obtained in separate statements 6. Find out those statements which have a highest discriminatory power 7. Only those statements that correlate with the total test should be included in the final instrument and the other should be discarded
  • 12.
    Differential Scale orThurstone Scale • Developed by L.L. Thurstone • The scale items are selected by the a panel of judges • Selection is made on the basis of relevance of items to the topic and the level of ambiguity in implication • Judges are involved in ranking the statements from most favourbale to least favourable of certain attitude
  • 13.
    Procedure of constructionof Differential Scale 1.Gather the large number of statements that express various points of view toward a subject, group , event or practice 2.These statements are presented to the panel of judges, every judge is requested to place in the piles to the statements from most unfavorable to most favorable 3.Items which are market disagreement by the judges in assigning a position are discarded 4.Every retained item is given median scale value between the highest and lowest value as set by the panel of judges 5.The position of each statement on the scale is determined by the judges
  • 14.
    Example Following statement andmedian values are set by the panel of judges to measure the employees attitude toward organization Here if a respondent is asked to select any two statements, and he selected statements second and fourth, the score is calculated as Average value = (7.5 + 6.3)/2 = 6.9 Statements Scale I am satisfied with this organization for the time being 8.2 If I leave this organization, I face the problem 7.5 Working environment of the organization is good 4.0 Rules and regulation of this organization are clear 6.3
  • 15.
    Cumulative or GuttmanScale • Also called Louis Guttman’s Scalogram analysis • It involves gathering of series of statements as in other scales • In this scale, items are arranged in an order so that an individual who agrees with a particular item also agrees with items of lower rank-order. • It eases analysis of data
  • 16.
    Example Bogardus Social DistanceScale (Least Extreme) 1.Are you willing to permit immigrants to live in your country? 2.Are you willing to permit immigrants to live in your community? 3.Are you willing to permit immigrants to live in your neighborhood? 4.Are you willing to permit immigrants to live next door to you? 5.Would you permit your child to marry an immigrant? (Most Extreme) Here agreement with item 3 implies agreement with items 1 and 2
  • 17.
    Procedure of Constructionof Guttman Scale 1.Select the statements in clear terms on the basis of the issue/objective we want to deal with 2.Pre-testing of statements o the sample of about 100 people 3.Removing those statements which possess more than 80 percent agreements or disagreements 4.Arranging the statements on the basis of high response and low response 5.Response which does not indicate clearly the favorableness and unfavorableness should be removed
  • 18.
    6. Determining thecoefficient of reproducibility. a)Determining the number of errors b)Reproducibility = 1- no. of errors/no. of responses (No. of errors - those responses which do not follow the pattern) c)if value of reproducibility is 90 or more, then the scale is considered as unidimensional 7. Value of respondents is assessed base on the favorable answers provided by them
  • 19.
    Scales and TechniquesCommonly Used in Business Research Likert scale Graphic rating scale Itemized rating scale Rank order rating scale Semantic differential scale Other simple scales • simple category questions • multiple choice questions • Open-ended questions
  • 20.
    Likert Scale Graphic RatingScale • Commonly used in business research • Respondents are asked to indicate the response to a particular question by placing a mark at appropriate point to express their opinions • A graphic rating scale presents a continuum, in the form of a straight line, along which a theoretically infinite number of ratings are possible • E.g. How do your rate your departmental head
  • 21.
    Itemized Rating Scale •Respondents are provided with a category of responses out of which the respondent selects one that is most relevant for answer • E.g. How do you rate your interest in changing organizational policies? a. extremely poor b. not at all c. some what well d. very well
  • 22.
    Rank Order RatingScale • It is a comparative method • Respondents are asked to rank the given items on the basis of their priority and preference • Items are arranged from the top most priority to the lowest priority • It only develops ordinal data
  • 23.
    • e.g. Ratethe following brands of beer (1- most preferred, 5 least preferred) Beer Rank Carlsberg Nepal Ice Tuborg Sanmiguel Gorkha Beer
  • 24.
    Semantic Differential Scale(Bipolar Scale) • It is typically a seven point rating scale • Respondents are asked to rate their opinion on a linear scale between two points • Rating is done on bipolar scales defined with contrasting adjectives at each end Example: Please rate your supervisor on the following dimensions Cooperative 1 2 3 4 5 6 7 Non- cooperative
  • 25.
    Other Simple Scales SimpleCategory Questions • It is called dichotomous scale • Provides two mutually exclusive choices • Example: Are you aware about the basic human rights? • Yes b. No Multiple Choice Question • Many choices are offered but asked to select one or few choices • Example: Which bath soap do you prefer the most? • Lux • Dettol • Liril • Pears • Lifebuoy
  • 26.
    Open-ended Questions • Respondentsare asked to give their opinion in subject form • Provides chance to respond in detail • Example: Which subjects do you prefer the most in BBA 5th semester? • -------------------------------------------------------------.
  • 27.
    Validity and Reliabilityof Measurement Validity of Measurement • Validity of an instrument is the degree to which it measures what it is supposed to measure. • Validity refers to the question of whether our measurements are actually hitting on the construct we think they are • According to Goode and Hatt,” A scale processes its validity when it actually measures what it claims to measure.”
  • 28.
    Types of Validity ContentValidity •Also called face validity •It ensures whether the measurement tools include an adequate and representative set of items that would tap the concept •Methods: Judgmental, panel evaluation with content validity ratio, correlation
  • 29.
    Criterion-Related Validity • Itrefers to the success of the measures to predict or estimate • This validity is used when measures differentiate individual on a criterion it is expected to predict • Helps to establish correlation between actual and standard work • Concurrent Validity: scale should different individuals who are known to be different, they should score differently in the instrument • Predictive Validity: differentiate individual with reference to future •E.g. one scoring lower in aptitude should be a lower performer than one scoring higher
  • 30.
    •A criterion shouldhave some qualities as below •Relevance: •Freedom from biases •Reliability •Availability: information specified by the criterion should be available •Method: Correlation
  • 31.
    •It is internalvalidity •It testifies how well the results obtained from the use of the measure fit the theories around which it is designed •It is assessed through •Convergent Validity: it is established when the scores obtained with two different instruments measuring the same concept are highly correlated Construct Validity
  • 32.
    • Discriminant Validity:it is established when, based on theory, two variables are predicted to be uncorrelated, and the score obtained by measuring them are indeed empirically found to be so • Methods: individual judgement, correlation of proposed test with established one, convergent- discriminant techniques, factor analysis
  • 33.
    Reliability of Measurement •Reliabilityrefers to the consistency of the measurement •Reliability refers to a measure’s ability to capture an individual’s true score, i.e. to distinguish accurately one person from another •While a reliable measure will be consistent, consistency can actually be seen as a by-product of reliability, and in a case where we had perfect consistency (everyone scores the same and gets the same score repeatedly)
  • 34.
    Features of reliability •Stability: stable and consistent result. • Equivalence: equivalent results in different samples by the same researcher • Internal consistency: if the similar instruments are used and the responses are highly correlated then such measuring instruments are considered as internally consistent
  • 35.
    Methods of MeasuringReliability •Test-retest method: • Researcher measures any phenomena using the same instrument time and again and checks the correlation between the results • checking the correlation between the results, if correlation is high, instrument is reliable and vice versa •Alternative or Parallel Form Method: • Researcher develops two measuring instruments(forms) under the same concept • Measures the same phenomena using the two instruments • If the results are highly correlated, the instrument is reliable
  • 36.
    • Split-half Method •Checks the correlation between two halves of an instrument • Instrument is divided into two equal halves • Two instruments are divided to two different group of samples • If the results from both samples is highly correlated, instrument is reliable • Inter-rater Method • Consistency of the judgement of several respondents or raters on the same issue or question is evaluated • If several respondents rate in the similar way, then the instrument is reliable • It is used for checking the reliability in case of observation, unstructured interview, etc.
  • 37.
    Sampling • A populationis a collection of elements about which we wish to make an inference. • A sampling frame is a list of sampling units. • A sample is a collection of sampling units drawn from a sampling frame. Important terminologies
  • 38.
    • Sampling isthe process of selecting sub-set of the population by the study of which a researcher would be able to draw conclusions that would be generalizable to the populations. • Reason for sampling • Census study may incur high cost • Census study may not be timely feasible
  • 39.
    Define the population Specify the sampling frame Specify sampling unit selectthe sampling method Determine the sample size Specify the sampling plan Select the sample Sampling Process
  • 40.
    Types of sampling Probability Sampling Simplerandom sampling Systematic sampling Stratified sampling Cluster sampling Non-probability sampling Purposive or judgmental sampling Quota sampling Convenience sampling self-selecting sampling Snowball sampling
  • 41.
    Probability Sampling • Everyitem in the population has equal chance of being selected as sample • Used if there is necessity of generalizing the findings of the research in large population A.Simple Random Sampling • Every item of population has equal probability of getting selected • Required samples are selected by lottery method, random number table method, computerized lottery method, etc.
  • 42.
    B. Systematic Sampling •It involves selection of first item of sample in pure random fashion and the subsequent units in Kth interval. • Sampling interval (K)= Size of Population (N)/Size of Sample (n) • Initially a number is randomly selected from 1 to K. • Subsequent units are selected in the Kth interval
  • 44.
    C. Stratified Sampling •Stratais the group of items having common characteristics •Whole population is divided in several groups called strata •Certain Items are selected from each strata to form the sample •It is of two types • Proportionate stratified sample – The size of the sample selected from each subgroup is proportional to the size of that subgroup in the entire population. • Disproportionate stratified sample – The size of the sample selected from each subgroup is disproportional to the size of that subgroup in the population.
  • 46.
    D. Cluster Sampling •A cluster is a heterogeneous group that is in the population • A group(cluster) is selected as sample having all the types of elements of population • Random sampling method is used while selecting the clusters as sample • Usually convenient for collection of data as a cluster is a mini population and has all the features of population
  • 47.
    Non-probability Sampling • Amethod of sampling where every unit of population does not have equal chance of getting selected as a sample unit • Findings may not be generalized to the whole population • Helps to collect data at lower cost and or time A. Purposive or Judgmental Sampling • Samples are selected based on the judgement or discretion of the researcher • Researcher should know every unit of population and their features for applying this sampling method • Generally used by experts
  • 48.
    B. Quota Sampling •Population is divided into different groups based on their characteristics and sample is selected from each group in a certain rate • Widely used because every society and work field has heterogeneous groups
  • 49.
    C. Convenience Sampling •Researcher selects each unit of sample on the basis of easiness or convenience to him • The researcher selects those units that are available , nearby and willing to participate or has relationship • Mostly used if the is limitation of time and resources • E.g. if a researcher is conducting study about the job satisfaction of the bankers, he may select the banker of Mahendranagar. Where Mahendranagar is his hometown.
  • 50.
    D. Self-selecting Sampling •Respondents voluntarily participate to render the information • If the researcher circulates information through media to the respondents and respondents provide information on the basis of information, it is called self-selecting sampling • Those who provide information on the basis of information are considered sample
  • 51.
    E. Snowball Sampling •Alsocalled reference sampling or network sampling •If the population size is infinite or can not be fixed, or the samples are hard to find at once this method is used •It may be extremely difficult or cost prohibitive to locate respondents in these situations. •This technique relies on referrals from initial subjects to generate additional subjects. •Few people or single person is identified and other persons are identified based on the reference of previously selected persons
  • 52.
    • It lowerssearch costs; however, it introduces bias because the technique itself reduces the likelihood that the sample will represent a good cross section from the population. • Mostly used by police to find out criminals, and to study over the group activities, culture and relationship of society, etc.
  • 53.
    Sampling and Non-samplingError • Population specification error • Sample frame error • Selection error • Non-response error • Error in taking sample Sampling Error • Errors of poor sampling design • Over and under coverage • Misinterpretation of questions • Processing errors • Respondent related errors • Errors of researcher • Measuring errors Non-sampling Error
  • 54.
    Sampling Error It isthe error of non-representativeness of sample It arises as a result of taking a sample from a population rather than using the whole population Sampling error is thus zero in census study
  • 55.
    •Population specification error •Occurs when a researcher does not understand who should be surveyed • E.g. in selling baby toys, parents make the purchase decision where as child influence the choice •Sample frame error • It occurs when wrong sub-population is used to select a sample • E.g. use of telephone directories for selecting samples •Selection error • It occurs when respondents self select their participation in the study- only those who are interested to respond • Can be controlled by increasing participation
  • 56.
    Methods of MinimizingSampling Errors • Increase sample Size • Cross check sample • Unbiased sampling • Appropriate sampling design • Clear questionnaire
  • 57.
    Non-sampling Error • Existsin both census study and sampling study • They are the errors except the non-representative sample • Can occur at any time: during collection of data, processing of data, planning of survey and execution of survey
  • 58.
    • Errors ofpoor sampling design • If the researcher fails to identify appropriate respondent and lack the proper planning • Over and under coverage • Sometimes researcher may select more elements or leave the essential elements as sample • Misinterpretation of questions • Respondents may interpret the questions differently • May occur due to ambiguous and vague language • Processing errors • Errors in coding, decoding, editing, analyzing data and interpreting results
  • 59.
    • Respondent relatederrors • When respondents do not give response, give biased response, not become able to give response, or researcher can not record the accurate response • Errors in researcher • Weak definition of variables • Selection of wrong method • Preparing of weak questionnaire • Weak administration of questionnaire • Measuring errors • Weak measurement instruments • Unclear understanding of questionnaire due to poor preparation • Unskilled and untrained surveyor
  • 60.
    Methods of MinimizingNon-sampling Errors • Checking the sampling process • Preparation of questionnaire • Pilot survey • Fix procedures • Use of competent manpower • Provide information • Provide training • Use of experts • Checking data processing and analysis