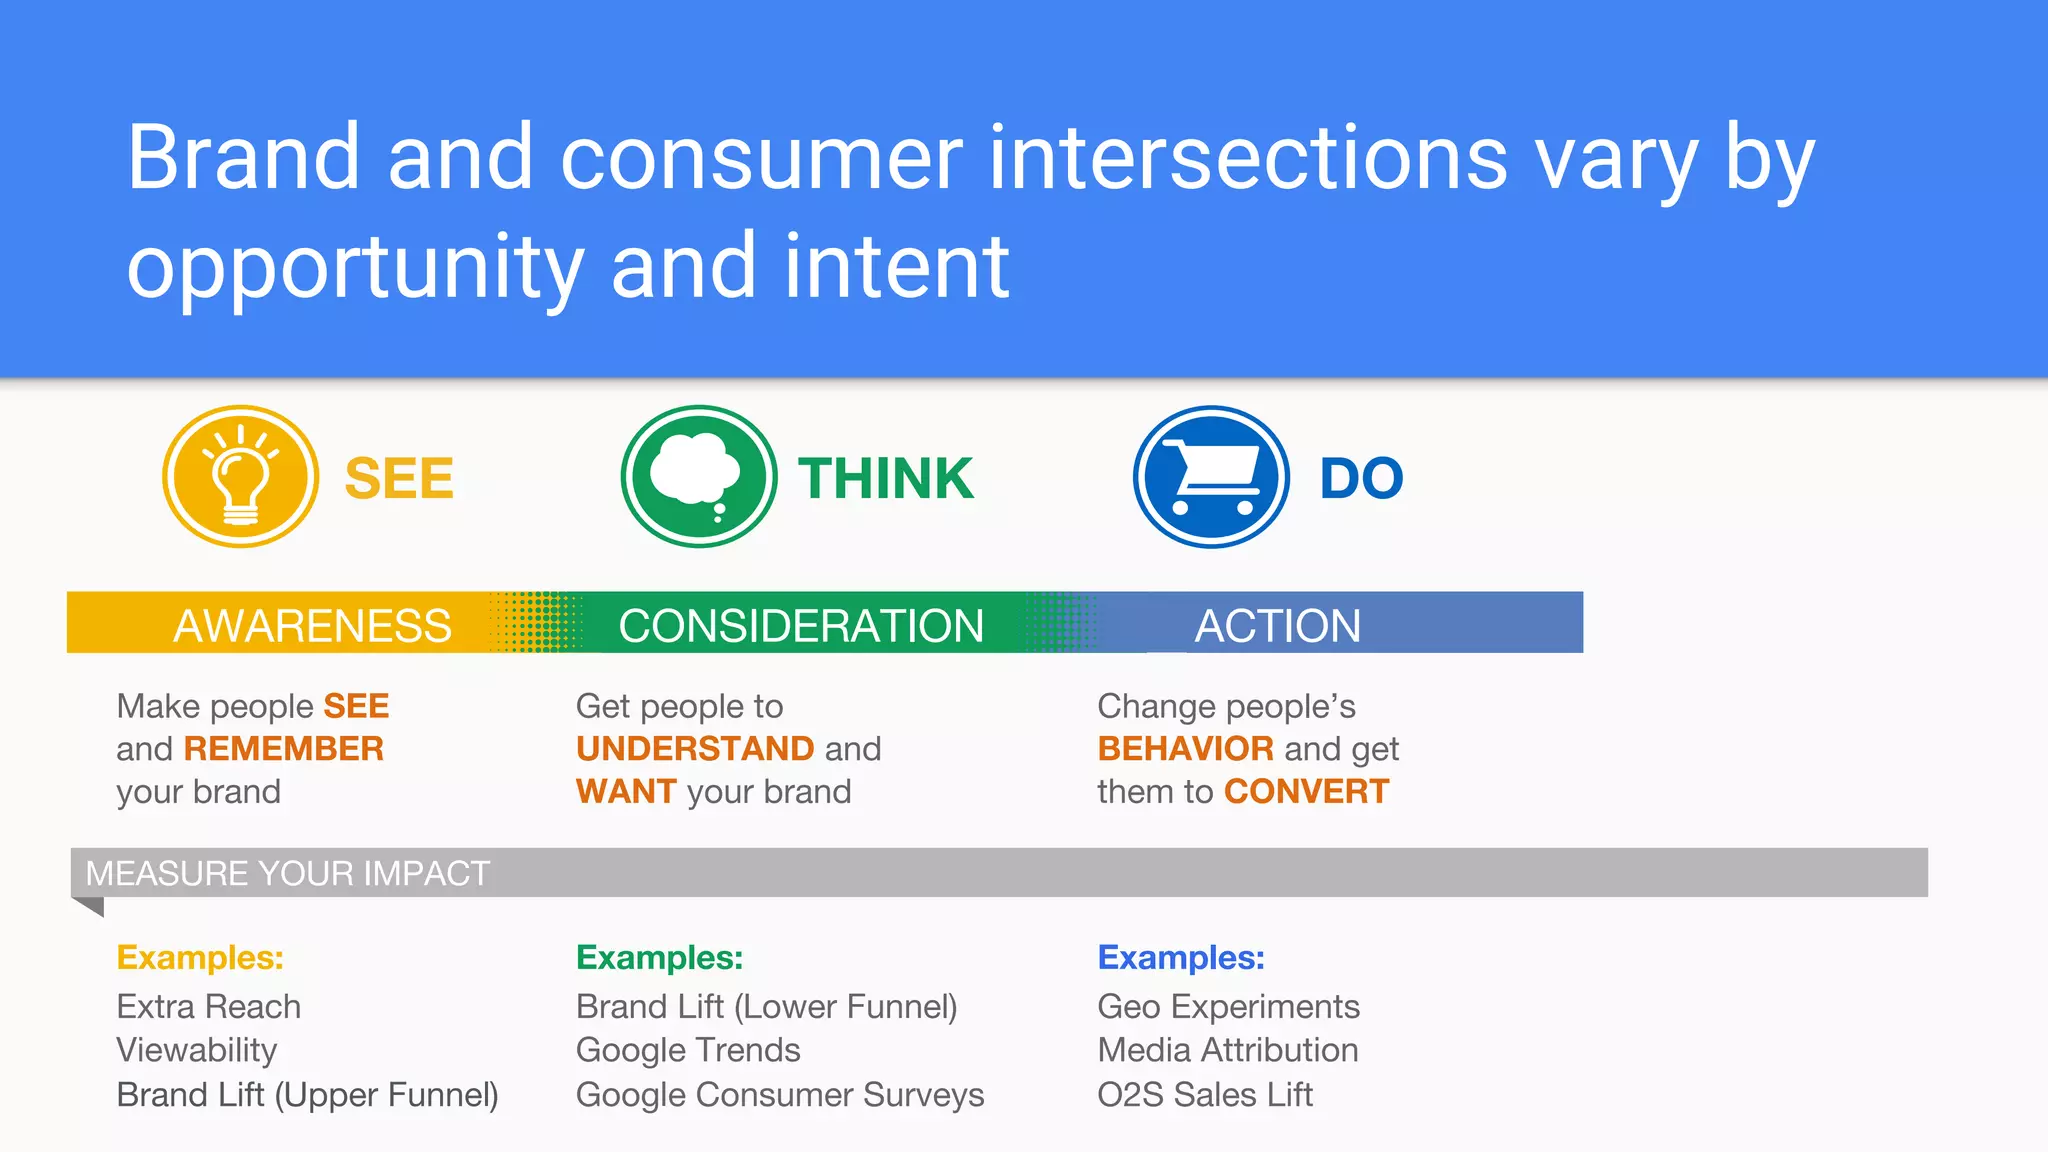
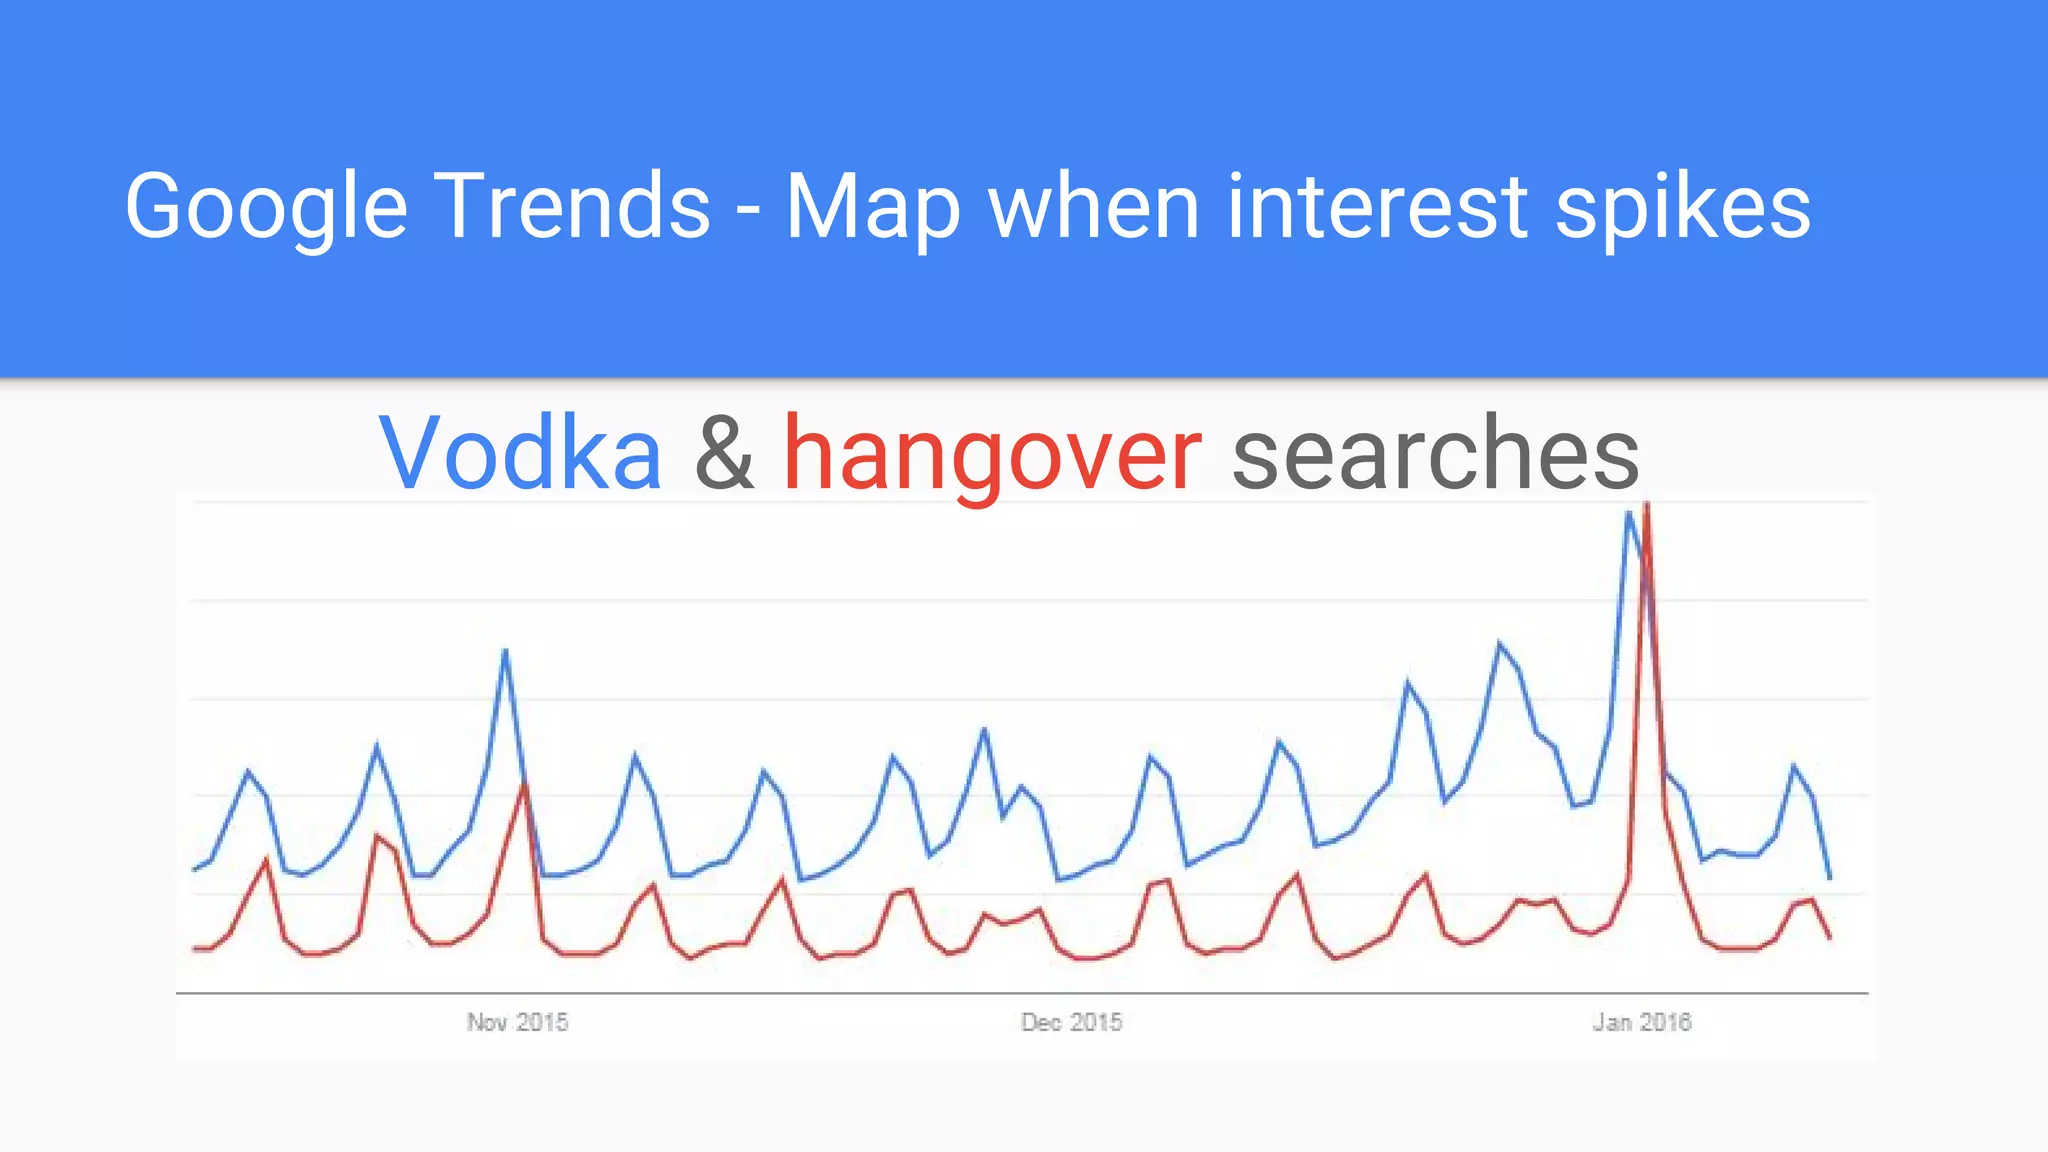
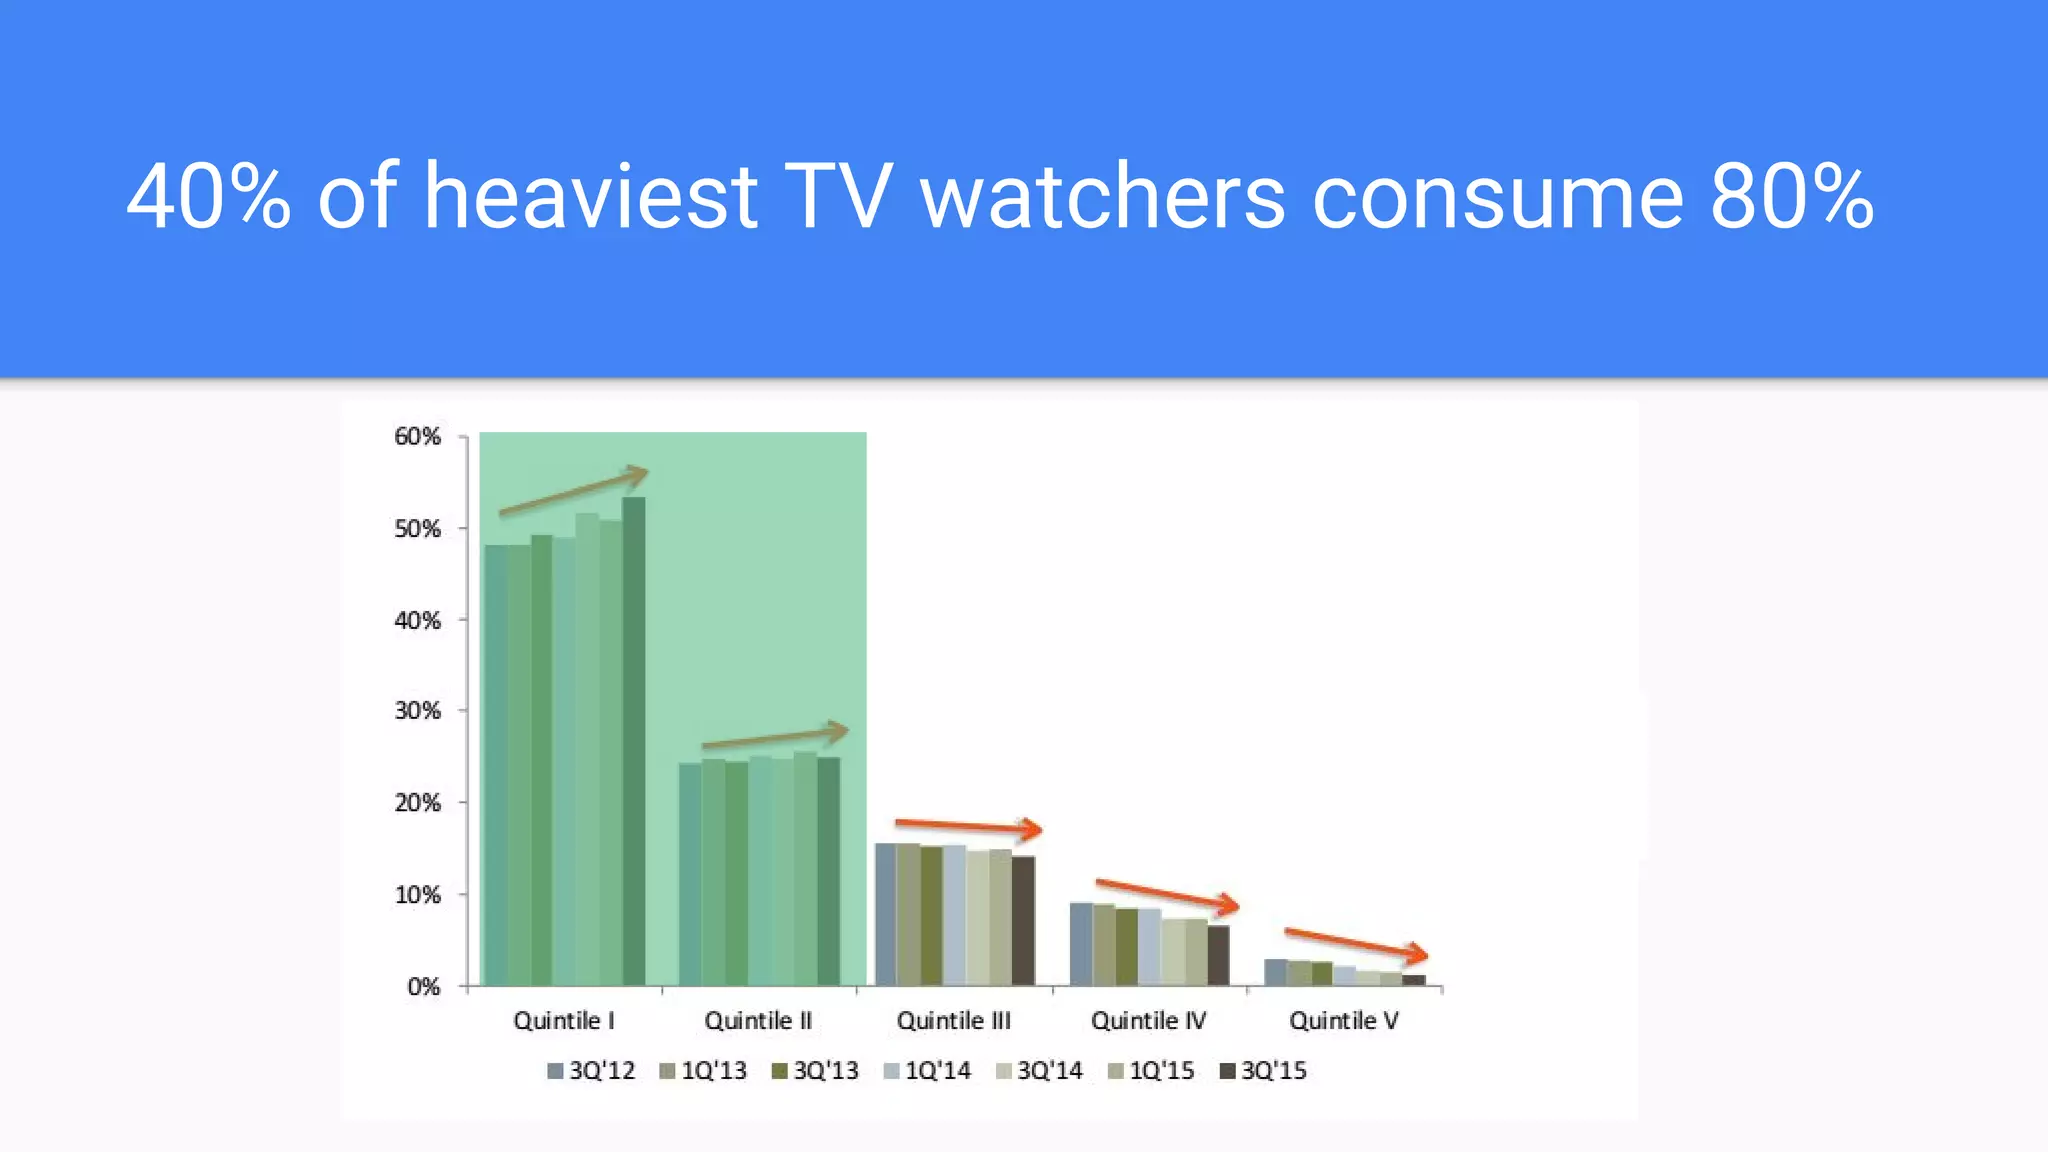
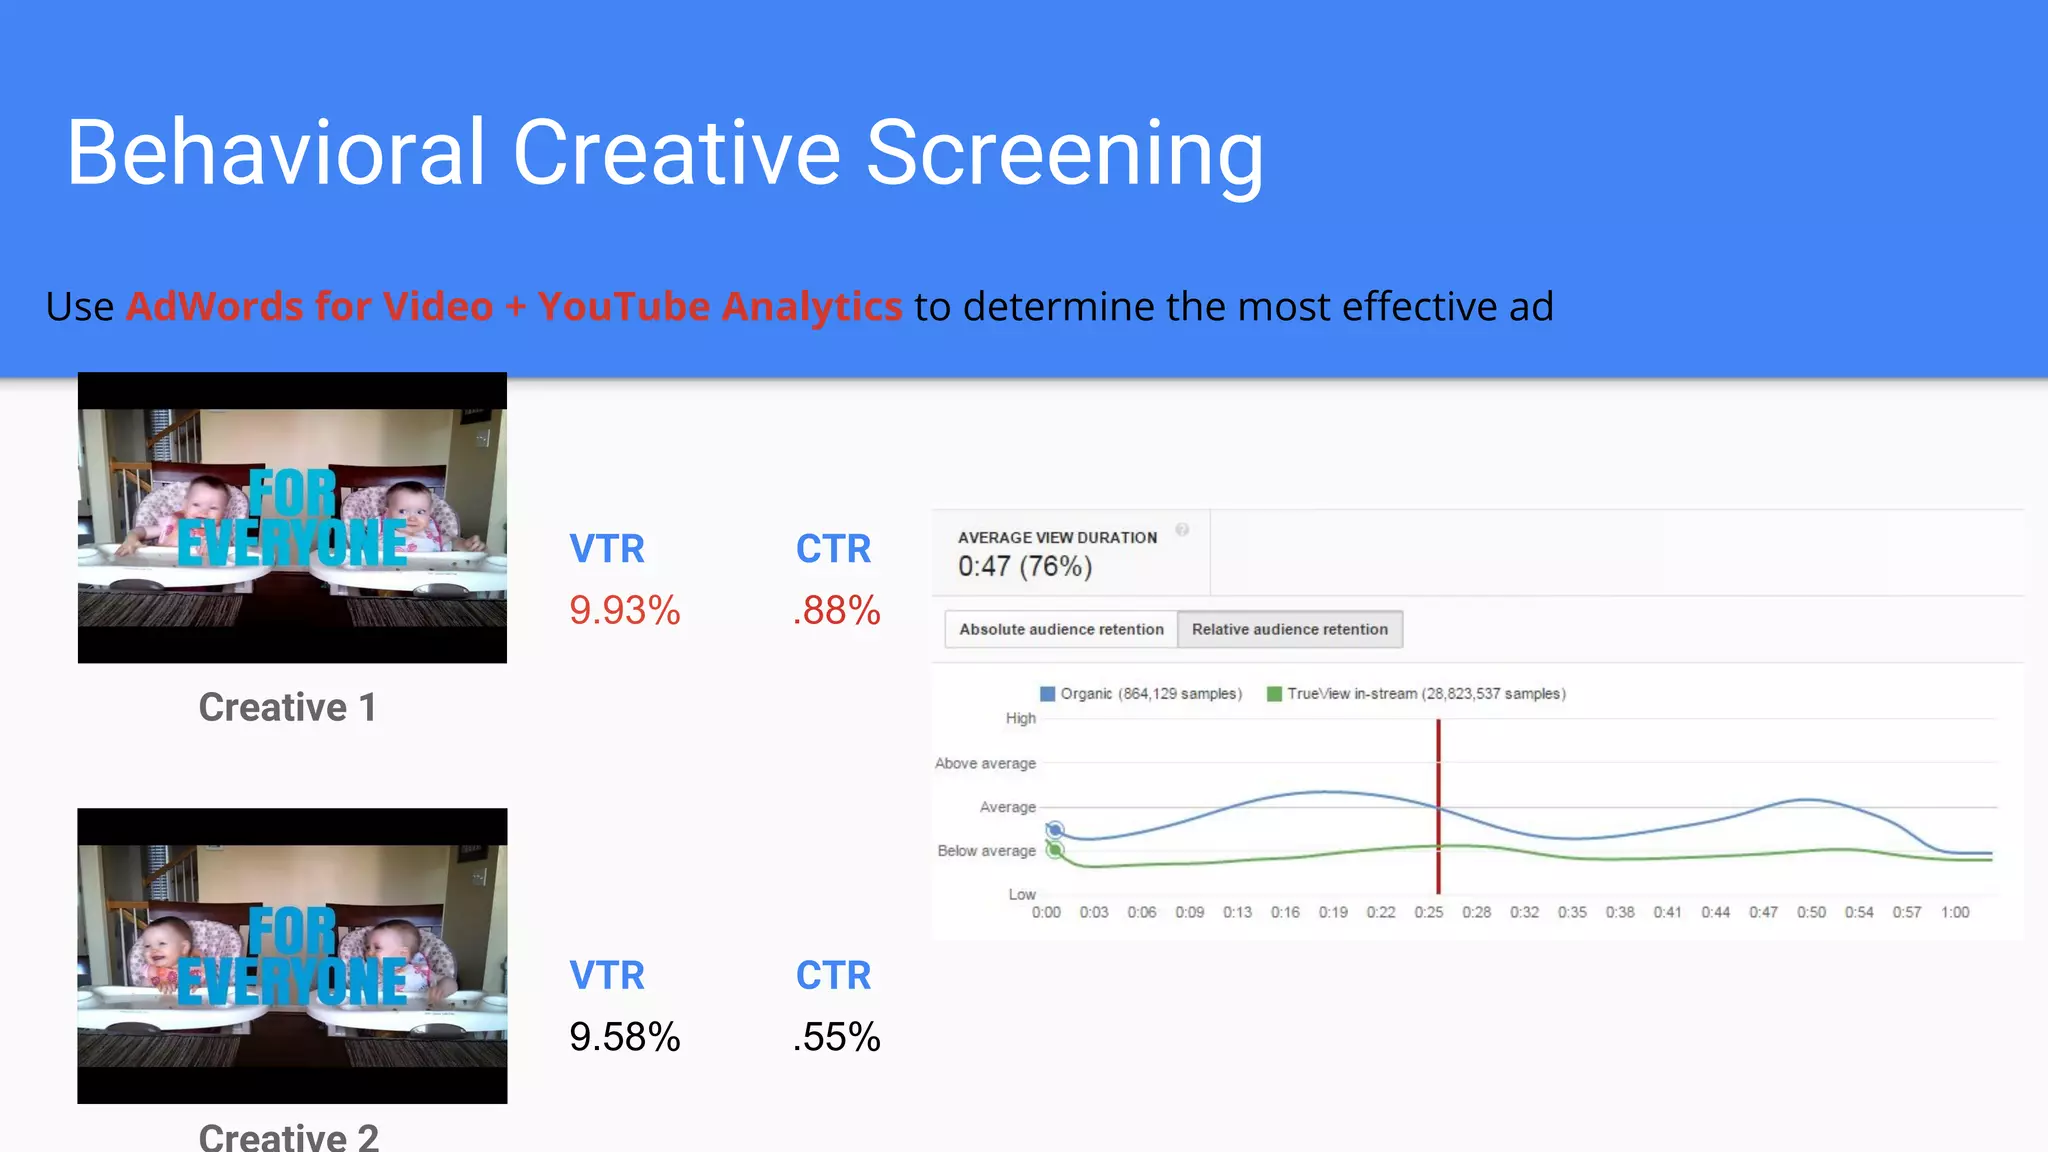
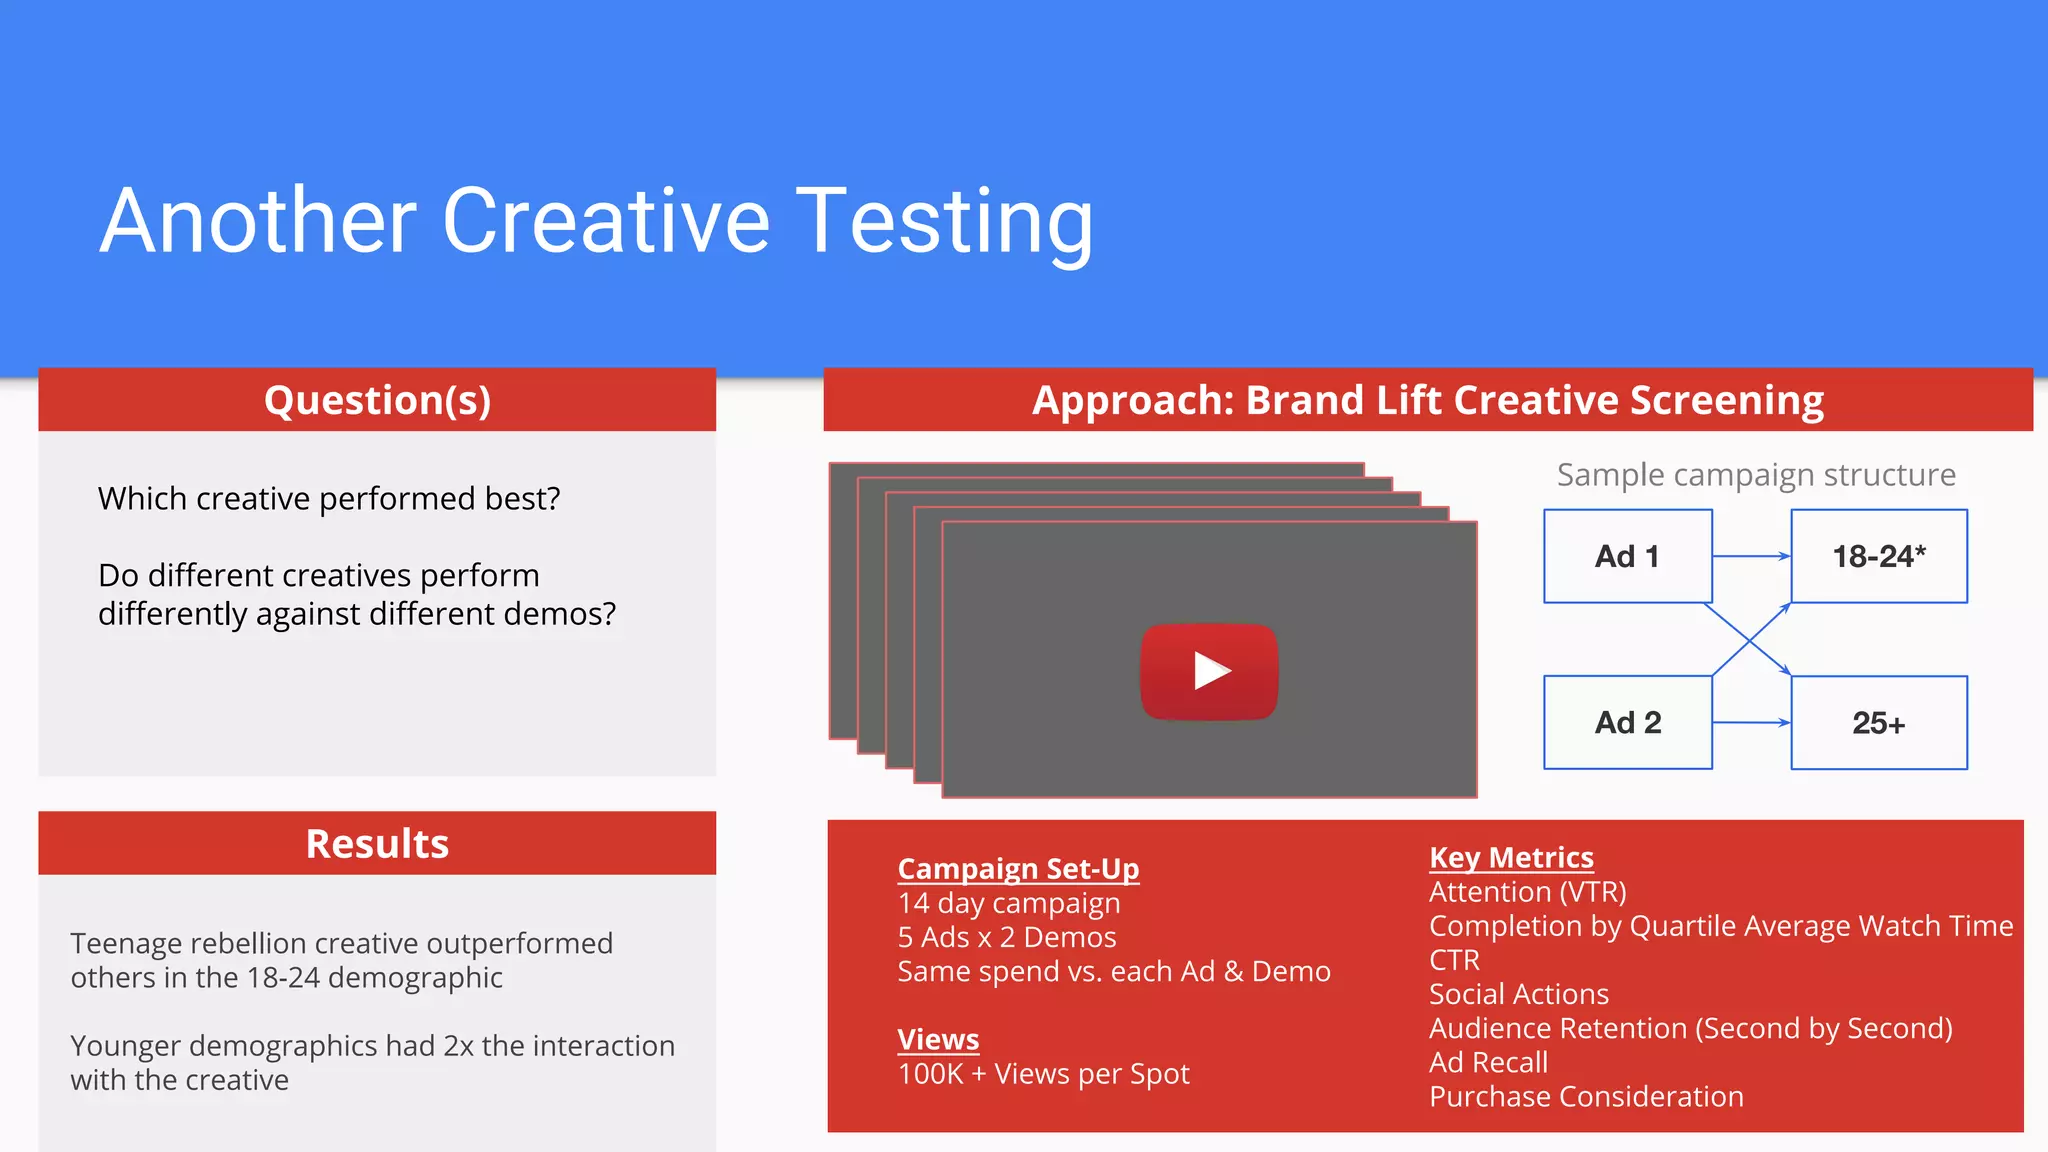
TV to Digital Streaming
How content consumption is changing the way brands invest & interact with people
Who’s this guy?
The only professional picture I have
Current Role
Google: Brand Measurement Lead focusing on
TV+YouTube reach for Large Customer Sales
North America
Previous Roles:
● Google: Analytical Lead - Food Beverage &
Restaurants Vertical
● Zenith Optimedia: Digital Analytics
Supervisor on General Mills
● Mediacom: Search Manager of Analytics
● MediaVest: Print Activation Associate for
Bristol-Myers Squibb
Agenda
● About Me
● Google’s Data
● Media Landscape
● Evolution of Consumer Choice
● Case Studies
● Summary
Let’s Talk About Google: Products with > 1 Billion
Users
Google as a Publisher
Company X
Product Marketing
Promotions Advertising
Traditional
Media
Digital Media
Google
Google as a Data Provider
Company X
Product Marketing
Promotions Advertising
Traditional
Media
Digital Media
Google
Category dynamics
Consumer behavior
Brand perception
Consumer interest
Market testing
Message testing
How do we define an insight?
d data data data data data data data data
data data data data data an insight is a
credible and novel finding tied to a clear so
what data data data data data data data
data data data data data data data data
data data data ata data data data data data
Brand and consumer intersections vary by
opportunity and intent
AWARENESS
Make people SEE
and REMEMBER
your brand
SEE
Examples:
Extra Reach
Viewability
Brand Lift (Upper Funnel)
MEASURE YOUR IMPACT
Brand and consumer intersections vary by
opportunity and intent
THINK
AWARENESS
Get people to
UNDERSTAND and
WANT your brand
Make people SEE
and REMEMBER
your brand
SEE
Examples:
Extra Reach
Viewability
Brand Lift (Upper Funnel)
Examples:
Brand Lift (Lower Funnel)
Google Trends
Google Consumer Surveys
MEASURE YOUR IMPACT
CONSIDERATION
Brand and consumer intersections vary by
opportunity and intent
THINK
AWARENESS
Get people to
UNDERSTAND and
WANT your brand
Make people SEE
and REMEMBER
your brand
SEE DO
Change people’s
BEHAVIOR and get
them to CONVERT
ACTION
Examples:
Extra Reach
Viewability
Brand Lift (Upper Funnel)
Examples:
Brand Lift (Lower Funnel)
Google Trends
Google Consumer Surveys
Examples:
Geo Experiments
Media Attribution
O2S Sales Lift
LOYALTY
Drive people to
CONVERT OFTEN and
ADVOCATE your brand
Examples:
Advanced YT Analytics
Google Analytics (Site)
Customer Lifetime Value
MEASURE YOUR IMPACT
CONSIDERATION
CARE
Google Aligns tools to measure them
Extra Reach
Viewability
Online to
Store
Geo
Experiments
Media
Attribution
Google
Surveys
Google
Analytics
YouTube
Analytics
Customer
Lifetime
Value
Audience
Verification
Brand Lift
More commercial intent, Harder to measureLess commercial intent, Easier to measure
THINKSEE DO CARE
Customer Value
ILLUSTRATIVE
Google Search - An Intent Engine
Autocomplete - How People Feel
Autocomplete - Brand Questions
Autocomplete - Category Questions
Google Trends - Map when interest spikes
Vodka & hangover searches
How do we use this data?
● Inform creative
● Create products
● Test how it drives impact
● Understand regions where people are searching
● See related categories
Case Study: Fiber Fix
https://youtu.be/cHoVh0m95dQ?t=5m31s
Case Study: Fiber Fix
https://www.youtube.com/watch?v=haPvuhznuyI
TV to Streaming
giving users choice
Average Time spent per day by US adults 2011
TV Radio Print Digital Other
2011
0:00
1:00
2:00
3:00
4:00
5:00
6:00
TV Radio Print Digital Other
2011
2015
0:00
1:00
2:00
3:00
4:00
5:00
6:00
Average time spent per day by US adults shifts
Most growth in digital is mobile
TV Radio Print Digital Other
2011
2015
MD+L
D+L
M
0:00
1:00
2:00
3:00
4:00
5:00
6:00
150xper day
3:00
40% of heaviest TV watchers consume 80%
65+ is the only demo increasing TV watchtime
Weekly Time Spent by Demo, Q3 2012-2015
Across Demos YoY
Light TV Viewers are heavy video streamers
GRP Distribution for Adults 18+
Age TV YouTube
18-24 6% 25%
25-34 11% 28%
35-44 15% 22%
45-54 20% 13%
55-64 23% 7%
65+ 26% 5%
Case Studies
Behavioral Creative Screening
Creative 1
VTR CTR
VTR CTR
9.93% .88%
9.58% .55%
Use AdWords for Video + YouTube Analytics to determine the most effective ad
Brand Lift Screening
Creative 1
Use Brandlift + YouTube Analytics to determine the most effective ad
Brand Lift Creative Screening and Insights
Creative 1
Use Brand lift and GCS for contenxt of why an ad was effective of not
Another Creative Testing
Which creative performed best?
Do different creatives perform
differently against different demos?
Question(s)
Results
Teenage rebellion creative outperformed
others in the 18-24 demographic
Younger demographics had 2x the interaction
with the creative
Approach: Brand Lift Creative Screening
Sample campaign structure
Ad 1 18-24*
Ad 2 25+
Campaign Set-Up
14 day campaign
5 Ads x 2 Demos
Same spend vs. each Ad & Demo
Views
100K + Views per Spot
Key Metrics
Attention (VTR)
Completion by Quartile Average Watch Time
CTR
Social Actions
Audience Retention (Second by Second)
Ad Recall
Purchase Consideration
Summary
● Products are becoming diversifying over time
● Media consumption is “as we want it” and what we want
● Testing provides ways advertisers can understand who to
reach, how to reach them and when to reach them

INTEGRATE West Virginia - Jon Lorenzini

  • 1.
    TV to DigitalStreaming How content consumption is changing the way brands invest & interact with people
  • 2.
    Who’s this guy? Theonly professional picture I have Current Role Google: Brand Measurement Lead focusing on TV+YouTube reach for Large Customer Sales North America Previous Roles: ● Google: Analytical Lead - Food Beverage & Restaurants Vertical ● Zenith Optimedia: Digital Analytics Supervisor on General Mills ● Mediacom: Search Manager of Analytics ● MediaVest: Print Activation Associate for Bristol-Myers Squibb
  • 3.
    Agenda ● About Me ●Google’s Data ● Media Landscape ● Evolution of Consumer Choice ● Case Studies ● Summary
  • 4.
    Let’s Talk AboutGoogle: Products with > 1 Billion Users
  • 5.
    Google as aPublisher Company X Product Marketing Promotions Advertising Traditional Media Digital Media Google
  • 6.
    Google as aData Provider Company X Product Marketing Promotions Advertising Traditional Media Digital Media Google Category dynamics Consumer behavior Brand perception Consumer interest Market testing Message testing
  • 7.
    How do wedefine an insight? d data data data data data data data data data data data data data an insight is a credible and novel finding tied to a clear so what data data data data data data data data data data data data data data data data data data ata data data data data data
  • 8.
    Brand and consumerintersections vary by opportunity and intent AWARENESS Make people SEE and REMEMBER your brand SEE Examples: Extra Reach Viewability Brand Lift (Upper Funnel) MEASURE YOUR IMPACT
  • 9.
    Brand and consumerintersections vary by opportunity and intent THINK AWARENESS Get people to UNDERSTAND and WANT your brand Make people SEE and REMEMBER your brand SEE Examples: Extra Reach Viewability Brand Lift (Upper Funnel) Examples: Brand Lift (Lower Funnel) Google Trends Google Consumer Surveys MEASURE YOUR IMPACT CONSIDERATION
  • 10.
    Brand and consumerintersections vary by opportunity and intent THINK AWARENESS Get people to UNDERSTAND and WANT your brand Make people SEE and REMEMBER your brand SEE DO Change people’s BEHAVIOR and get them to CONVERT ACTION Examples: Extra Reach Viewability Brand Lift (Upper Funnel) Examples: Brand Lift (Lower Funnel) Google Trends Google Consumer Surveys Examples: Geo Experiments Media Attribution O2S Sales Lift MEASURE YOUR IMPACT CONSIDERATION
  • 11.
    Brand and consumerintersections vary by opportunity and intent THINK AWARENESS Get people to UNDERSTAND and WANT your brand Make people SEE and REMEMBER your brand SEE DO Change people’s BEHAVIOR and get them to CONVERT ACTION Examples: Extra Reach Viewability Brand Lift (Upper Funnel) Examples: Brand Lift (Lower Funnel) Google Trends Google Consumer Surveys Examples: Geo Experiments Media Attribution O2S Sales Lift LOYALTY Drive people to CONVERT OFTEN and ADVOCATE your brand Examples: Advanced YT Analytics Google Analytics (Site) Customer Lifetime Value MEASURE YOUR IMPACT CONSIDERATION CARE
  • 12.
    Google Aligns toolsto measure them Extra Reach Viewability Online to Store Geo Experiments Media Attribution Google Surveys Google Analytics YouTube Analytics Customer Lifetime Value Audience Verification Brand Lift More commercial intent, Harder to measureLess commercial intent, Easier to measure THINKSEE DO CARE Customer Value ILLUSTRATIVE
  • 13.
    Google Search -An Intent Engine
  • 14.
    Autocomplete - HowPeople Feel
  • 15.
    Autocomplete - HowPeople Feel
  • 16.
  • 17.
  • 18.
    Google Trends -Map when interest spikes
  • 19.
    Google Trends -Map when interest spikes Vodka & hangover searches
  • 21.
    How do weuse this data? ● Inform creative ● Create products ● Test how it drives impact ● Understand regions where people are searching ● See related categories
  • 22.
  • 23.
  • 24.
  • 25.
  • 26.
  • 27.
  • 32.
  • 33.
    Average Time spentper day by US adults 2011 TV Radio Print Digital Other 2011 0:00 1:00 2:00 3:00 4:00 5:00 6:00
  • 34.
    TV Radio PrintDigital Other 2011 2015 0:00 1:00 2:00 3:00 4:00 5:00 6:00 Average time spent per day by US adults shifts
  • 35.
    Most growth indigital is mobile TV Radio Print Digital Other 2011 2015 MD+L D+L M 0:00 1:00 2:00 3:00 4:00 5:00 6:00 150xper day 3:00
  • 36.
    40% of heaviestTV watchers consume 80%
  • 37.
    65+ is theonly demo increasing TV watchtime Weekly Time Spent by Demo, Q3 2012-2015
  • 38.
  • 39.
    Light TV Viewersare heavy video streamers
  • 40.
    GRP Distribution forAdults 18+ Age TV YouTube 18-24 6% 25% 25-34 11% 28% 35-44 15% 22% 45-54 20% 13% 55-64 23% 7% 65+ 26% 5%
  • 41.
  • 42.
    Behavioral Creative Screening Creative1 VTR CTR VTR CTR 9.93% .88% 9.58% .55% Use AdWords for Video + YouTube Analytics to determine the most effective ad
  • 43.
    Brand Lift Screening Creative1 Use Brandlift + YouTube Analytics to determine the most effective ad
  • 44.
    Brand Lift CreativeScreening and Insights Creative 1 Use Brand lift and GCS for contenxt of why an ad was effective of not
  • 45.
    Another Creative Testing Whichcreative performed best? Do different creatives perform differently against different demos? Question(s) Results Teenage rebellion creative outperformed others in the 18-24 demographic Younger demographics had 2x the interaction with the creative Approach: Brand Lift Creative Screening Sample campaign structure Ad 1 18-24* Ad 2 25+ Campaign Set-Up 14 day campaign 5 Ads x 2 Demos Same spend vs. each Ad & Demo Views 100K + Views per Spot Key Metrics Attention (VTR) Completion by Quartile Average Watch Time CTR Social Actions Audience Retention (Second by Second) Ad Recall Purchase Consideration
  • 46.
    Summary ● Products arebecoming diversifying over time ● Media consumption is “as we want it” and what we want ● Testing provides ways advertisers can understand who to reach, how to reach them and when to reach them