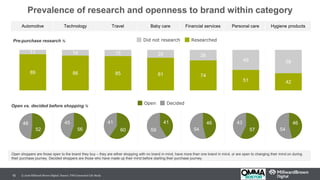
Download to read offline


![Are we ready? Behavioral data will only become more important
© 2016 Millward Brown Digital. Source: Millward Brown Digital’s Getting Digital Right 2016.34
90% Yes! [0% No!]
B2B
51% 39% 10%
Expected importance of passively collected online
behavioral data in the next 3 years
Significantly increase Somewhat increase Stay the same Somewhat decrease Significantly decrease](https://image.slidesharecdn.com/1604mbdmerrihewlommabostonmarketingpresentation-v4a-160426135815/85/Making-Marketing-Remarkable-34-320.jpg)
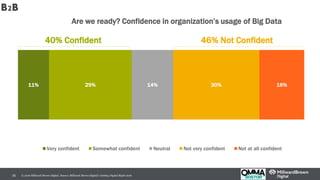

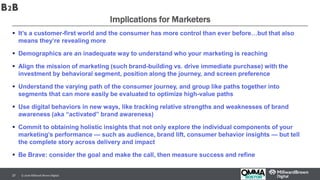


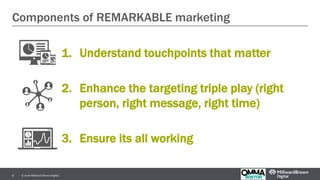
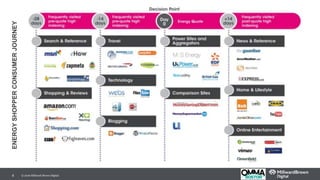
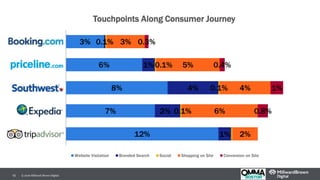
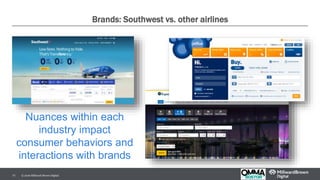
The document discusses how marketing is evolving to better understand consumer behavior through digital touchpoints. It emphasizes enhancing targeting by understanding the consumer journey across different devices and platforms. Data from various online behaviors can provide insights to improve targeting and measure marketing effectiveness. While behavioral data will grow in importance, many marketers still lack confidence in their ability to leverage it.


