Downloaded 19 times


![XX
2007 2014 2017 2018 2021
[Acquisition]
[Acquisition]
[Merger]
The future
Digital
Consumer
Intelligence
[Acquired by]
Social Suite
+
The Evolution of Brandwatch.](https://image.slidesharecdn.com/bwfalconwebinarcombined1-210722161326/85/Social-Media-Data-Has-Entered-the-Chat-36-320.jpg)


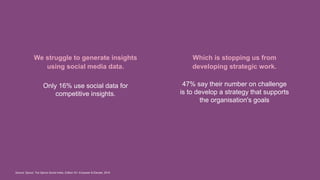
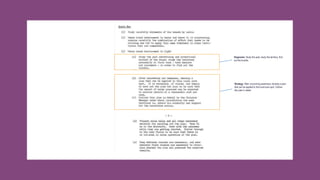
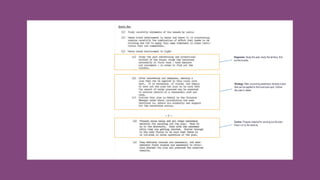
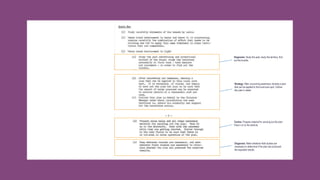
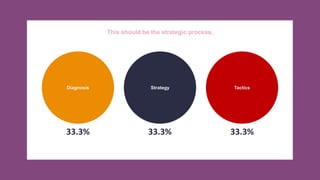
The document discusses the challenges social media managers face in utilizing data effectively to inform strategy and gain insights, highlighting that only a small percentage leverage social data for competitive insight. It emphasizes the importance of diagnosing issues and aligning strategies with organizational goals by properly measuring KPIs and understanding audience sentiment. The document also covers the need for strategic planning in market engagement, advocating for data-driven decision-making to enhance brand management and crisis response.