Download to read offline


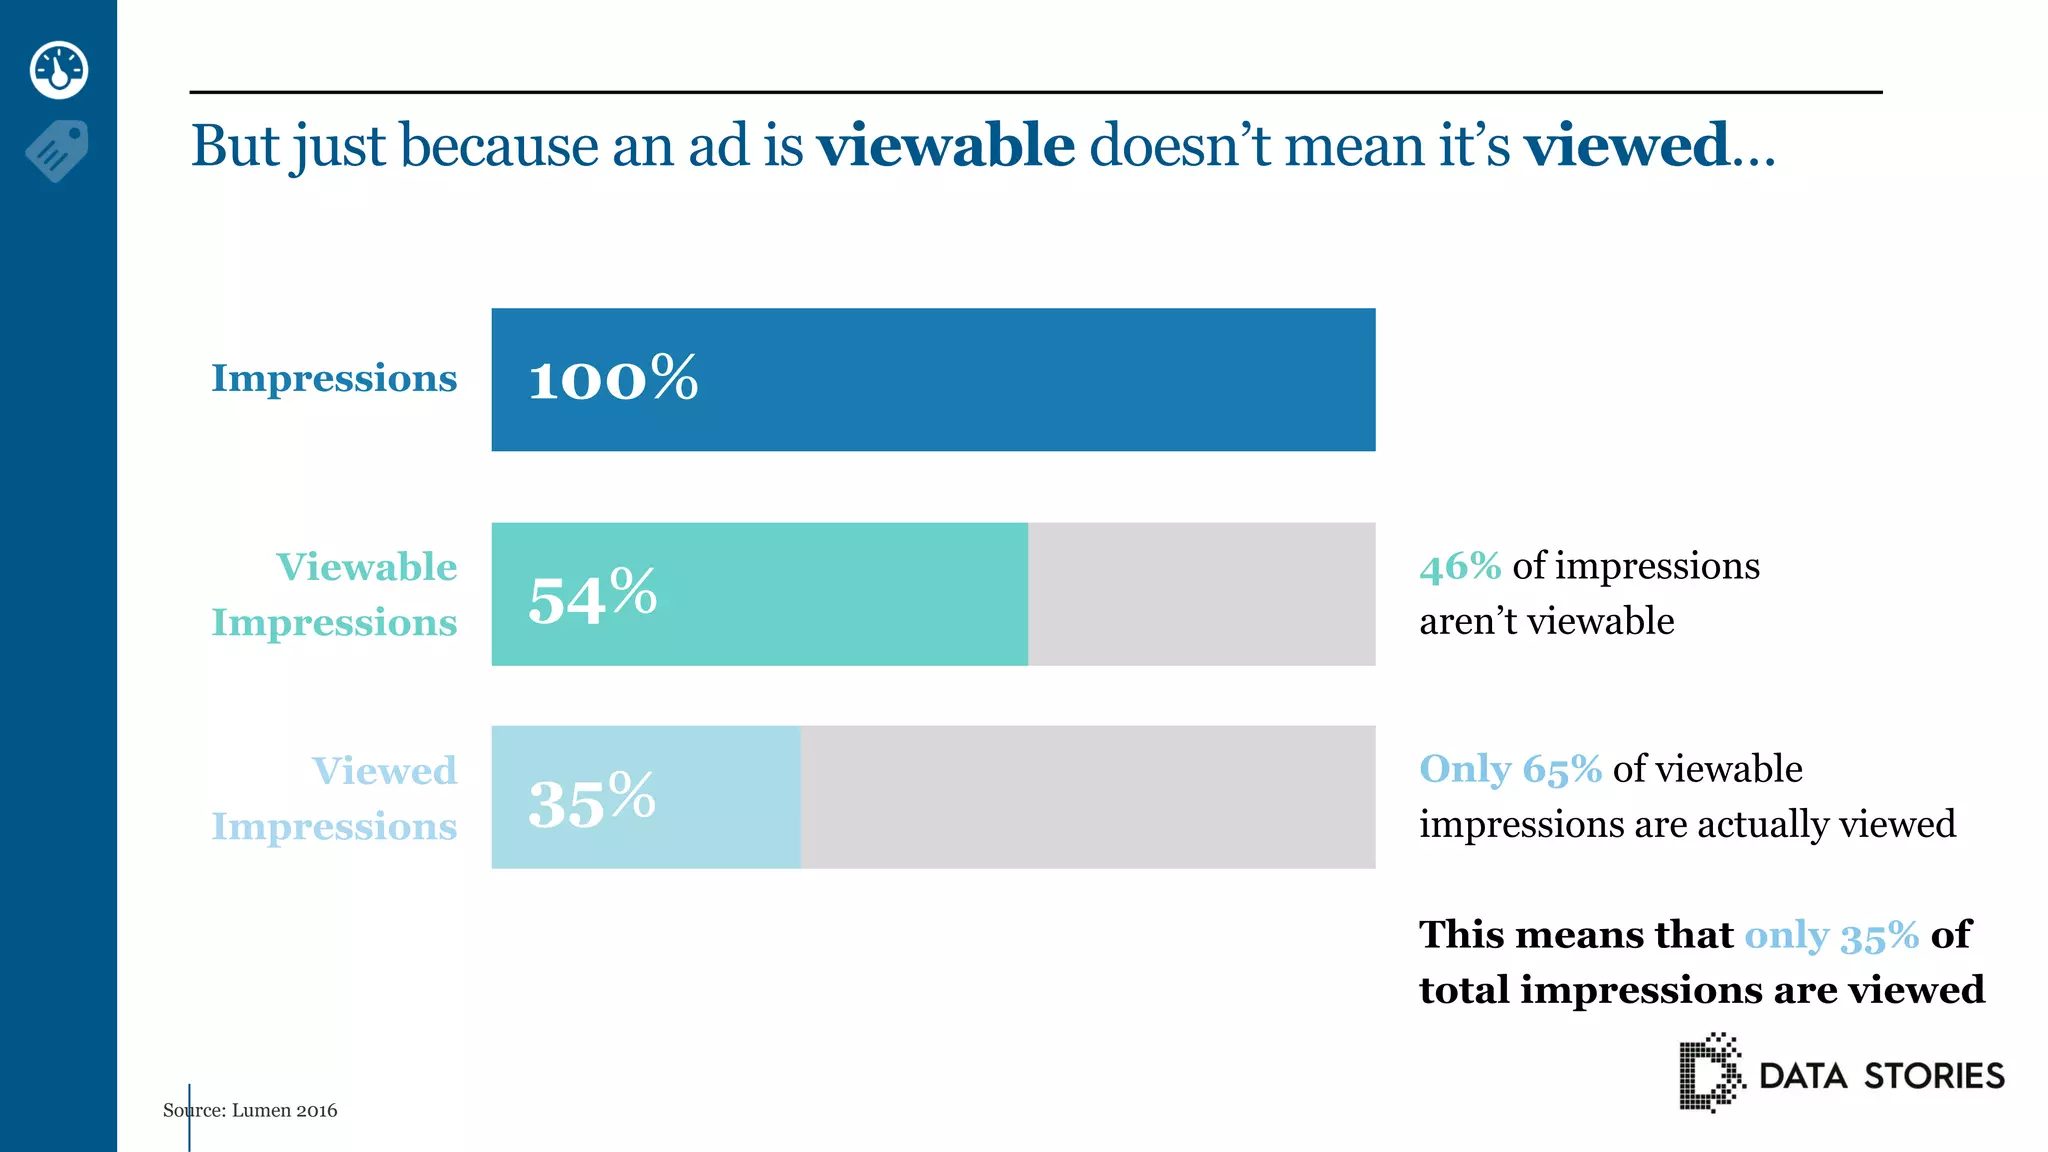
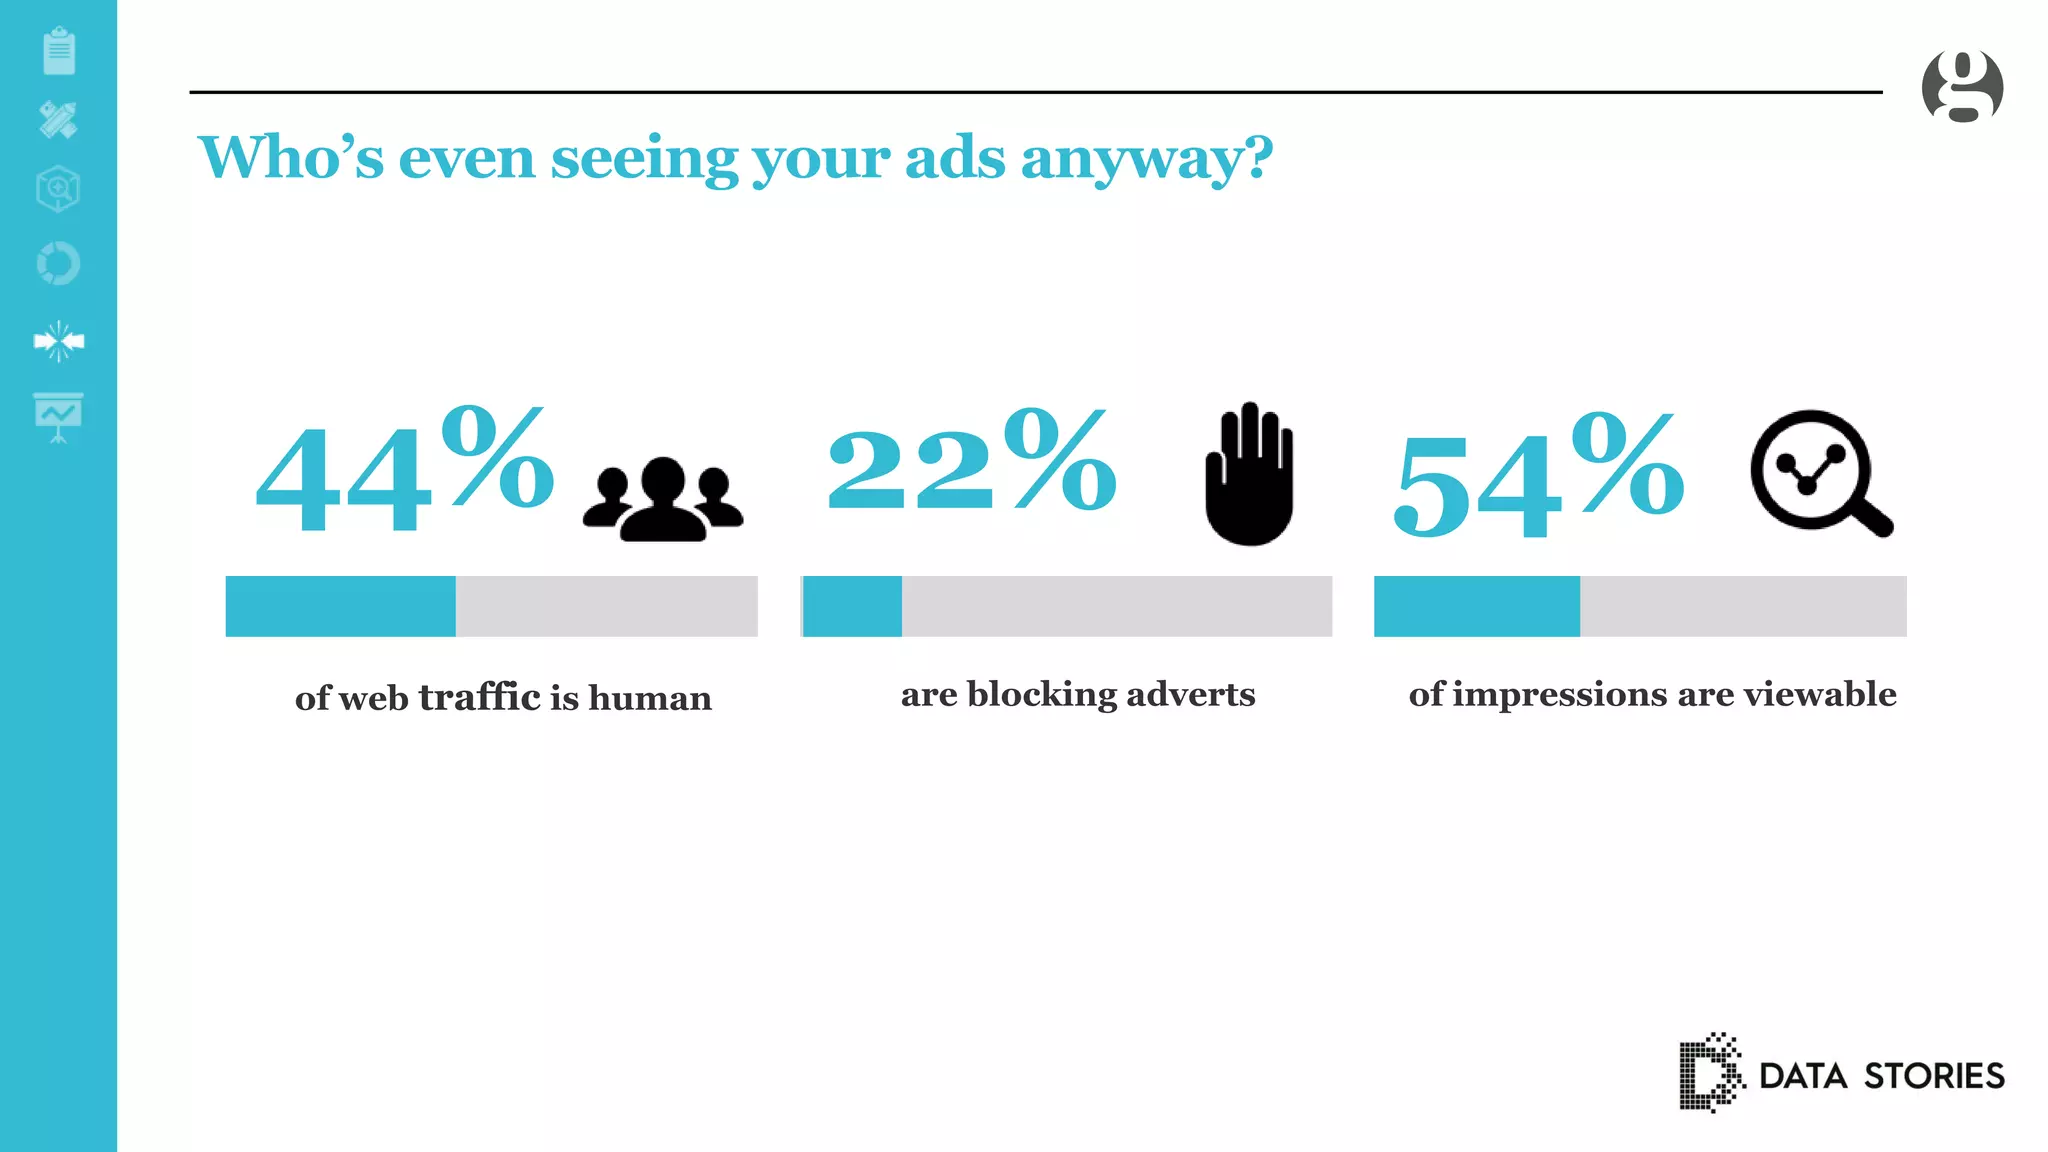
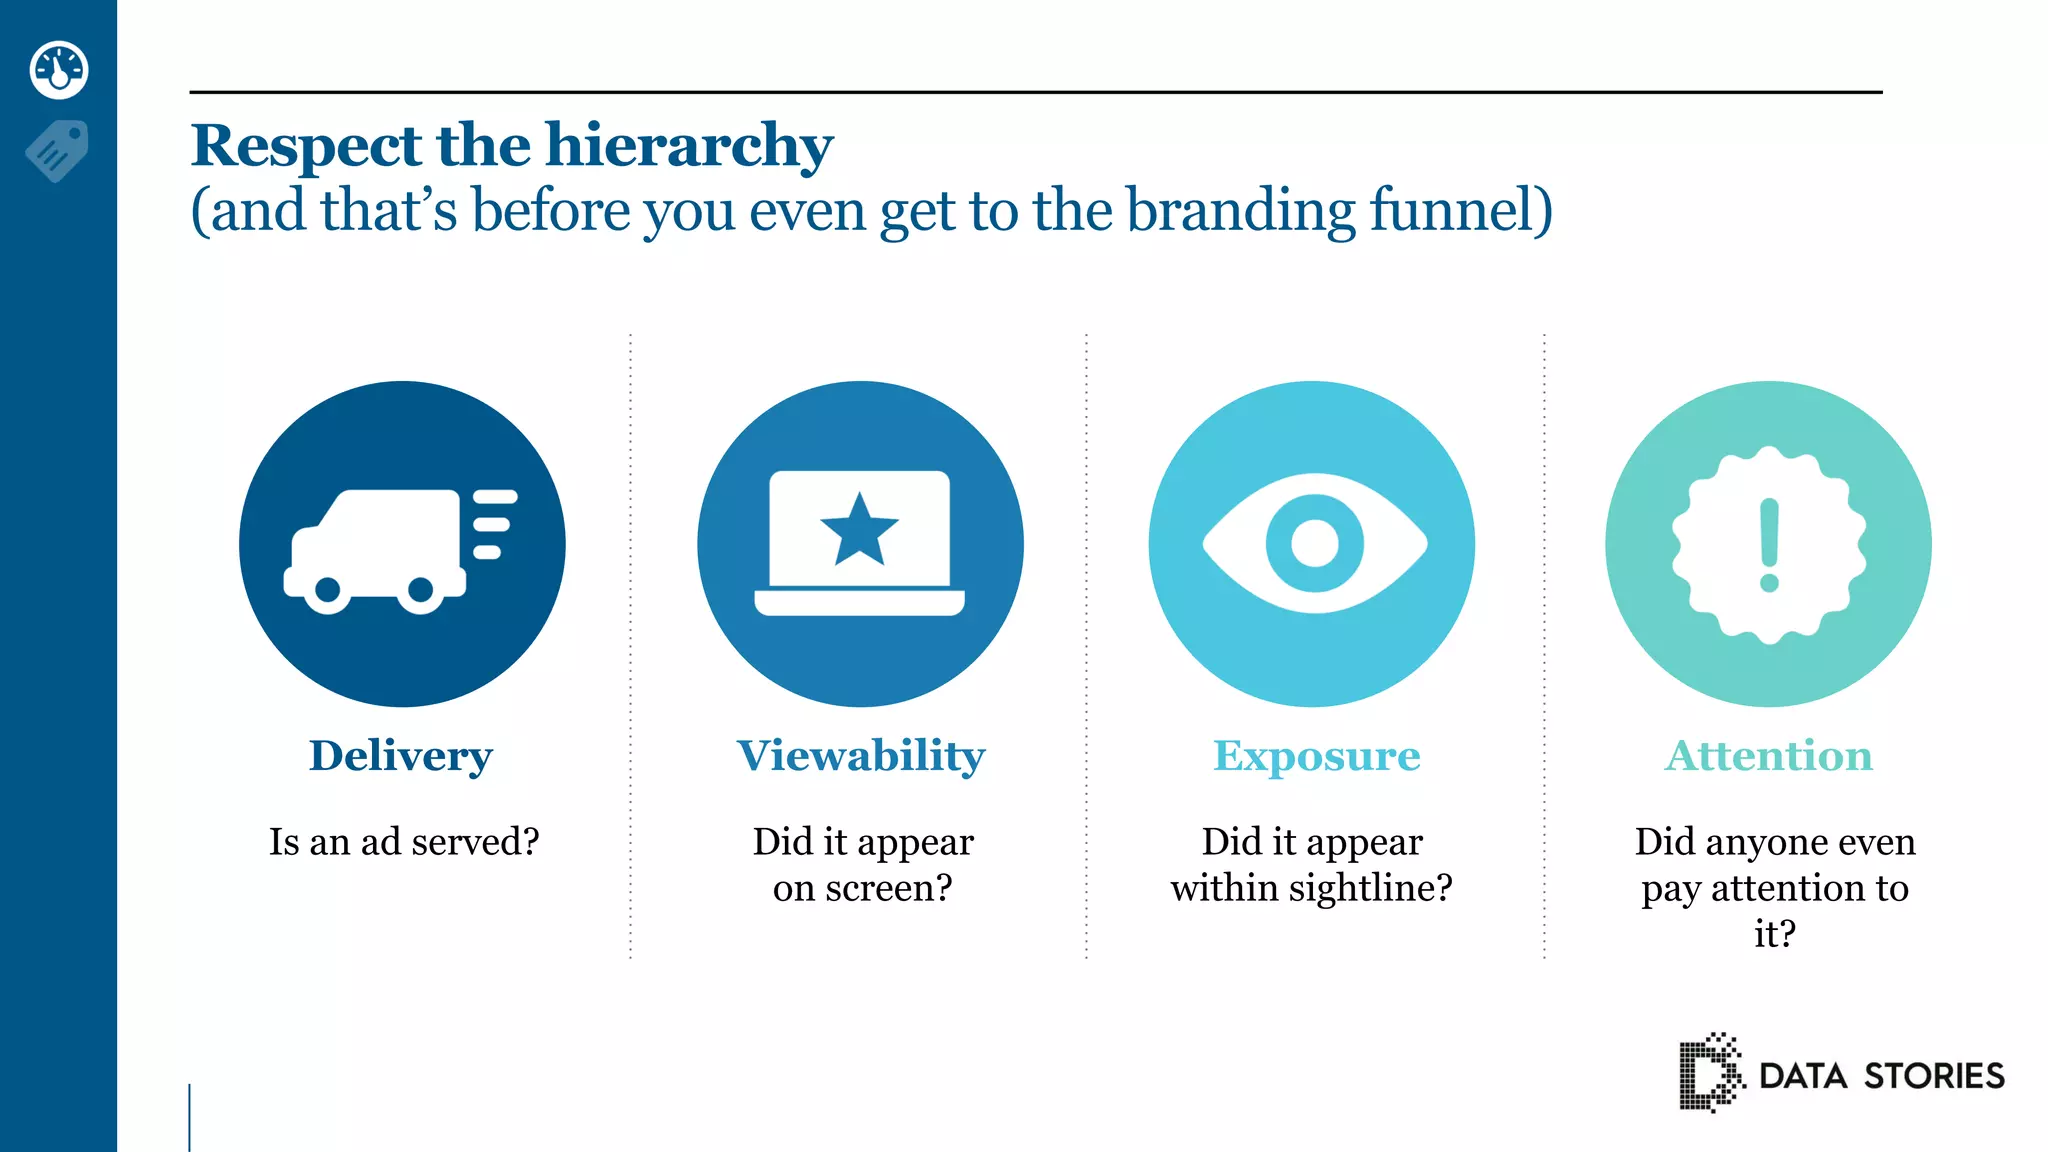
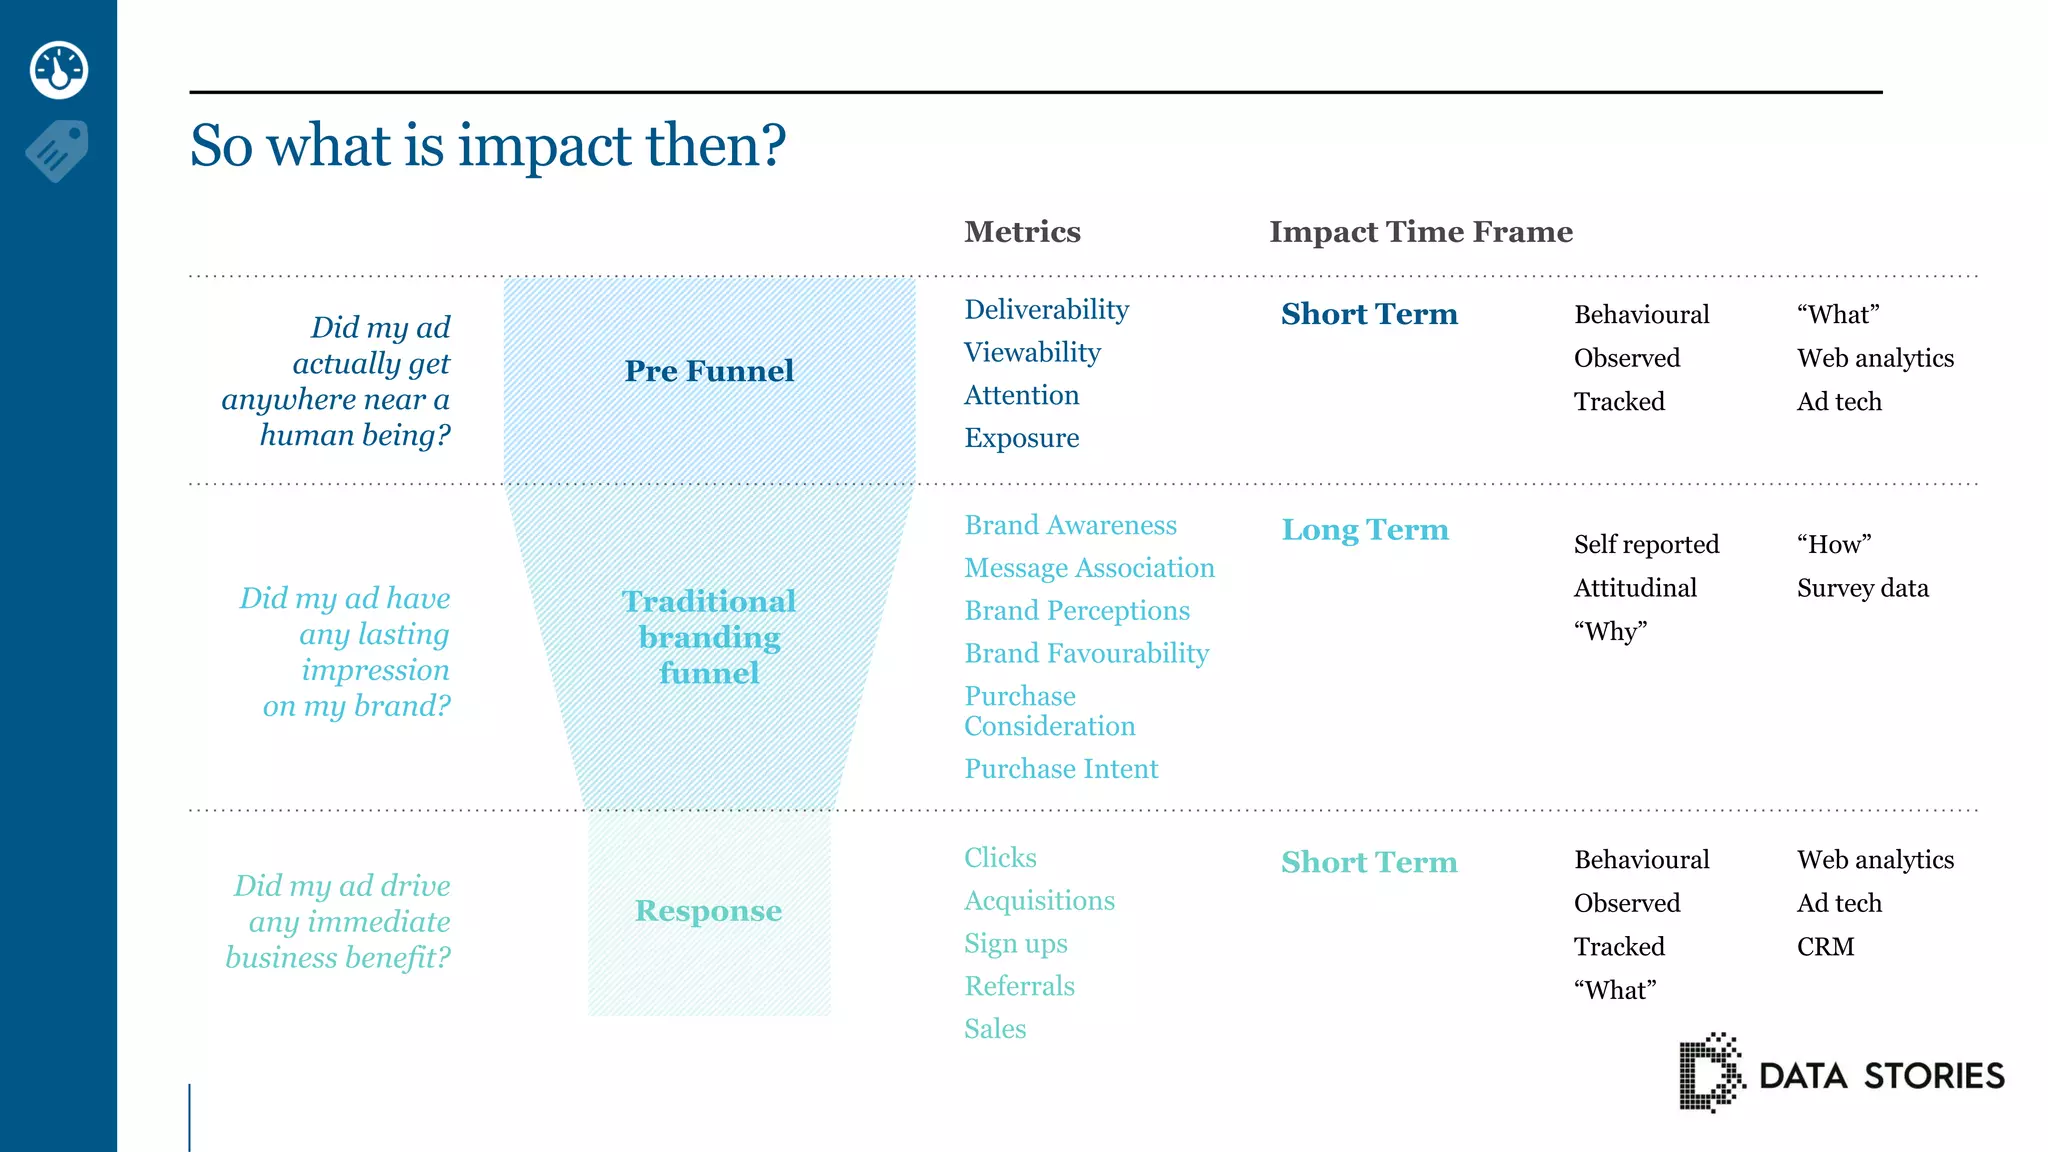
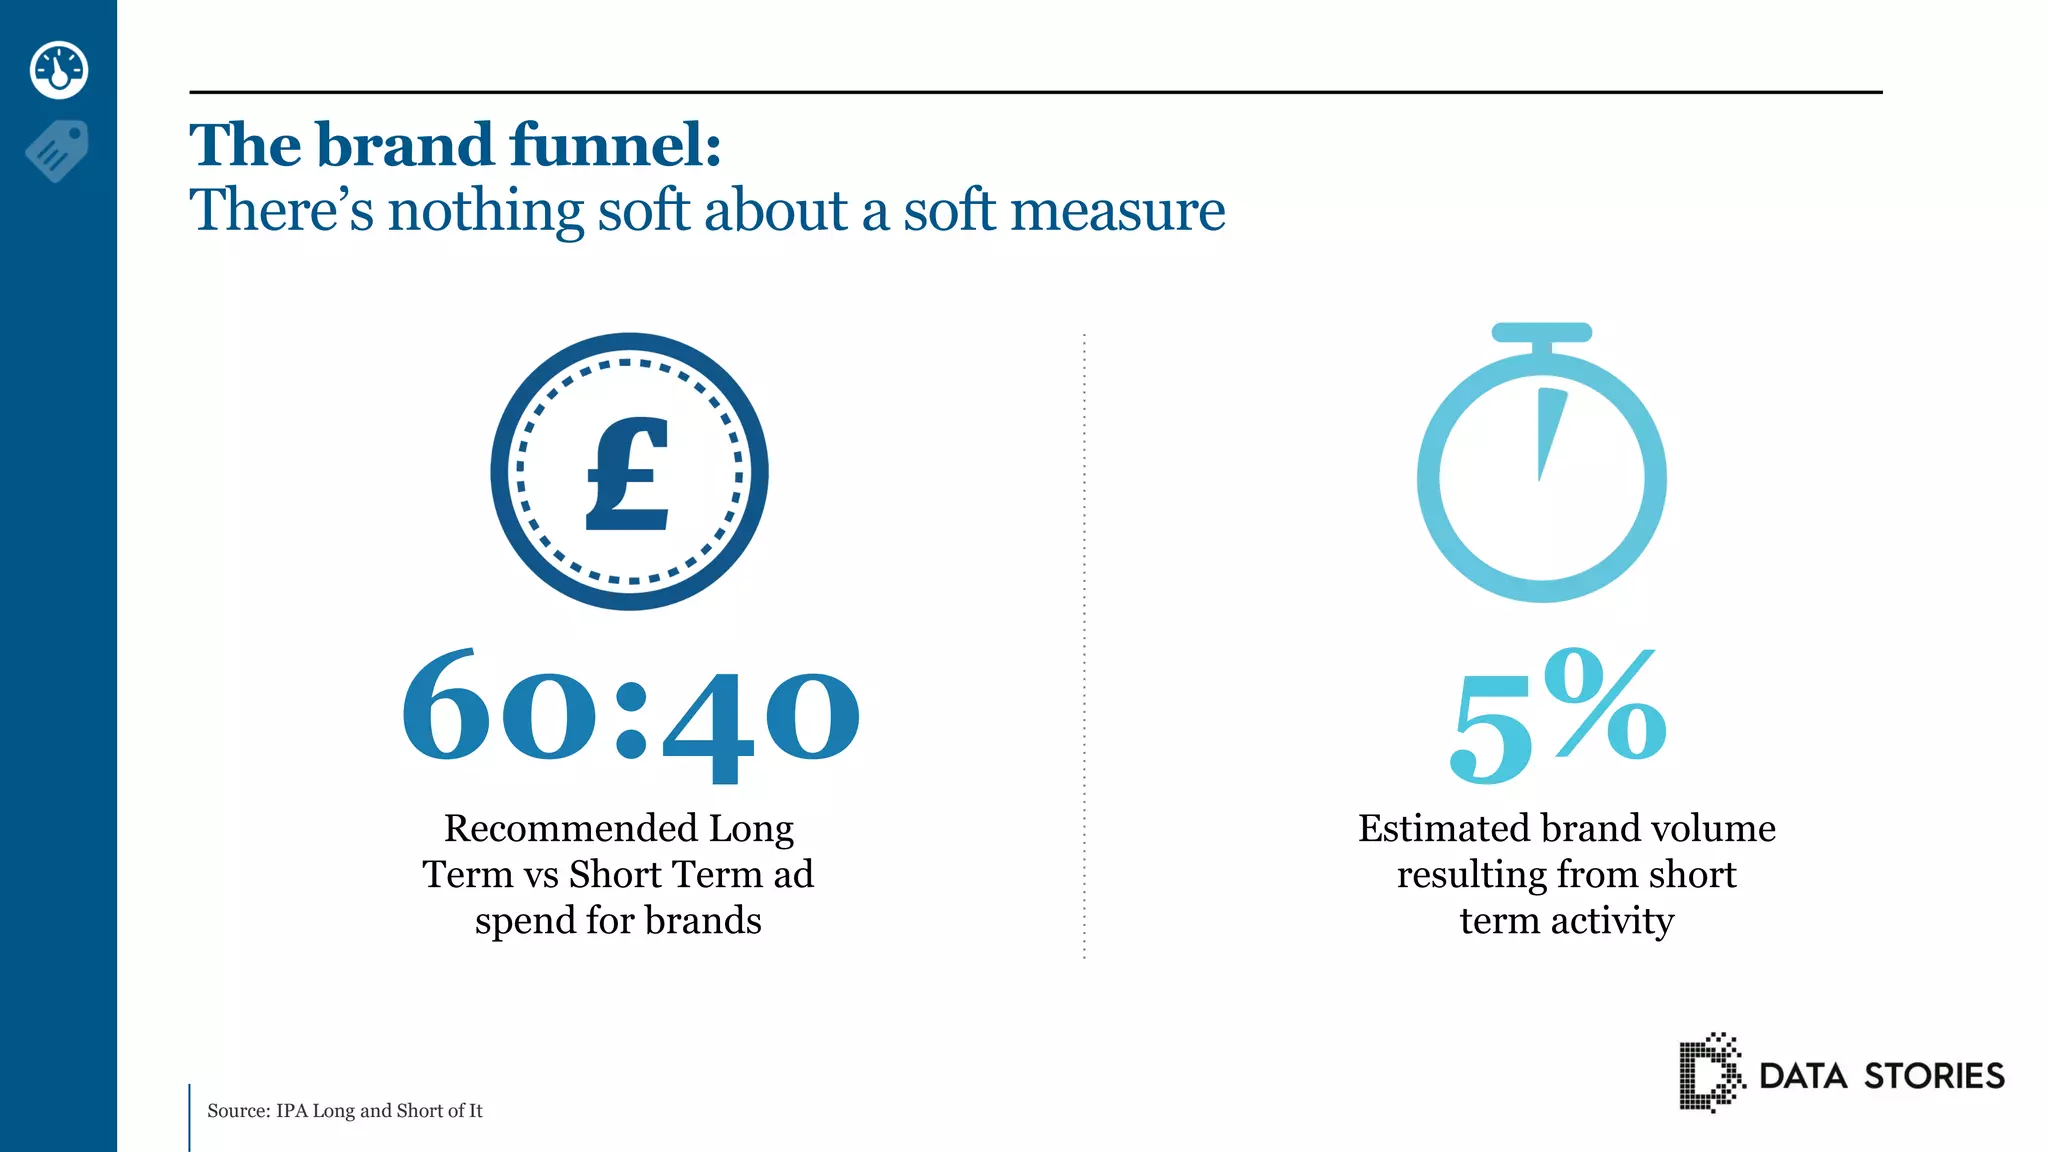
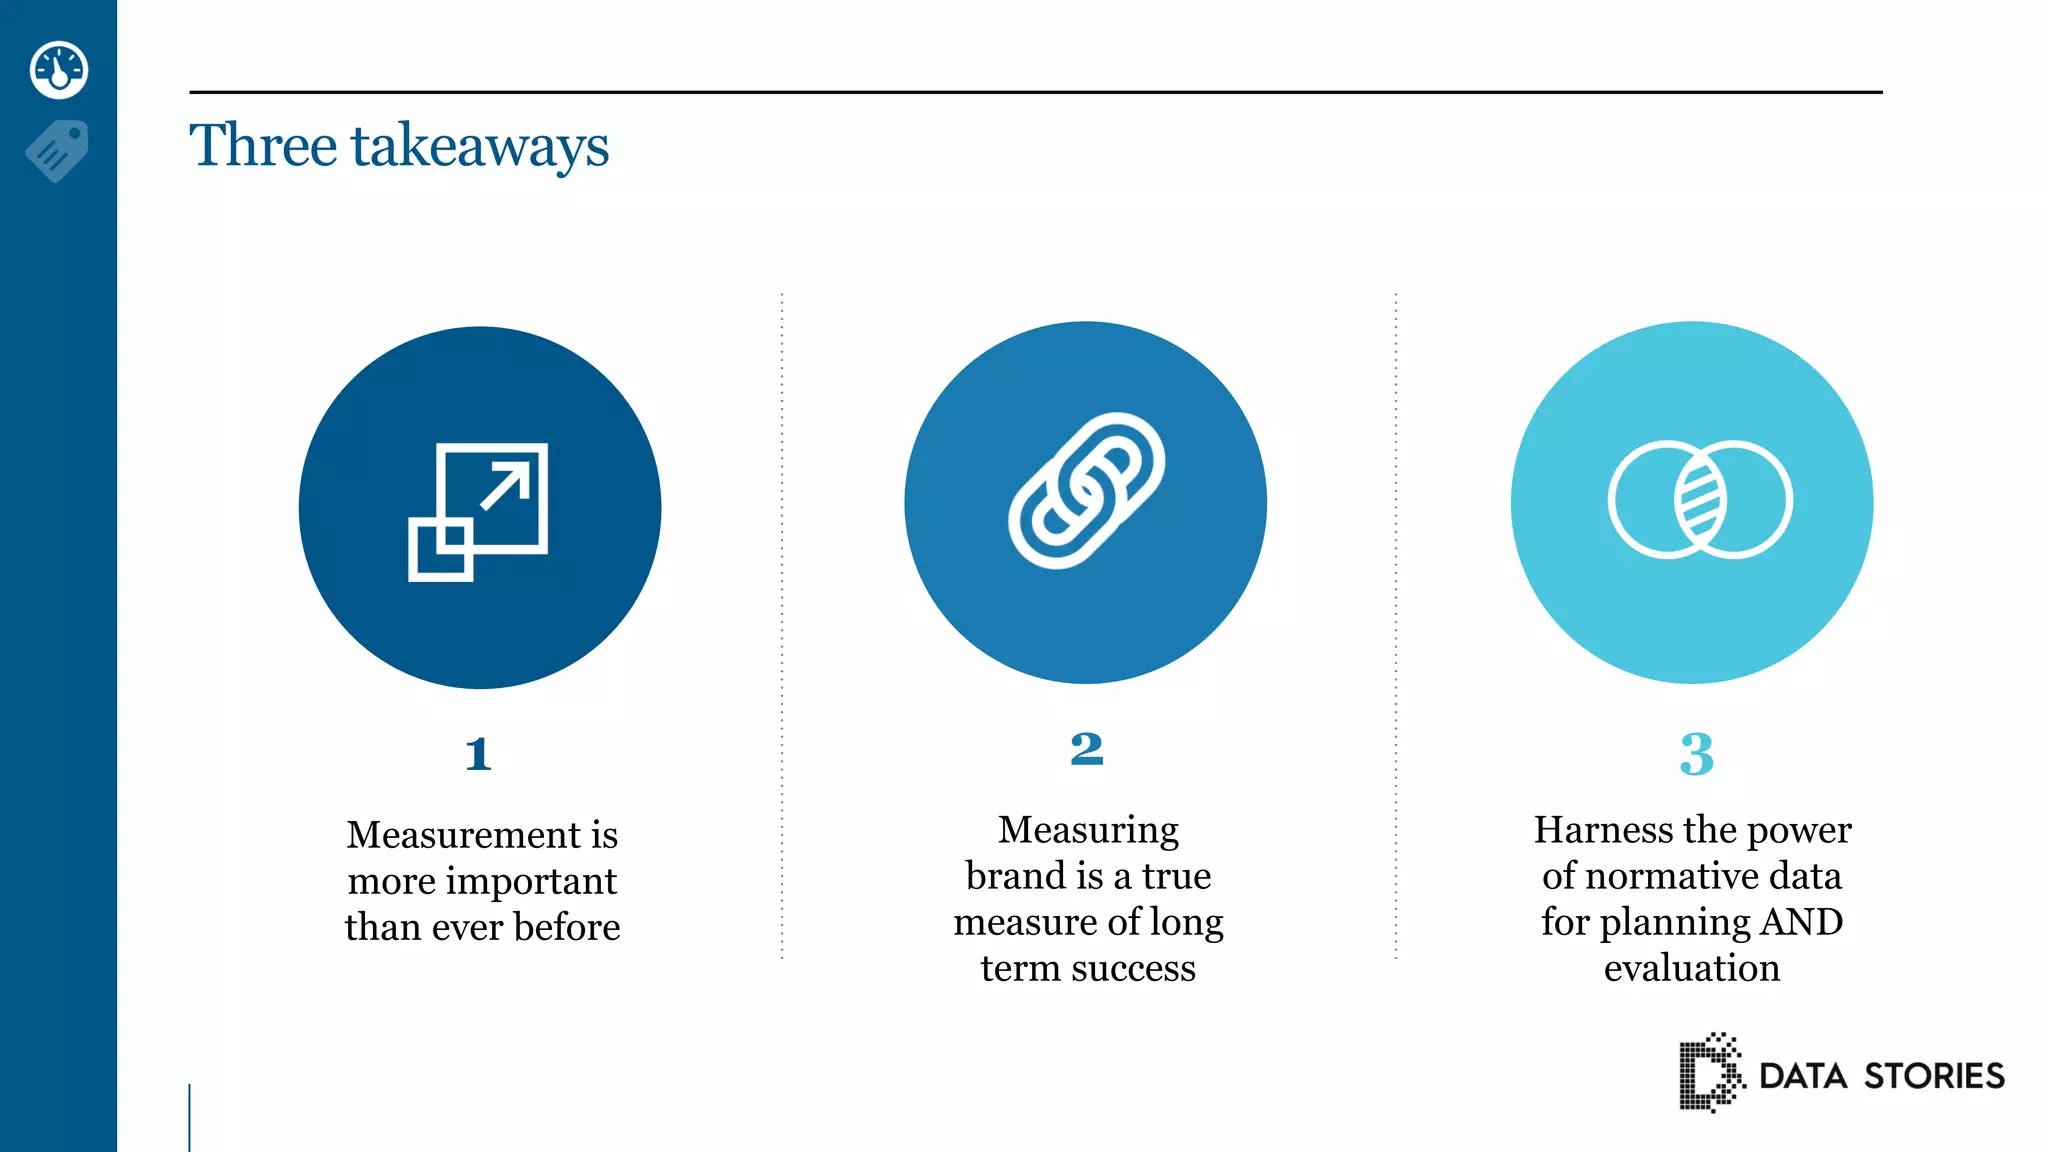


The document discusses the importance of measuring the effectiveness of mobile advertising, highlighting that only a fraction of impressions are actually viewed despite being considered viewable. It emphasizes the need for a multi-dimensional approach to understanding ad impact, including deliverability, attention, and branding metrics. Lastly, it recommends balancing short-term and long-term ad spend for optimal brand success.


