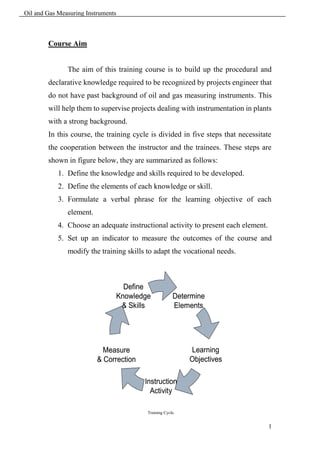
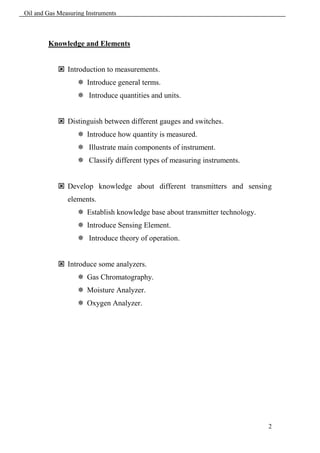
The document discusses the aim of an oil and gas measuring instruments training course. The course aims to develop the procedural and declarative knowledge required for projects engineers without a background in oil and gas instrumentation. The training cycle is divided into 5 steps: 1) define required knowledge and skills, 2) determine elements, 3) formulate learning objectives, 4) choose instructional activities, 5) set indicators and modify training. The document outlines topics to be covered including introductions to measurements, transmitters, mechanical and electrical transducers, flowmeters, and analyzers.
This document introduces industrial instrumentation and provides examples. It defines instrumentation as automated measurement and control that is used in research, industry and everyday life. It then lists common process variables that are measured through instrumentation like pressure, flow rate, temperature and lists common control devices. The rest of the document defines key instrumentation terms and provides two examples - a boiler water level control system using pneumatic signals and a wastewater disinfection system using electronic signals.
This document provides information about a course on Instrumentation and Process Control taught at Acharya N.G. Ranga Agricultural University. The course aims to impart knowledge of instrumentation and process controls used in the food industry. It covers topics such as measurement principles and methods, different types of instruments, transducers, performance characteristics, and control systems. The course involves both theory lectures and practical exercises where students will learn to use and identify various instruments used in food industry operations.
CHAPTER ONE: Introduction to Instrumentation and Measurement.pptxArba Minch University
This document incorporates the basics about instrumentation and measure and static and dynamic performance characteristics of instruments. Also contains statistical analysis of measurements and discuss noise and interference. Types of errors and types of noise also discussed in this document.
An instrument may be defined as a machine or system which is designed to maintain functional relationship between prescribed properties of physical variables & could include means of communication to human observer
The document discusses the role of control and instrumentation (C&I) in modern process industries. It notes that C&I is responsible for smoothly operating, controlling, and maintaining process parameters through various instruments. It then lists common process variables that are measured, such as pressure, flow, temperature and level. C&I allows for efficient, economic, safe and pollution-controlled plant operation through measurement, control, monitoring and protection functions. Advanced instrumentation and automation techniques are used to maximize productivity while maintaining quality.
This document provides an introduction to process control instrumentation and techniques. It is split into multiple units covering key topics like pressure, level, temperature, and flow measurements. The objectives are to understand the four main process variables that are measured and controlled, know what a process instrument is and how it functions, and gain an understanding of different instrument types and their applications in process control systems. Basic definitions of instrumentation terms are also provided to establish a common vocabulary.
Este documento describe varios métodos para medir el nivel y volumen de fluidos en contenedores. Explica que los sensores deben elegirse según factores como si se requiere control remoto, el tiempo de respuesta deseado, y si puede haber contacto con el material. Luego describe métodos como mirillas, flotadores, sondas capacitivas, presión, microondas y ultrasonido que pueden medir rango completo. También cubre métodos de corto alcance como magnéticos, conductividad e infrarrojos. Finalmente, menciona otros mé
The document provides information on commissioning a control valve positioner for a power plant project. It includes specifications for the positioner, diagrams of how it controls air flow to open and close the valve, instructions for calibrating it by connecting a 4-20mA source and using a communicator to perform auto or manual calibration, and descriptions of its manual operation, limit switches, and alarms.
El documento describe un sistema de transporte de material que incluye áreas de carga,
mantenimiento y descarga. La vagoneta se mueve entre las áreas siguiendo un ciclo de 5 viajes
completos. El ciclo implica mover la vagoneta a la derecha para cargar, luego a la derecha para
descargar, y finalmente a la izquierda para regresar al área de mantenimiento y completar la
revisión. Se pide programar el controlador del sistema en lenguaje de contactos basándose en un
diagra
The document discusses various topics related to flow measurements and instrumentation. It defines different types of flowmeters like orifice plates, venturi tubes, flow nozzles, pitot tubes, vortex flow elements, and positive displacement and ultrasonic flowmeters. It also discusses measurement terminology such as range, accuracy, response time, and concepts like temperature effects, static pressure effects, interference, instrumentation response, noise, damping, and digital filtering that can impact measurements. Finally, it outlines the purpose of process measurement for goals like process control, safety, and product quality.
ITS_Repair & Refurbishment of GE SPEEDTRONIC Mark V and ABB INFI 90 Power Mod...Winson Tan
The document discusses testing and repair services for GE SPEEDTRONIC Mark V and ABB Bailey INFI 90 systems. It describes how each card is tested before and after refurbishment to check for defects. The repair process includes visual inspection, testing at the panel, repairing/refurbishing the card, and retesting at the panel and with loads. It also mentions providing a 12-month warranty on repaired cards and a card exchange program.
PID Control of Runaway Processes - Greg McMillan DeminarJim Cahill
On-line demo / seminar presented by ModelingAndControl.com's Greg McMillan on August 25, 2010.
Recorded version of presentation will be available post live session at: http://www.screencast.com/users/JimCahill/folders/Deminars
The document provides information on various types of instrumentation and control variables including pressure, temperature, and flow. It describes different sensor types for measuring each variable, including manometers, bourdon tubes, bellows, diaphragms, piezoelectric sensors, RTDs, thermocouples, thermistors, optical sensors, orifice plates, venturi tubes, vortex shedding, and turbine flow meters. For each sensor type, it discusses the measurement principle, advantages, disadvantages, and applications.
I have prepared this presentation after successful commissioning of two such Multivariable Transmitters with 1595 Conditioning Orifice, used to measure raw gas of two trains in OMV (Pakistan) Exploration GmbH. Sawan gas processing plant,
Utilizing DeltaV Advanced Control Innovations to Improve Control PerformanceEmerson Exchange
Many functions of the DeltaV system are unique in the process industry. In this presentation we explore and discuss innovative features of the DeltaV PID and embedded Advanced Control products that can be applied to improve control performance. In particular, PID options are addressed that enhance cascade and override applications and allow effective single loop control using a sampled or wireless measurement. Application examples are used to illustrate how MPC can be easily added and commissioned online with no changes in the existing control strategy. Also, continuous data analytics is used an example that illustrates how future tools will enable improvements to be made in plant operations.
The document compares specifications of pressure transmitters from Yokogawa, Honeywell, and Rosemount, noting their accuracy, power supply ranges, measurement ranges, operating temperature ranges, and special features. It concludes that each transmitter has varying functions appropriate for different needs, such as liquid, gas, or steam pressure measurement. Contact information is provided for purchasing products and further inquiries.
El documento describe el sensor Coriolis, el cual mide la masa de un fluido que fluye a través de él basándose en la fuerza de Coriolis. Explica que el sensor contiene tubos en forma de U que vibran y la fuerza de Coriolis inducida por la masa del fluido causa una pequeña deformación que se mide para calcular el flujo de masa. También detalla algunas aplicaciones del sensor Coriolis en la industria petrolera y otros sectores industriales.
This document provides an overview of a training session on advanced control tools and techniques. The session will cover evaluating control system performance using tools like DeltaV Insight, tuning techniques including integrating processes using on-demand tuning, intelligent PID features for wireless control in DeltaV PIDPlus, and other advanced topics like model predictive control and fuzzy logic control. It also describes a case study of wireless measurement and control implementation at a bioreactor installation.
El documento describe un procedimiento de calibración a manómetro de presión. Se utiliza un circuito que incluye un manómetro, una válvula y una bomba para generar diferentes niveles de presión y comparar las lecturas del manómetro con un manómetro de referencia para asegurar la precisión de las mediciones.
This document discusses proportional, derivative, and proportional-integral-derivative (PID) electronic controllers. It provides mathematical equations for proportional, derivative, and PID control modes. Examples are given to show how to calculate controller gains and design op amp circuits based on given control parameters and signal change periods. The document also provides reference information for the course on process instrumentation and control taught by Dr. S. Meenatchisundaram.
El documento presenta diferentes tipos de medidores de caudal, describiendo sus ventajas y desventajas. Incluye caudalímetros ultrasónicos, de efecto Coriolis, de disco oscilante, electromagnéticos, de ruedas ovaladas y rotámetros. Cada uno es adecuado para diferentes aplicaciones dependiendo del rango de caudales, precisión requerida, tipo de fluido y condiciones ambientales. El documento proporciona detalles técnicos y precios de varios modelos para ayudar a seleccionar el medidor de caud
Instrumentation plays a key role in process automation by measuring and controlling various process variables. Common instrumentation includes transmitters to measure pressure, temperature, level and flow as process variables. Controllers like PID controllers compare the process variable to a set point and operate final control elements, usually valves, to maintain process equilibrium by minimizing differences between the process variable and set point. This closed loop control model is used widely in industrial automation to control temperature, pressure, level and other process conditions.
This document discusses level measurement techniques, including point level and continuous level measurement. Point level measurement uses sensors to detect if the level is within limits, while continuous measurement tracks the level over a range of values. Methods discussed include sight glasses, floats, and pressure-based techniques. Hydrostatic pressure level sensors measure the pressure at the bottom of a tank to determine level. Differential pressure transmitters convert the pressure difference into a standard output signal proportional to level. Closed tanks require differential pressure to subtract the vapor pressure and measure level based on hydrostatic pressure alone.
The document discusses various types of pressure measurement instruments and concepts. It describes pressure gauges, transmitters, and transducers, explaining their measuring principles, components, installation considerations, and common terms. Diagrams illustrate typical configurations and components of differential pressure transmitters and loops.
hi, i have to explain detail about vendor evaluation it covers wt is importance of valuation, types of scoring, ,and wt are the transcation used, cofiguration part and end user part. is covered. if u have any doubt reply me
This document discusses various methods for measuring level in industrial processes, including both point-level and continuous-level sensors for liquids and solids. It describes technologies such as ultrasonic, capacitance, load cell, and radar sensors. Key factors that affect sensor selection are identified as the phase being measured, temperature, pressure, chemistry, and size/shape of the tank. Direct and indirect measurement methods are also overviewed.
Using Syncade Workflow and AMS Device Manager for SIF Proof Testing on a Delt...Emerson Exchange
The document discusses how Syncade Workflow and AMS Device Manager can be used for SIS proof testing on a DeltaV SMART SIS system. It describes how SMART instruments and logic solvers enable automated testing and documentation to satisfy IEC 61511 standards. Syncade workflow guides technicians through tests, documents results electronically, and ensures tasks are done correctly. This facilitates faster commissioning and proof testing while reducing costs.
The document discusses instrumentation and control systems used in power plants. It describes common types of instruments that measure temperature, pressure, level, and flow, including thermocouples, RTDs, manometers, orifice plates, and venturi tubes. Control systems use inputs from these instruments along with logic operations to output decisions that regulate plant processes and operations.
Biomedical Instrumentation and its Fundamentals,Bio electric Signals(ECG, EMG ,EEG)and its Electrodes ,Physiological Transducers,Blood Pressure ,Blood Flow,Cardiac Output ,Patient Safety,Physiological Effects of Electric current on human body etc...
¿Cómo trabajan los ingenieros?
Las ciencias de ingeniería, al igual que las ciencias humanísticas, sociales y naturales, son una disciplina
académica propia y, por lo tanto, tienen sus propios conceptos técnicos, procedimientos y medios. Se
sobreentiende que se basan en otras ciencias y las utilizan, especialmente las matemáticas y la física,
aunque también las ciencias sociales. Sin embargo, estas otras ciencias también recurren en buena medida
a los resultados de la investigación realizada en el ámbito de las ciencias de ingeniería.
A diferencia de las ciencias naturales, las ciencias de ingeniería no se dedican únicamente al
descubrimiento de leyes naturales; su objetivo más bien consiste en encontrar soluciones técnicas para
satisfacer necesidades del ser humano.
Por lo tanto, el ingeniero siempre se pregunta primero cómo solucionar un problema determinado. Esta
actitud redunda en formas de trabajo que son típicas en las ciencias de ingeniería, como la forma de pensar
en cajas negras. Ello significa que utilizan sistemas técnicos para sus fines, sin que tengan que saber
exactamente cómo funcionan sus partes. Al ingeniero le basa saber que un aparato que recibe un “input”
(entrada) determinado ofrece un “output” (salida) determinado.
How does the sugar that forms an elemental part of all the mouth-watering desserts attain it's tiny white crystal shape? Find out the phenomenon of Crystallization & Seeding responsible for giving sugar it's characteristic shape.
This document provides an overview of the Delta V distributed control system (DCS) being used. It describes the key components of the Delta V system including the engineering workstation, application workstation, operator workstations, controllers, I/O modules, and typical network schematic. It also summarizes the functions and features of the operator workstation including the buttons, common display elements or "dynamos" like gauges and valves, and the faceplates used for process monitoring and control.
This document provides an overview of instrumentation and process control. It defines key terms like instrumentation, process, transducer, signal, loop, controller, and interlock. It describes common process parameters measured like pressure, level, temperature, and flow. It discusses primary measuring devices and principles for each process variable. It also covers control valves and automation systems like DCS, PLC, and SCADA.
Thermal plant instrumentation and controlShilpa Shukla
This document provides an overview of instrumentation and control systems used in a thermal power plant. It discusses the key components measured including pressure, temperature, flow, level, vibration and flue gas analysis. It describes the various sensors and instruments used to measure these variables, including bourdon tubes, diaphragms, bellows, thermocouples, RTDs, orifice plates, and analyzers. It also discusses the control and monitoring systems, laboratories, and pollution control systems used in thermal power plants.
The document provides an overview of various instrumentation topics including instrument symbols, flow and pressure measurement, temperature measurement, control valves, level measurement and control loops. It discusses common instrument types for measuring these process variables such as orifice plates, pressure gauges, thermocouples and level switches. It also covers related concepts such as sizing control valves using Cv, installing instruments properly and calibrating instruments.
The document discusses different types of flowmeters used to measure volumetric and mass flow rates of fluids, including orifice meters, rotameters, magnetic flowmeters, and Coriolis mass flowmeters. It explains the basic operating principles of rotameters, which measure flow using a float inside a tapered tube, and magnetic flowmeters, which induce a voltage in conductive fluids using the Faraday's law of induction. It also describes how Coriolis mass flowmeters measure the mass flow rate of a fluid using sensors to detect distortions in the vibration of oscillating measuring tubes caused by the Coriolis force.
This document contains diagrams and descriptions of various programmable logic controller (PLC) components. It discusses CPU block diagrams, PLC scan representations, error detection methods, power supplies, input/output modules, remote I/O configurations, and discrete, AC/DC, isolated, TTL, and register/BCD input and output circuits. The document provides detailed information on the functional aspects and configurations of key PLC subsystems.
This document describes and compares four series of magnetic flow meters: FMG600, FMG3000, FMG-550, and FMG201. Magnetic flow meters have no moving parts and are ideal for wastewater and other dirty or conductive liquids. They work by inducing a voltage in the fluid based on its flow rate through a magnetic field. Features, prices, and specifications are provided for each series.
A magnetic flow meter uses magnetic fields and electrodes to measure conductive liquids without moving parts. They work well for wastewater but not non-conductive liquids. Conditions like flow range, pipe size, and environment must be considered for proper installation. Several models are described for different pipe sizes and flow ranges, including an in-line model for pulp and foods, insertion models with outputs, and a small model for low flows. Magnetic flow meters reverse the magnetic field to cancel out static potential differences at the electrodes for accurate measurements.
This document provides information about a 210 MW low pressure steam turbine. Key points:
- The turbine is a condensing, three cylinder, horizontal turbine with regenerative feed heating and nozzle governing. It has 12 stages in the high pressure turbine and 11 stages in the intermediate pressure turbine.
- The turbine has 5 bearings supporting the 3 rotors. Steam flows through the high pressure turbine, then to the reheater and intermediate pressure turbine before entering the low pressure turbine with 8 total stages.
- Procedures are described for starting the turbine safely using the barring gear to slowly rotate the rotors and prevent distortion, as well as monitoring metal temperatures, vibrations, and eccentricity during startup.
- The document discusses the implementation of an enterprise asset management (EAM) and supply chain management (SCM) system for an LPG plant.
- It proposes implementing a state-of-the-art EAM system like Oracle eAM and integrating it with an industry standard SCM system to improve asset integrity and supply chain functionality.
- The scope of work includes defining system boundaries, applying the manufacturing planning and control lifecycle, designing data templates, and establishing metrics to control the information flow and measure SCM performance.
Programmable logic controllers (PLCs) are solid-state industrial computer control systems that can store instructions to control machines and processes. PLCs are capable of controlling binary inputs and outputs, performing arithmetic and data manipulation, sequencing, timing, counting, and communication. Modern PLCs are modular, scalable, and programmable via simple programming methods to control industrial automation applications. PLCs use logic gates and binary concepts to read inputs, execute program instructions, and control outputs.
Effective, non-invasive cardiac output with good comparison and concordance with ODM.
In Pre-op setting allows advanced cardiac assessment, Inotropy appears to correlate with AT and enables effective use of CVS medication.
This document discusses different types of displays used in distributed control systems (DCS). It describes trend, group, schematic, detail, standard, alarm, loop, continuous process, graphic, batch, and overview displays. Trend displays are used for analyzing plant conditions over time. Group displays show operating parameters of control loops. Schematic displays provide a pictorial view of the plant. Detail displays show all parameters for a specific process point. Standard displays are block diagrams created by technicians. Alarm displays indicate emergency situations. Loop displays show closed-loop process control. Advantages of DCS include quality control, reduced installation costs, and operating efficiencies, while disadvantages include requiring skilled operators and potential for whole system failure if one component fails.
The document describes the basic components of an analog control loop including a transmitter, controller, and final control element. It then provides an overview of analog and digital control systems, explaining the differences between centralized and distributed control systems. Various Yokogawa control system products from the 1960s to beyond 2000 are also summarized.
Utilizing Noninvasive Blood Flow Velocity Measurements for Cardiovascular Phe...InsideScientific
Dr. Anilkumar Reddy of the Baylor College of Medicine presents data from his research outlining the importance of blood flow velocity measurement and shows examples of translational data. He provides an overview of Doppler flow velocity measurement technology and compares data obtained from complimentary devices such as 3D echo ultrasound and transit-time flow systems. Several models are presented showing how many selected measurements scale up in translational research from mice to mammals.
During this presentation the audience learned how Flow Velocity measurements can reliably assess the following parameters in rodents:
Systolic and diastolic cardiac function
Myocardial perfusion & coronary reserve
Pressure overload
Aortic stiffness
Peripheral perfusion
This document provides an overview of metrology and measurement concepts. It discusses the introduction to metrology, the need for measurement, components of a generalized measurement system, types of standards, units of measurement, types of measurements/methods of measurement, types of measuring instruments, accuracy vs precision, and factors affecting accuracy and precision. It also defines types of errors in measurement such as gross errors, measurement errors, systematic errors, and random errors.
Metrology Measurements and All units PPTdinesh babu
Metrology is the science of measurement, embracing both experimental and theoretical determinations at any level of uncertainty in any field of science and technology
This document provides an introduction to measurement systems and concepts. It discusses the classification of standards including primary, secondary, international, and working standards. It also describes the International System of Units (SI) which defines the seven base units of the metric system. Measurement methods are classified as direct comparison using deflection instruments or null balance comparisons, and indirect methods. Direct methods measure the unknown quantity while indirect determine it through a related measured value.
This document discusses concepts of measurement in metrology. It covers general concepts including introduction to metrology, measurement, types of metrology and objectives of metrology. It also discusses methods of measurements, generalized measurement systems including units, standards, accuracy, precision and errors in measurements. Finally it provides an introduction to dimensional and geometric tolerance and interchangeability.
This document discusses measurement and mechanical measurements. It defines measurement as comparing an unknown magnitude to a predetermined standard. Measurement provides quantitative descriptions and must use accurate standards and reliable methods. Mechanical measurements are important for research, design, and development. They are classified as mechanics measurements or power measurements. Mechanics measurements use empirical, rational, or experimental design methods and include measurements of length, mass, and time. Power measurements monitor quantities like pressure, temperature, and flow rates in systems like steam plants. Measurement systems generally work by converting the measured quantity to an analogous signal, processing the signal, and presenting the results. Calibration is important to prove a system's reliability by applying known inputs. Transducers are key components that convert one energy
1. The document discusses the syllabus for the course 20ME601 - Metrology and Measurements.
2. The syllabus is divided into 5 units which cover topics like basics of metrology, linear and angular measurements, form measurement, measurement of mechanical parameters, and advances in metrology including laser interferometers, CMM, and machine vision systems.
3. Key aspects of metrology discussed include measurement systems, standards, measurement methods and types of instruments, factors affecting accuracy and precision, and different types of errors in measurement.
1. The document discusses the syllabus for the course 20ME601 - Metrology and Measurements.
2. The syllabus is divided into 5 units which cover topics like basics of metrology, linear and angular measurements, form measurement, measurement of mechanical parameters, and advances in metrology.
3. Key concepts discussed include types of metrology, components of a generalized measurement system, standards, units, types of measurements/methods of measurements, types of measuring instruments, factors affecting accuracy and precision, and types of errors in measurements.
1. Metrology is the science of measurement and its application. It involves establishing standards of measurement and measurement procedures for accuracy.
2. There are different types of metrology including legal metrology which deals with measurement standards and regulations, and dynamic metrology which measures small continuous variations.
3. The objectives of metrology include evaluating new products, determining process capabilities, minimizing inspection costs, and maintaining measurement accuracy. It is important for scientific research, production, and automation.
This document provides an overview of a course on measurements and instrumentation. It outlines the course outcomes, which include understanding different types of instruments, operating principles of common meters, transducers, and choosing suitable meters. It describes the exam format which tests knowledge across six modules. Module 1 covers general measurement principles, standards, errors, instrument classification, operating principles of moving coil and moving iron meters, and use of shunts and multipliers.
METROLOGY & MEASUREMENT Unit 1 notes (5 files merged)MechRtc
Metrology is the science of measurement. It is concerned with establishing standards of measurement, measuring errors and uncertainties, and ensuring uniformity of measurements. Metrology has applications in industry, commerce, and public health/safety. It functions to maintain standards, train professionals, regulate manufacturers, and conduct research to improve measurement methods and accuracy. Proper measurement requires standards, instruments, trained personnel, and control of environmental factors that could influence results. Sources of error include the measuring system and process itself as well as environmental and loading factors. Accuracy depends on the operator, temperature, measurement method, and instrument deformation.
EXPERT SYSTEMS AND SOLUTIONS
Project Center For Research in Power Electronics and Power Systems
IEEE 2010 , IEEE 2011 BASED PROJECTS FOR FINAL YEAR STUDENTS OF B.E
Email: expertsyssol@gmail.com,
Cell: +919952749533, +918608603634
www.researchprojects.info
OMR, CHENNAI
IEEE based Projects For
Final year students of B.E in
EEE, ECE, EIE,CSE
M.E (Power Systems)
M.E (Applied Electronics)
M.E (Power Electronics)
Ph.D Electrical and Electronics.
Training
Students can assemble their hardware in our Research labs. Experts will be guiding the projects.
EXPERT GUIDANCE IN POWER SYSTEMS POWER ELECTRONICS
We provide guidance and codes for the for the following power systems areas.
1. Deregulated Systems,
2. Wind power Generation and Grid connection
3. Unit commitment
4. Economic Dispatch using AI methods
5. Voltage stability
6. FLC Control
7. Transformer Fault Identifications
8. SCADA - Power system Automation
we provide guidance and codes for the for the following power Electronics areas.
1. Three phase inverter and converters
2. Buck Boost Converter
3. Matrix Converter
4. Inverter and converter topologies
5. Fuzzy based control of Electric Drives.
6. Optimal design of Electrical Machines
7. BLDC and SR motor Drives
This document provides an overview of the Metrology (MEE 322) course. It will cover topics related to precision measurement, including mechanical measurements under strict control conditions, comparator profilometry, and tolerances and quality. There will be two tests focused on collimators and fits. Recommended books for the course are also listed. The introduction to metrology defines key terms like definitions of metrology, types of metrology including scientific and industrial, the need for inspection in manufacturing, and factors that affect the accuracy of measurements. Errors in measurement and metric units used in industry are also introduced.
This document discusses basic principles of measurements. It defines key terms like measurement, instrument, measurand and describes different types of measurement methods, standards, and performance characteristics of instruments. Specifically, it outlines direct and indirect comparison methods of measurement and discusses primary, secondary and working standards. It also categorizes instruments as mechanical, electrical, electronic; and defines static performance characteristics like accuracy, precision, error, range and resolution.
Metrology is the science of measurement. It has three main tasks: defining measurement units, realizing measurement units through scientific methods, and establishing traceability in documenting measurement accuracy. Metrology is essential in scientific research and various industries. It covers establishing standards, developing measurement methods, analyzing errors, and ensuring instrument accuracy. Metrology helps plan lives and enable commercial exchanges with confidence as measurements can be seen everywhere.
JNTUK v semester electronics and communication engineering subject unit 1 ppt
A smart sensor is a device that takes input from the physical environment and uses built-in compute resources to perform predefined functions upon detection. A smart sensor is a device that takes input from the physical environment and uses built-in compute resources to perform predefined functions upon detection of specific input and then process data before passing it on. How do sensors work?
Most sensors use radiation such as light or laser, infrared, radio waves or other waves such as ultrasonic waves to detect objects and changes in their environment. They can do so by having an energy source inside them that enables them to emit the radiation towards their target object.
This document is a course manual on instrumentation and measurement that contains 7 chapters and 4 tutorials. It discusses fundamentals of measurement including direct and indirect methods, calibration concepts, and types of errors. It also covers time-dependent properties of analog signals such as harmonic signals and periodic signals represented through Fourier series. Methods for determining Fourier coefficients both analytically and through fast Fourier transforms are presented. The document provides an overview of key topics in instrumentation and measurement.
Measurement standards play a fundamental role in the calibration process. They serve as precise and universally recognized references against which the accuracy of measurement instruments and devices can be assessed and adjusted. Calibration, in essence, involves comparing a measurement instrument's readings to those of a known standard to determine and correct any discrepancies. Here are some key aspects of measurement standards in calibrations:
1. Primary Measurement Standards: Primary measurement standards are the most fundamental standards in metrology. They are typically based on fundamental physical constants and are maintained at national or international metrology institutes. For example, the International System of Units (SI) defines primary standards for base units like the meter (length), second (time), kilogram (mass), and so on. These primary standards serve as the ultimate references for calibration.
2. Secondary Measurement Standards: Secondary measurement standards are derived from primary standards and are used in day-to-day calibration activities. They are traceable to primary standards through a well-documented chain of comparisons. These standards are often kept at national metrology laboratories and are used for calibrating other instruments.
3. Working Standards: Working standards are instruments or artifacts that are calibrated using secondary standards. They are used directly in industrial or laboratory settings to calibrate measurement instruments regularly. Working standards are typically more accessible and easier to transport than secondary standards.
4. Calibration Traceability: The concept of calibration traceability ensures that measurement results can be traced back to a known, documented reference standard. Calibration laboratories must establish a clear and unbroken chain of comparisons to primary or secondary standards to demonstrate traceability.
5. Calibration Certificates: When an instrument is calibrated, a calibration certificate is issued. This document provides detailed information about the calibration process, including the standards used, measurement uncertainties, and the results of the calibration. It serves as evidence that the instrument has been calibrated and is traceable to a recognized standard.
6. Measurement Uncertainty: Measurement standards are associated with known uncertainties. In calibration, these uncertainties are considered when determining the accuracy and reliability of the instrument being calibrated. Measurement uncertainty is an essential aspect of calibration certificates.
7. Calibration Intervals: Measurement standards and instruments typically have recommended calibration intervals. These intervals specify how often an instrument should be calibrated to maintain its accuracy. Calibration intervals depend on factors like the instrument's stability and the importance of its measurements.
This document provides an overview of distributed control systems (DCS) and programmable logic controllers (PLC). It defines DCS and PLCs, compares them, and describes their basic components and functions. The key aspects covered are:
1) DCS are integrated control systems used for complex, large-scale processes, while PLCs are used for discrete and small-scale control.
2) Both have centralized processing units and input/output modules to interface with field devices.
3) DCS are designed for continuous long-term use, while PLCs are more modular project-based systems.
1. Fieldbus networks replace traditional 4-20 mA analog signals with digital communication over twisted-pair wiring.
2. The key changes are replacing the analog control system and field devices with digital ones that communicate over FOUNDATION fieldbus, and adding terminators to the wire pairs.
3. Devices can be connected in a bus, tree, daisy chain, or point-to-point topology with optional repeaters, bridges or gateways to extend the network or connect different segments.
A device that can transmit and receive messages.
- Assistants can initiate transmissions.
- They are usually field devices like transmitters and valves.
- They have a unique network address.
- They can be scheduled to transmit by the LAS.
- They can also transmit spontaneously if needed.
- They can receive messages addressed to them.
- They can receive broadcast messages.
- They can receive messages from the LAS.
- They can request the LAS for transmission opportunities.
- They can acknowledge messages.
- They can respond to polls from other devices.
- They can participate in the bus arbitration process.
- They can detect and
FOUNDATION fieldbus is a digital, two-way communication system used in industrial automation. It has two implementations: H1 operates at 31.25 Kbit/sec over twisted pair wiring to connect to field devices, while HSE operates at 100 Mbit/sec over Ethernet to connect subsystems. FOUNDATION fieldbus offers advantages over traditional analog wiring like supporting multiple devices on one cable pair and transmitting multiple process variables from one instrument. It also enables two-way communication, device diagnostics, and field-level control.
The document discusses different types of programming languages used in programmable logic controllers (PLCs), including ladder logic, Boolean logic, and Grafcet. It provides details on each language and describes common instruction sets used, such as timers, counters, arithmetic, and data manipulation. The document also covers IEC 61131-3 standard languages like ladder diagrams, function block diagrams, instruction lists, structured text, and sequential function charts. Finally, it discusses PLC architecture and different I/O bus network standards and configurations.
This document discusses various types of input/output interfaces used in programmable logic controllers (PLCs). It describes interfaces for analog, digital, and specialty signals like temperature sensors. Intelligent interfaces include PID controllers for closed-loop processes and positioning interfaces for machine axes. The document also covers serial communication modes and network interfaces that allow multiple PLCs to communicate over local area networks.
Your One-Stop Shop for Python Success: Top 10 US Python Development Providersakankshawande
Simplify your search for a reliable Python development partner! This list presents the top 10 trusted US providers offering comprehensive Python development services, ensuring your project's success from conception to completion.
HCL Notes und Domino Lizenzkostenreduzierung in der Welt von DLAUpanagenda
Webinar Recording: https://www.panagenda.com/webinars/hcl-notes-und-domino-lizenzkostenreduzierung-in-der-welt-von-dlau/
DLAU und die Lizenzen nach dem CCB- und CCX-Modell sind für viele in der HCL-Community seit letztem Jahr ein heißes Thema. Als Notes- oder Domino-Kunde haben Sie vielleicht mit unerwartet hohen Benutzerzahlen und Lizenzgebühren zu kämpfen. Sie fragen sich vielleicht, wie diese neue Art der Lizenzierung funktioniert und welchen Nutzen sie Ihnen bringt. Vor allem wollen Sie sicherlich Ihr Budget einhalten und Kosten sparen, wo immer möglich. Das verstehen wir und wir möchten Ihnen dabei helfen!
Wir erklären Ihnen, wie Sie häufige Konfigurationsprobleme lösen können, die dazu führen können, dass mehr Benutzer gezählt werden als nötig, und wie Sie überflüssige oder ungenutzte Konten identifizieren und entfernen können, um Geld zu sparen. Es gibt auch einige Ansätze, die zu unnötigen Ausgaben führen können, z. B. wenn ein Personendokument anstelle eines Mail-Ins für geteilte Mailboxen verwendet wird. Wir zeigen Ihnen solche Fälle und deren Lösungen. Und natürlich erklären wir Ihnen das neue Lizenzmodell.
Nehmen Sie an diesem Webinar teil, bei dem HCL-Ambassador Marc Thomas und Gastredner Franz Walder Ihnen diese neue Welt näherbringen. Es vermittelt Ihnen die Tools und das Know-how, um den Überblick zu bewahren. Sie werden in der Lage sein, Ihre Kosten durch eine optimierte Domino-Konfiguration zu reduzieren und auch in Zukunft gering zu halten.
Diese Themen werden behandelt
- Reduzierung der Lizenzkosten durch Auffinden und Beheben von Fehlkonfigurationen und überflüssigen Konten
- Wie funktionieren CCB- und CCX-Lizenzen wirklich?
- Verstehen des DLAU-Tools und wie man es am besten nutzt
- Tipps für häufige Problembereiche, wie z. B. Team-Postfächer, Funktions-/Testbenutzer usw.
- Praxisbeispiele und Best Practices zum sofortigen Umsetzen
Best 20 SEO Techniques To Improve Website Visibility In SERPPixlogix Infotech
Boost your website's visibility with proven SEO techniques! Our latest blog dives into essential strategies to enhance your online presence, increase traffic, and rank higher on search engines. From keyword optimization to quality content creation, learn how to make your site stand out in the crowded digital landscape. Discover actionable tips and expert insights to elevate your SEO game.
HCL Notes and Domino License Cost Reduction in the World of DLAUpanagenda
Webinar Recording: https://www.panagenda.com/webinars/hcl-notes-and-domino-license-cost-reduction-in-the-world-of-dlau/
The introduction of DLAU and the CCB & CCX licensing model caused quite a stir in the HCL community. As a Notes and Domino customer, you may have faced challenges with unexpected user counts and license costs. You probably have questions on how this new licensing approach works and how to benefit from it. Most importantly, you likely have budget constraints and want to save money where possible. Don’t worry, we can help with all of this!
We’ll show you how to fix common misconfigurations that cause higher-than-expected user counts, and how to identify accounts which you can deactivate to save money. There are also frequent patterns that can cause unnecessary cost, like using a person document instead of a mail-in for shared mailboxes. We’ll provide examples and solutions for those as well. And naturally we’ll explain the new licensing model.
Join HCL Ambassador Marc Thomas in this webinar with a special guest appearance from Franz Walder. It will give you the tools and know-how to stay on top of what is going on with Domino licensing. You will be able lower your cost through an optimized configuration and keep it low going forward.
These topics will be covered
- Reducing license cost by finding and fixing misconfigurations and superfluous accounts
- How do CCB and CCX licenses really work?
- Understanding the DLAU tool and how to best utilize it
- Tips for common problem areas, like team mailboxes, functional/test users, etc
- Practical examples and best practices to implement right away
In the rapidly evolving landscape of technologies, XML continues to play a vital role in structuring, storing, and transporting data across diverse systems. The recent advancements in artificial intelligence (AI) present new methodologies for enhancing XML development workflows, introducing efficiency, automation, and intelligent capabilities. This presentation will outline the scope and perspective of utilizing AI in XML development. The potential benefits and the possible pitfalls will be highlighted, providing a balanced view of the subject.
We will explore the capabilities of AI in understanding XML markup languages and autonomously creating structured XML content. Additionally, we will examine the capacity of AI to enrich plain text with appropriate XML markup. Practical examples and methodological guidelines will be provided to elucidate how AI can be effectively prompted to interpret and generate accurate XML markup.
Further emphasis will be placed on the role of AI in developing XSLT, or schemas such as XSD and Schematron. We will address the techniques and strategies adopted to create prompts for generating code, explaining code, or refactoring the code, and the results achieved.
The discussion will extend to how AI can be used to transform XML content. In particular, the focus will be on the use of AI XPath extension functions in XSLT, Schematron, Schematron Quick Fixes, or for XML content refactoring.
The presentation aims to deliver a comprehensive overview of AI usage in XML development, providing attendees with the necessary knowledge to make informed decisions. Whether you’re at the early stages of adopting AI or considering integrating it in advanced XML development, this presentation will cover all levels of expertise.
By highlighting the potential advantages and challenges of integrating AI with XML development tools and languages, the presentation seeks to inspire thoughtful conversation around the future of XML development. We’ll not only delve into the technical aspects of AI-powered XML development but also discuss practical implications and possible future directions.
Digital Marketing Trends in 2024 | Guide for Staying AheadWask
https://www.wask.co/ebooks/digital-marketing-trends-in-2024
Feeling lost in the digital marketing whirlwind of 2024? Technology is changing, consumer habits are evolving, and staying ahead of the curve feels like a never-ending pursuit. This e-book is your compass. Dive into actionable insights to handle the complexities of modern marketing. From hyper-personalization to the power of user-generated content, learn how to build long-term relationships with your audience and unlock the secrets to success in the ever-shifting digital landscape.
Main news related to the CCS TSI 2023 (2023/1695)Jakub Marek
An English 🇬🇧 translation of a presentation to the speech I gave about the main changes brought by CCS TSI 2023 at the biggest Czech conference on Communications and signalling systems on Railways, which was held in Clarion Hotel Olomouc from 7th to 9th November 2023 (konferenceszt.cz). Attended by around 500 participants and 200 on-line followers.
The original Czech 🇨🇿 version of the presentation can be found here: https://www.slideshare.net/slideshow/hlavni-novinky-souvisejici-s-ccs-tsi-2023-2023-1695/269688092 .
The videorecording (in Czech) from the presentation is available here: https://youtu.be/WzjJWm4IyPk?si=SImb06tuXGb30BEH .
leewayhertz.com-AI in predictive maintenance Use cases technologies benefits ...alexjohnson7307
Predictive maintenance is a proactive approach that anticipates equipment failures before they happen. At the forefront of this innovative strategy is Artificial Intelligence (AI), which brings unprecedented precision and efficiency. AI in predictive maintenance is transforming industries by reducing downtime, minimizing costs, and enhancing productivity.
Skybuffer AI: Advanced Conversational and Generative AI Solution on SAP Busin...Tatiana Kojar
Skybuffer AI, built on the robust SAP Business Technology Platform (SAP BTP), is the latest and most advanced version of our AI development, reaffirming our commitment to delivering top-tier AI solutions. Skybuffer AI harnesses all the innovative capabilities of the SAP BTP in the AI domain, from Conversational AI to cutting-edge Generative AI and Retrieval-Augmented Generation (RAG). It also helps SAP customers safeguard their investments into SAP Conversational AI and ensure a seamless, one-click transition to SAP Business AI.
With Skybuffer AI, various AI models can be integrated into a single communication channel such as Microsoft Teams. This integration empowers business users with insights drawn from SAP backend systems, enterprise documents, and the expansive knowledge of Generative AI. And the best part of it is that it is all managed through our intuitive no-code Action Server interface, requiring no extensive coding knowledge and making the advanced AI accessible to more users.
How to Interpret Trends in the Kalyan Rajdhani Mix Chart.pdfChart Kalyan
A Mix Chart displays historical data of numbers in a graphical or tabular form. The Kalyan Rajdhani Mix Chart specifically shows the results of a sequence of numbers over different periods.
Monitoring and Managing Anomaly Detection on OpenShift.pdfTosin Akinosho
Monitoring and Managing Anomaly Detection on OpenShift
Overview
Dive into the world of anomaly detection on edge devices with our comprehensive hands-on tutorial. This SlideShare presentation will guide you through the entire process, from data collection and model training to edge deployment and real-time monitoring. Perfect for those looking to implement robust anomaly detection systems on resource-constrained IoT/edge devices.
Key Topics Covered
1. Introduction to Anomaly Detection
- Understand the fundamentals of anomaly detection and its importance in identifying unusual behavior or failures in systems.
2. Understanding Edge (IoT)
- Learn about edge computing and IoT, and how they enable real-time data processing and decision-making at the source.
3. What is ArgoCD?
- Discover ArgoCD, a declarative, GitOps continuous delivery tool for Kubernetes, and its role in deploying applications on edge devices.
4. Deployment Using ArgoCD for Edge Devices
- Step-by-step guide on deploying anomaly detection models on edge devices using ArgoCD.
5. Introduction to Apache Kafka and S3
- Explore Apache Kafka for real-time data streaming and Amazon S3 for scalable storage solutions.
6. Viewing Kafka Messages in the Data Lake
- Learn how to view and analyze Kafka messages stored in a data lake for better insights.
7. What is Prometheus?
- Get to know Prometheus, an open-source monitoring and alerting toolkit, and its application in monitoring edge devices.
8. Monitoring Application Metrics with Prometheus
- Detailed instructions on setting up Prometheus to monitor the performance and health of your anomaly detection system.
9. What is Camel K?
- Introduction to Camel K, a lightweight integration framework built on Apache Camel, designed for Kubernetes.
10. Configuring Camel K Integrations for Data Pipelines
- Learn how to configure Camel K for seamless data pipeline integrations in your anomaly detection workflow.
11. What is a Jupyter Notebook?
- Overview of Jupyter Notebooks, an open-source web application for creating and sharing documents with live code, equations, visualizations, and narrative text.
12. Jupyter Notebooks with Code Examples
- Hands-on examples and code snippets in Jupyter Notebooks to help you implement and test anomaly detection models.
Programming Foundation Models with DSPy - Meetup SlidesZilliz
Prompting language models is hard, while programming language models is easy. In this talk, I will discuss the state-of-the-art framework DSPy for programming foundation models with its powerful optimizers and runtime constraint system.
Programming Foundation Models with DSPy - Meetup Slides
Instrumentation course
1.
2. Oil and Gas Measuring Instruments
Course Aim
The aim of this training course is to build up the procedural and
declarative knowledge required to be recognized by projects engineer that
do not have past background of oil and gas measuring instruments. This
will help them to supervise projects dealing with instrumentation in plants
with a strong background.
In this course, the training cycle is divided in five steps that necessitate
the cooperation between the instructor and the trainees. These steps are
shown in figure below, they are summarized as follows:
1. Define the knowledge and skills required to be developed.
2. Define the elements of each knowledge or skill.
3. Formulate a verbal phrase for the learning objective of each
element.
4. Choose an adequate instructional activity to present each element.
5. Set up an indicator to measure the outcomes of the course and
modify the training skills to adapt the vocational needs.
Define
Knowledge Determine
& Skills Elements
Measure Learning
& Correction Objectives
Instruction
Activity
Training Cycle.
1
3. Oil and Gas Measuring Instruments
Knowledge and Elements
Introduction to measurements.
Introduce general terms.
Introduce quantities and units.
Distinguish between different gauges and switches.
Introduce how quantity is measured.
Illustrate main components of instrument.
Classify different types of measuring instruments.
Develop knowledge about different transmitters and sensing
elements.
Establish knowledge base about transmitter technology.
Introduce Sensing Element.
Introduce theory of operation.
Introduce some analyzers.
Gas Chromatography.
Moisture Analyzer.
Oxygen Analyzer.
2
4. Oil and Gas Measuring Instruments
Table of Contents
Section I
Chapter 1 Introduction to Measuements 5
Chapter 2 Transmitters 16
Section II
Chapter 3 Mechanical Transducers 25
Chapter 4 Electric Transducers 36
Chapter 5 Flowmeters 73
Section III
Chapter 6 Analyzers 102
Chapter 7 Basic Considerations 109
3
6. Oil and Gas Measuring Instruments
Chapter 1
Introduction to Measurement
1.1 Learning objectives
1. Introduce measurements and instruments.
2. Classify instruments and functions.
3. Understand instruments characteristics.
1.2 Measurements
The measurement of a given quantity is an act or the result of
comparison between the quantity and a predefined standard. Since two
quantities are compared, the result is expressed in numerical values. In
fact, the measurement is the process by which one can convert physical
parameters to meaningful numbers. In order that the results are
meaningful, there are two basic requirements:
1. The standard used for comparison purposes must be accurately
defined and should be commonly accepted.
2. The apparatus used and the method adopted must be proved.
1.2.1 Significance of Measurements
The advancement of science and technology is dependent upon a
parallel progress in measurement techniques. There are two major
functions in all branches of engineering:
1. Design of equipment and processes.
2. Proper operation and maintenance of equipment and processes.
Both of these functions require measurements.
5
7. Oil and Gas Measuring Instruments
1.2.2 Methods of Measurements
Direct Method: The unknown quantity is directly compared against
a standard.
Indirect Method: Measurement by direct methods are not always
possible, feasible and practicable. These methods in most of the
cases are inaccurate because of human factors. They are also less
sensitive.
1.2.3 Instruments
In simple cases, an instrument consists of a single unit which gives
an output reading or signal according to the unknown variable applied to
it. In more complex situations, a measuring instrument consists of several
separate elements. These elements may consist of transducer elements
which convert the measurand to an analogous form. The analogous signal
is then processed by some intermediate means and then fed to the end
devices to present the results for the purposes of display and or control.
These elements are:
A detector.
An intermediate transfer device.
An indicator.
The history of development of instruments encompasses three phases:
Mechanical.
Electrical.
Electronic.
6
8. Oil and Gas Measuring Instruments
1.2.4 Classification of Instruments
Absolute instruments: These instruments give the magnitude of the
quantity under measurement in terms of physical constants of the
instrument. Example: Galvanometer.
Secondary Instrument: These instruments are constructed that the
quantity being measured can only be measured by observing the
output indicated by the instrument.
1.2.4.1 Deflection Type
The deflection of the instrument provides a basis for determining
the quantity under measurement as shown in figure (1.1).
Figure 1.1 Deflection Type
1.2.4.2 Null Type
A zero or null indication leads to determination of the magnitude of
measured quantity as shown in figure (1.2).
7
9. Oil and Gas Measuring Instruments
Figure 1.2 Null Type
1.2.4.3 Contact Type
Often when a measured pressure reaches a certain max or min
value, it is desirable to have an alarm sound a warning, a light to
give a signal, or an auxiliary control system to energize or de-energize. A
micro switch is the device commonly used for this purpose.
Figure 1.3 Contact Type
8
10. Oil and Gas Measuring Instruments
1.2.5 Analog and Digital Modes of Operation
Analog Signal: signals that vary in a continuous fashion and take
an infinite number of values in any given range.
Digital signal: signals that vary in discrete steps and thus take only
finite different values in a given range.
1.2.6 Functions of Instruments
Indicating function.
Recording function.
Controlling Function.
1.3 Characteristics of Instruments
1.3.1 Performance
It is to define a set of criteria that gives a meaningful description of
quality of measurement. Performance characteristics are obtained in one
form or another by a process called calibration. The calibration of all
instruments is important since it affords the opportunity to check the
instrument against a known standard.
1.3.2 Errors in Measurement
Measurements always involve errors. No measurement is free from
errors. An understanding and thorough evaluation of the errors is
essential.
9
11. Oil and Gas Measuring Instruments
Figure 1.4 Visual error
1.3.3 True Value
True Value: The true value of quantity to be measured may be
defined as the average of an infinite number of measured values when the
average deviation due to the various contributing factors tends to zero.
1.3.4 Ranges
Scale range: it is defined as the difference between the largest and
the smallest reading of the instrument, i.e. scale range from 200 to
500 degree C.
Scale Span: It is may be confusing with scale range but it is given
to be 300 degree C.
Effective Range: It is defined as the range over which it meets
some specified accuracy requirements.
Rangeability (turndown): If the effective range is from A to B, then
the rangeability is defined by B/A.
1.3.5 Discrimination, Accuracy, Error, Precision and Sensitivity
Discrimination (Resolution): It is used to describe how finely an
instrument can measure. For example, the discrimination of a
10
12. Oil and Gas Measuring Instruments
digital electronic timer reading in milliseconds is a hundred times
as great as that of a stopwatch graduated in tenths of seconds. It is
often wrongly referred as sensitivity.
Accuracy: It is the closeness with which the instrument reading
approaches the true value of the quantity. Thus accuracy means
conformity to truth.
Error: It is defined as the difference between the measured value
and the true value. One kind of error is observational error.
Precision: It is a measure of the degree of agreement within a group
of measurements. High precision means a tight cluster and repeated
results while low precision indicates a broad scattering of results.
Certainty: It is often used as a synonym for accuracy. However,
Uncertainty is the property of a measurement rather than the
instrument used to make the measurement.
Sensitivity: It is a measure of how an instrument is sensitive to the
measured quantity variation. It is the ability to produce detectable
output.
Figure 1.5 Accuracy and Repeatability
1.3.6 Reproducibility, Repeatability and Hysteresis
Reproducibility: It is the closeness of agreement among repeated
measurements of the output for the same value of input mode under
11
13. Oil and Gas Measuring Instruments
the same operating condition over a period of time, approaching
from both directions.
Repeatability: It is the closeness of agreement among a number of
consecutive measurements of the output for the same value of input
under the same operating conditions, approaching from the same
direction.
Figure 1.6 Repeatability
Hysteresis and Dead Band: It is the maximum difference for the
same input between the upscale and downscale output values
during a full range transverse in each direction.
Dead Time: It is defined as the time required by an instrument to
begin to respond to a change in the measurand.
Dead Zone: It is defined as the largest change in which there is no
output from the instrument.
12
14. Oil and Gas Measuring Instruments
Figure 1.7 Hysteresis and Dead band
1.3.7 Drift
Perfect Reproducibility means no drift. No drift means that with a
given input the measured values do not vary with time.
Zero Drift: if the whole calibration gradually shifts.
Span Drift: If there is a proportional change in the indication all
along the upward scale.
Zonal Drift: In case the drift occurs only over a portion of the span.
Figure 1.8 Drift
13
15. Oil and Gas Measuring Instruments
1.3.8 Noise
A spurious current or voltage extraneous to the current or voltage
of interest in an electrical or electronic circuit is called noise.
1.3.9 Linearity
It is the closeness to which a curve approximates a straight line. It
is a measure of the extent to which the instrument calibration curve over
its effective range departs from the best fitting straight line.
Figure 1.9 Linearity
1.3.10 Loading Effects
The ideal situation in a measuring system is that when an element
used for any purpose, the original signal should remain undistorted. In
practical conditions, it has been found that any element in the system
extracts energy and thereby distorting the original signal.
14
16. Oil and Gas Measuring Instruments
1.3.11 Other Effects
Temperature Effect
Pressure Effect
Vibration Effect
1.4 Role Play
Each Trainee should speak thoroughly about one of the learning objective
elements.
15
17. Oil and Gas Measuring Instruments
Chapter 2
Transmitters
2.1 Learning Objectives
1. Introduce history of transmitter technology.
2. Understand analog transmitters.
3. Understand smart transmitters with HART protocol.
2.2 Transmitter Technology
Transmitters are instruments that transfer measured output signal to
distance places where it is needed. The technology development through
years is:
1. Pneumatic and Hydraulic.
2. Electrical (Analog – 4-20 mA).
3. Electronic (Analog – 4-20 mA + Digital – HART protocol).
4. Electronic (All digital – Foundation Fieldbus).
Figure 2.1 Pneumatic Transmitter
16
18. Oil and Gas Measuring Instruments
2.3 Analog Transmitters
Analog transmitter uses a variable conversion element to translate
and accommodate the physical non-electrical measurand to electrical
analog signal (4-20 mA).
Figure 2.2 Analog Transmitter
2.3.1 Measurement Converters of Electrical Quantities
Measuring amplifiers: demands on measuring amplifiers, negative
feedback, ideal operational amplifier, basic circuits of measuring
amplifiers using operational amplifiers (OAs)
Measurement of low voltages and currents using OAs, estimating
uncertainty of measurement (including influence of input voltage
offset and input bias).
Rectifiers (converters of the rectified mean value).
2.3.2 Ideal Operational Amplifiers
Figure 2.3 Ideal OP-Amp
17
19. Oil and Gas Measuring Instruments
2.3.3 Inverting amplifier
Figure 2.4 Inverting Amplifier
2.3.4 Current to Voltage Converter
Figure 2.5 Current to Voltage converter
2.3.5 Voltage Controlled Current Source
Figure 2.6 Voltage controlled Current source
2.3.6 Rectifiers
Figure 2.7 Rectifier
18
21. Oil and Gas Measuring Instruments
2.4 HART Protocol
2.4.1 HART Overview
For many years, the field communication standard for process
automation equipment has been a milliamp analog current signal. HART
field communications protocol extends the 4-20 mA standards to enhance
communication with smart field instruments. It was designed for use with
intelligent measurement and control instruments which traditionally
communicate using mA analog signals. HART preserves the 4-20 mA
signals and enables two way digital communications to occur without
affecting the integrity of 4-20 mA signal.
Figure 2.11 Hart Digital Signal
HART, highway addressable remote transducer, makes use of Bell
202 FSK standard to superimpose digital signal at a low level on top of
analog signal; i.e. 1200 Hz for logic 1 and 2200 Hz for logic 0. HART
communicates 1200 bps without interrupting the mA signal and allows a
host application to get two or more digital updates per second from a field
device.
20
22. Oil and Gas Measuring Instruments
Figure 2.12 HART Connection
HART is a master/slave protocol which means that a field device
(slave) only speaks when spoken to by a master. HART provides for up to
two masters, primary and secondary, as shown in figure (2.12).
Figure 2.13 Master/Slave
The most commonly employed communication mode is the
master/slave, figure (2.13). The optional burst communication mode
where a slave device can continuously broadcast a HART reply message,
figure (2.14).
Figure 2.14 Burst
2.4.2 HART Benefits
2.4.2.1 35-40 data items Standard in every HART device
Device Status & Diagnostic Alerts;
Process Variables & Units;
Loop Current & % Range;
Basic Configuration Parameters;
Manufacturer & Device Tag;
21
23. Oil and Gas Measuring Instruments
2.4.2.2 Increases control system integrity
Get early warning of device problems;
Use capability of multi-variable devices;
Automatically track and detect changes (mismatch) in Range
or Engineering Units;
Validate PV and Loop Current values at control system
against those from device;
2.4.2.3 HART is Safe, Secure, and Available
Tested and Accepted global standard;
Supported by all major instrumentation manufacturers;
2.4.2.4 Saves Time and Money
Install and commission devices in fraction of the time;
Enhanced communications and diagnostics reduce
maintenance & downtime;
Low or no additional cost by many suppliers;
2.4.2.5 Improves Plant Operation and Product Quality
Additional process variables and performance indicators
Continuous device status for early detection of warnings and
errors
Digital capability ensures easy integration with plant
networks
2.4.2.6 Protects Your Asset Investments
Compatible with existing instrumentation systems,
equipment and people
Allows benefits to be achieved incrementally
No need to replace entire system
22
24. Oil and Gas Measuring Instruments
2.5 Role Play
Each Trainee should speak thoroughly about one of the learning objective
elements.
Analog Transmitters
Smart Transmitters and HART Protocol.
23
26. Oil and Gas Measuring Instruments
Chapter 3
Mechanical Transducers
3.1 Learning objectives
1. Understand the theory of operation of different sensing elements.
3.2 Springs
Most mechanical input instruments employ mechanical springs of
one form or another. Various common types of springs are shown in
figure (3.1). These range from cantilever, helical and spiral springs.
Figure 3.1 Springs
3.3 Pressure Sensing Elements
Most pressure devices use elastic elements for sensing pressure at
the primary stage. A link and gear mechanism are used to convert the
movement to rotational motion to be connected the scale and pointer.
25
27. Oil and Gas Measuring Instruments
3.3.1 Bourdon Tubes
The bourdon tubes are made out of an elliptical flattened bent tube.
One end is sealed and the other is open for fluid to enter. The pressure of
the fluid tends to straighten out the tube. This motion is transferred to the
pointer.
3.3.1.1 C-Type
It is the most used for local indication.
Figure 3.2 Bourdon Type
26
28. Oil and Gas Measuring Instruments
3.3.1.2 Spiral Type
Increasing the number of turns will increase the displacement of the free
tip without changing the wall thickness.
Figure 3.3 Spiral type
3.3.1.3 Helical Type
The displacement of the tip of the helical type is larger than that of the
spiral one.
Figure 3.4 Helical type
3.3.2 Bellows
A metallic bellows is a series of circular parts, resembling the folds
in an accordion. The parts are designed in such a way that there are
expanded and contracted.
27
29. Oil and Gas Measuring Instruments
Figure 3.5 Bellows Type
3.3.3 Diaphragms
The operating principle of diaphragm elements is similar to that of
the bellows. The pressure applied causes it to deflect where the deflection
is proportional to the applied pressure.
Figure 3.6 Diaphragm Type
28
30. Oil and Gas Measuring Instruments
13.4 Temperature Sensing Elements
3.4.1 Bimetallic Thermometer
They are used for local temperature measurements. It is constructed
by bonding two different metals such that they cannot move relative to
each other. All metals try to change their physical dimensions at different
rates when subjected to same change in temperature. The differential
change in expansion of two metals results in bending or flattening the
structure, which in turn moves the pointer via the intermediate element.
3.4.1.1 Strip
Figure 3.7 Strip Type
3.4.1.2 Spiral
Figure 3.8 Spiral type
29
31. Oil and Gas Measuring Instruments
3.4.1.3 Helical
Figure 3.9 Helical Type
3.4.2 Distance Reading
There are three basic types of distant reading thermometers.
Liquid filled
Gas filled
Combination liquid-vapor filled
The thermometers are filled with fluid at some temperature and sealed.
Almost the entire volume of the fluid is in the sensing bulb.
Figure 3.10 Distance Reading Type
30
32. Oil and Gas Measuring Instruments
3.5 Level Sensing Elements
Figure 3.11 Installation
3.5.1 Transparent Glass
Sight Glasses for Level Gauges grant the best chemical and
physical properties, holding a very precise place as for chemical
composition within the very large group of "Borosilicate Glass" which is
suitable for many applications.
Figure 3.12 Level Glass
3.5.2 Circular Sight Ports
These are used to allow observation within sealed vessels.
Figure 3.13 Dight Port
31
33. Oil and Gas Measuring Instruments
3.5.3 Reflex Type
Reflex level gauges working principle is based on the light
refraction and reflection laws. Reflex level gauges use glasses having the
face fitted towards the chamber shaped to have prismatic grooves with
section angle of 90°. When in operation, the chamber is filled with liquid
in the lower zone and gases or vapors in the upper zone; the liquid level is
distinguished by different brightness of the glass in the liquid and in the
gas/vapor zone. The reflex level gauges do not need a specific
illumination: the day environmental light is enough. Only during the
night an artificial light must be provided.
Figure 3.14 Reflex Type
3.5.4 Bicolor Type
An illuminator with special red and a green filters is fitted on the
gauge at the opposite side with respect to the observer. This special
illuminator conveys light through the filters obliquely to the back glasses
of the level gauge. Said filters allow crossing only to red and green rays.
Such colored rays reach, through the back glass, the media inside level
body. When the gauge contains steam, green rays are considerably
deviated and prevented from emerging by the observer side; then only red
light, whose rays are smoothly deviated by steam, passes through the
whole internal hole, reaching the observer. Conversely when rays find
32
34. Oil and Gas Measuring Instruments
water, red rays are considerably deviated and lost inside the internal part
of level gauge, green rays can reach the front glass and seen by the
observer.
Figure 3.15 Bicolor Type
3.5.5 Magnetic Type
Operation of BONT Magnetic Level Gauge is based on some
elementary physical principles:
The principle whereby liquid in communicating vessels is always
at same level;
Archimedes's principle according to which a body immersed in a
liquid receives a buoyancy equal to the weight of displaced liquid;
The principle of attraction between North and South poles of two
permanent magnets and that of repulsion between like poles.
o This principle has two applications in the BONT magnetic
level gauge:
first between the magnet in the chamber float and
every single magnet of the indicating scale:
Second between the magnets of the indicating scale.
33
35. Oil and Gas Measuring Instruments
Figure 3.16 Magnetic Type
3.5.6 Gamma Level Switching
The transmission of gamma radiation through a container is
affected by the level contents. The intensity of the transmitted radiation is
measured and used to activate switches when pre-set intensity levels are
reached.
Figure 3.17 Gamma Rays Type
3.6 Seismic Transducer (Vibration)
A schematic diagram is shown in figure (3.18). The mass is
connected through a spring and damper arrangement to a housing frame.
The housing frame is connected to the source of vibrations to be
34
36. Oil and Gas Measuring Instruments
measured. The mass has the tendency to remain fixed in its spatial
position so that the vibration motion is registered as a relative
displacement between mass and housing frame. The seismic transducer
may be used in two different modes. A large mass and a soft spring are
suited for displacement mode, while a relatively small mass and a stiff
spring are used for acceleration mode.
Figure 3.18 Seismic Type
3.7 Role Play
Each Trainee should speak thoroughly about:
Pressure Sensing
Level Sensing
Temperature Sensing
Vibration Switches.
35
37. Oil and Gas Measuring Instruments
Chapter 4
Electrical Transducers
4.1 Learning objectives
1. Introduce electrical transducers.
2. Understand the theory of operation of different transducers.
4.2 Introduction
In order to measure non-electrical quantities, a detector is used
usually to convert the physical quantity into a displacement. In electrical
transducers the output is different, it is in electrical form. The output
gives the magnitude of the measurand. The electric signal may be current,
voltage or frequency and production of these signals is based upon
electrical effects which may be resistance, capacitance, induction, etc.
A transducer may be defined as a device, which converts energy
from one form to another. In electrical instrumentation, a transducer may
be defined as a device which converts a physical quantity into electrical
signal. Another name of a transducer is pick up.
4.2.1 Advantages of Electrical Transducers
Amplification and attenuation may be done easily.
The mass-inertia effects are minimized.
The effects of friction are minimized.
Low power level.
Use of telemetry.
36
38. Oil and Gas Measuring Instruments
4.2.2 Classification of Transducers
The transducer consists of two closely related parts:
Detector Element: It is the part that responds to physical
phenomenon.
Transduction Element: It transforms the output of the sensing
element to an electrical output.
Classification of transducers is as follows:
Based on Transduction: like piezoelectric, thermoelectric, etc.
Primary and Secondary: Example, a primary part that transforms
pressure into displacement and secondary part that transforms
displacement into electrical form.
Passive and Active: Depends on whether the transducer will derive
power from or to the circuit.
Analog and Digital: Analog continuous form like voltage or digital
form like pulses.
Transducers and Inverse Transducers: It depends whether the
transducer convert physical quantity to electrical signal or vice
versa.
4.3 Pressure Sensing Elements
4.3.1 Strain Gauges
If a metal conductor is stretched or compressed, its resistance
changes on account of the fact that both length and diameter are changed.
This property is called piezoresistivity.
Figure 4.1 Strain Gauge
37
39. Oil and Gas Measuring Instruments
4.3.2 Inductive Type
Figure (4.2) shows an arrangement which uses coils to form the
two arms of an AC bridge. The pressure acts on the diaphragm and
disturbs the reluctance of the paths of magnetic flux for both coils.
Figure 4.2 Inductive Type
4.3.3 Capacitive Type
They convert pressure into displacement which changes the
capacitance value by changing the distance between the two parallel
plates of a capacitor.
Figure 4.3 Capacitive Type
38
40. Oil and Gas Measuring Instruments
4.3.4 Linear Variable differential Transformer
The LVDT is used as secondary transducer for measurement of
pressure. The pressure is converted into displacement which is sensed by
LVDT and converted into a voltage.
Figure 4.4 LVDT
4.3.5 Photoelectric Type
As shown in figure (4.5) the light path is affected by the applied
pressure which in turn affects the quantity of light received by the
photoelectric transducer.
Figure 4.5 Photoelectric Type
39
41. Oil and Gas Measuring Instruments
4.3.6 Piezoelectric Type
A piezoelectric material is one in which an electric potential
appears across certain surfaces if the dimensions of the crystal are
changed by the application of mechanical force. The potential is produced
by the displacement of charges. The effect is reversible and is known as
the piezoelectric effect.
Figure 4.6 Piezoelectric Type
4.4 Temperature Sensing Elements
40
42. Oil and Gas Measuring Instruments
4.4.1 Thermocouple
The thermocouple is one of the simplest of all sensors. It consists
of two wires of dissimilar metals joined near the measurement point. The
output is a small voltage measured between the two wires.
Figure 4.7 The thermocouple
While appealingly simple in concept, the theory behind the thermocouple
is subtle, the basics of which need to be understood for the most effective
use of the sensor.
4.4.1.1 Thermocouple theory
A thermocouple circuit has at least two junctions: the measurement
junction and a reference junction. Typically, the reference junction is
created where the two wires connect to the measuring device. This second
junction it is really two junctions: one for each of the two wires, but
because they are assumed to be at the same temperature (isothermal) they
are considered as one (thermal) junction. It is the point where the metals
change - from the thermocouple metals to what ever metals are used in
the measuring device - typically copper.
The output voltage is related to the temperature difference between
the measurement and the reference junctions. This is phenomena is
known as the Seebeck effect. In practice the Seebeck voltage is made up
of two components: the Peltier voltage generated at the junctions, plus the
Thomson voltage generated in the wires by the temperature gradient.
41
43. Oil and Gas Measuring Instruments
Figure 4.8 Signal generated by temperature gradient
The Peltier voltage is proportional to the temperature of each
junction while the Thomson voltage is proportional to the square of the
temperature difference between the two junctions. It is the Thomson
voltage that accounts for most of the observed voltage and non-linearity
in thermocouple response.
Each thermocouple type has its characteristic Seebeck voltage
curve. The curve is dependent on the metals, their purity, their
homogeneity and their crystal structure. In the case of alloys, the ratio of
constituents and their distribution in the wire is also important. These
potential inhomogeneous characteristics of metal are why thick wire
thermocouples can be more accurate in high temperature applications,
when the thermocouple metals and their impurities become more mobile
by diffusion.
4.4.1.2 The practical considerations of thermocouples
The above theory of thermocouple operation has important
practical implications that are well worth understanding:
1. A third metal may be introduced into a thermocouple circuit and have
no impact, provided that both ends are at the same temperature. This
means that the thermocouple measurement junction may be soldered,
brazed or welded without affecting the thermocouple's calibration, as long
as there is no net temperature gradient along the third metal.
Further, if the measuring circuit metal (usually copper) is different to that
of the thermocouple, then provided the temperature of the two connecting
42
44. Oil and Gas Measuring Instruments
terminals is the same and known, the reading will not be affected by the
presence of copper.
2. The thermocouple's output is generated by the temperature gradient
along the wires and not at the junctions as is commonly believed.
Therefore it is important that the quality of the wire be maintained where
temperature gradients exists. Wire quality can be compromised by
contamination from its operating environment and the insulating material.
For temperatures below 400°C, contamination of insulated wires is
generally not a problem. At temperatures above 1000°C, the choice of
insulation and sheath materials, as well as the wire thickness, become
critical to the calibration stability of the thermocouple.
The fact that a thermocouple's output is not generated at the junction
should redirect attention to other potential problem areas.
3. The voltage generated by a thermocouple is a function of the
temperature difference between the measurement and reference junctions.
Traditionally the reference junction was held at 0°C by an ice bath:
Figure 4.9 Traditional Thermocouple Measurement
The ice bath is now considered impractical and is replaced by a reference
junction compensation arrangement. This can be accomplished by
measuring the reference junction temperature with an alternate
temperature sensor (typically an RTD or thermistor) and applying a
correcting voltage to the measured thermocouple voltage before scaling to
temperature.
43
45. Oil and Gas Measuring Instruments
Figure 4.10 Modern Thermocouple Measurement
The correction can be done electrically in hardware or mathematically in
software. The software method is preferred as it is universal to all
thermocouple types (provided the characteristics are known) and it allows
for the correction of the small non-linearity over the reference
temperature range.
4. The low-level output from thermocouples (typically 50mV full scale)
requires that care be taken to avoid electrical interference from motors,
power cable and transformers. Twisting the thermocouple wire pair (say 1
twist per 10 cm) can greatly reduce magnetic field pickup. Using shielded
cable or running wires in metal conduit can reduce electric field pickup.
The measuring device should provide signal filtering, either in hardware
or by software, with strong rejection of the line frequency (50/60 Hz) and
its harmonics.
5. The operating environment of the thermocouple needs to be
considered. Exposure to oxidizing or reducing atmospheres at high
temperature can significantly degrade some thermocouples.
Thermocouples containing rhodium (B, R and S types) are not suitable
under neutron radiation.
4.4.1.3 The advantages and disadvantages of thermocouples
Because of their physical characteristics, thermocouples are the
preferred method of temperature measurement in many applications.
They can be very rugged, are immune to shock and vibration, are useful
44
46. Oil and Gas Measuring Instruments
over a wide temperature range, are simple to manufactured, require no
excitation power, there is no self heating and they can be made very
small. No other temperature sensor provides this degree of versatility.
Thermocouples are wonderful sensors to experiment with because of their
robustness, wide temperature range and unique properties.
On the down side, the thermocouple produces a relative low output signal
that is non-linear. These characteristics require a sensitive and stable
measuring device that is able provide reference junction compensation
and linearization. Also the low signal level demands that a higher level of
care be taken when installing to minimize potential noise sources.
The measuring hardware requires good noise rejection capability. Ground
loops can be a problem with non-isolated systems, unless the common
mode range and rejection is adequate.
4.4.1.4 Types of thermocouple
About 13 'standard' thermocouple types are commonly used. Eight
have been given an internationally recognized type designator. Some of
the non-recognized thermocouples may excel in particular niche
applications and have gained a degree of acceptance for this reason, as
well as due to effective marketing by the alloy manufacturer.
Each thermocouple type has characteristics that can be matched to
applications. Industry generally prefers K and N types because of their
suitability to high temperatures, while others often prefer the T type due
to its sensitivity, low cost and ease of use.
A table of standard thermocouple types is presented below. The table also
shows the temperature range for extension grade wire in brackets.
45
47. Oil and Gas Measuring Instruments
Positive Negative Accuracy*** Range °C
Type Comments
Material Material Class 2 (extension)
Good at high temperatures,
0.5% 50 to 1820
B Pt, 30%Rh Pt, 6%Rh no reference junction
>800°C (1 to 100)
compensation required.
1% 0 to 2315 Very high temperature use,
C** W, 5%Re W, 26%Re
>425°C (0 to 870) brittle
1% 0 to 2315 Very high temperature use,
D** W, 3%Re W, 25%Re
>425°C (0 to 260) brittle
-270 to 1000 General purpose, low and
E Ni, 10%Cr Cu, 45%Ni 0.5% or 1.7°C
(0 to 200) medium temperatures
1% 0 to 2315 Very high temperature use,
G** W W, 26%Re
>425°C (0 to 260) brittle
-210 to 1200 High temperature, reducing
J Fe Cu, 45%Ni 0.75% or 2.2°C
(0 to 200) environment
Ni, 2%Al General purpose high
-270 to 1372
K* Ni, 10%Cr 2%Mn 0.75% or 2.2°C temperature, oxidizing
(0 to 80)
1%Si environment
M** Ni Ni, 18%Mo 0.75% or 2.2°C -50 to 1410 .
Ni, Relatively new type as a
Ni, 14%Cr -270 to 1300
N* 4.5%Si 0.75% or 2.2°C superior replacement for K
1.5%Si (0 to 200)
0.1%Mg Type.
A more stable but
P** Platinel II Platinel II 1.0% 0 to 1395 expensive substitute for K
& N types
-50 to 1768
R Pt, 13%Rh Pt 0.25% or 1.5°C Precision, high temperature
(0 to 50)
-50 to 1768
S Pt, 10%Rh Pt 0.25% or 1.5°C Precision, high temperature
(0 to 50)
Good general purpose, low
-270 to 400
T* Cu Cu, 45%Ni 0.75% or 1.0°C temperature, tolerant to
(-60 to 100)
moisture.
* Most commonly used thermocouple types, ** Not ANSI recognized types. *** See IEC 584-2 for more details.
Materials codes:- Al = Aluminum, Cr = Chromium, Cu = Copper, Mg = Magnesium, Mo = Molybdenum, Ni =
Nickel, Pt = Platinum, Re = Rhenium, Rh = Rhodium, Si = Silicon, W = Tungsten
46
48. Oil and Gas Measuring Instruments
4.4.1.5 Accuracy of thermocouples
Thermocouples will function over a wide temperature range - from
near absolute zero to their melting point, however they are normally only
characterized over their stable range. Thermocouple accuracy is a
difficult subject due to a range of factors. In principal and in practice a
thermocouple can achieve excellent results (that is, significantly better
than the above table indicates) if calibrated, used well below its nominal
upper temperature limit and if protected from harsh atmospheres. At
higher temperatures it is often better to use a heavier gauge of wire in
order to maintain stability.
As mentioned previously, the temperature and voltage scales were
redefined in 1990. The eight main thermocouple types - B, E, J, K, N, R,
S and T - were re-characterized in 1993 to reflect the scale changes. (See:
NIST Monograph 175 for details). The remaining types: C, D, G, M and
P appear to have been informally re-characterized.
4.4.1.6 Thermocouple wire grades
There are different grades of thermocouple wire. The principal
divisions are between measurement grades and extension grades. The
measurement grade has the highest purity and should be used where the
temperature gradient is significant. The standard measurement grade
(Class 2) is most commonly used. Special measurement grades (Class 1)
are available with accuracy about twice the standard measurement grades.
The extension thermocouple wire grades are designed for connecting the
thermocouple to the measuring device. The extension wire may be of
different metals to the measurement grade, but are chosen to have a
47
49. Oil and Gas Measuring Instruments
matching response over a much reduced temperature range - typically -
40°C to 120°C. The reason for using extension wire is reduced cost - they
can be 20% to 30% of the cost of equivalent measurement grades. Further
cost savings are possible by using thinner gauge extension wire and a
lower temperature rated insulation.
Note: When temperatures within the extension wire's rating are being
measured, it is OK to use the extension wire for the entire circuit. This is
frequently done with T type extension wire, which is accurate over the -
60 to 100°C range.
4.4.1.7 Thermocouple wire gauge
At high temperatures, thermocouple wire can under go irreversible
changes in the form of modified crystal structure, selective migration of
alloy components and chemical changes originating from the surface
metal reacting to the surrounding environment. With some types,
mechanical stress and cycling can also induce changes.
Increasing the diameter of the wire where it is exposed to the high
temperatures can reduce the impact of these effects.
The following table can be used as a very approximate guide to wire
gauge:
48
50. Oil and Gas Measuring Instruments
8 Gauge 16 Gauge 20 Gauge 24 Gauge 28 Gauge 30 Gauge
Type
4.06mm 1.63mm 0.91mm 0.56mm 0.38mm 0.32mm
B 1820 - - 1700 1700 -
C 2315 2315 2315 2315 2315 -
D 2315 2315 2315 2315 2000 -
E 870 620 540 430 400 370
G 2315 2315 2315 2315 2315 -
J 760 560 480 370 370 320
K 1260* 1000* 980 870 820 760
M 1260* 1200* - - - -
N 1260* 1000* 980 870 820 760
P 1395 - 1250 1250 1250 -
R 1760 - - 1480 1480 -
S 1760 - - 1480 1480 -
T 400 370 260 200 200 150
* Upper temperature limits only apply in a protective sheath
At these higher temperatures, the thermocouple wire should be
protected as much as possible from hostile gases. Reducing or oxidizing
gases can corrode some thermocouple wire very quickly. Remember, the
purity of the thermocouple wire is most important where the temperature
gradients are greatest. It is with this part of the thermocouple wiring
where the most care must be taken.
Other sources of wire contamination include the mineral packing
material and the protective metal sheath. Metallic vapor diffusion can be
significant problem at high temperatures. Platinum wires should only be
used inside a nonmetallic sheath, such as high-purity alumna.
49
51. Oil and Gas Measuring Instruments
High temperature measurement is very difficult in some situations. In
preference, use non-contact methods. However this is not always
possible, as the site of temperature measurement is not always visible to
these types of sensors.
4.4.1.8 Color coding of thermocouple wire
The color coding of thermocouple wire is something of a
nightmare! There are at least seven different standards. There are some
inconsistencies between standards, which seem to have been designed to
confuse. For example the color red in the USA standard is always used
for the negative lead, while in German and Japanese standards it is always
the positive lead. The British, French and International standards avoid
the use of red entirely!
4.4.1.9 Thermocouple mounting
There are four common ways in which thermocouples are mounted
with in a stainless steel or Inconel sheath and electrically insulated with
mineral oxides. Each of the methods has its advantages and
disadvantages.
50
52. Oil and Gas Measuring Instruments
Figure 4.11 Thermocouple Sheath Options
Sealed and Isolated from Sheath: Good relatively trouble-free
arrangement. The principal reason for not using this arrangement
for all applications is its sluggish response time - the typical time
constant is 75 seconds
Sealed and Grounded to Sheath: Can cause ground loops and
other noise injection, but provides a reasonable time constant (40
seconds) and a sealed enclosure.
Exposed Bead: Faster response time constant (typically 15
seconds), but lacks mechanical and chemical protection, and
electrical isolation from material being measured. The porous
insulating mineral oxides must be sealed
Exposed Fast Response: Fastest response time constant (typically
2 seconds), depending on the gauge of junction wire. In addition to
problems of the exposed bead type, the protruding and light
construction makes the thermocouple more prone to physical
damage.
51
53. Oil and Gas Measuring Instruments
4.4.1.10 Conversion Table
ITS-90 Table for type J thermocouple
Thermoelectric Voltage in mV
°C 0 1 2 3 4 5 6 7 8 9 10
0 0.000 0.050 0.101 0.151 0.202 0.253 0.303 0.354 0.405 0.456 0.507
10 0.507 0.558 0.609 0.660 0.711 0.762 0.814 0.865 0.916 0.968 1.019
20 1.019 1.071 1.122 1.174 1.226 1.277 1.329 1.381 1.433 1.485 1.537
30 1.537 1.589 1.641 1.693 1.745 1.797 1.849 1.902 1.954 2.006 2.059
40 2.059 2.111 2.164 2.216 2.269 2.322 2.374 2.427 2.480 2.532 2.585
50 2.585 2.638 2.691 2.744 2.797 2.850 2.903 2.956 3.009 3.062 3.116
60 3.116 3.169 3.222 3.275 3.329 3.382 3.436 3.489 3.543 3.596 3.650
70 3.650 3.703 3.757 3.810 3.864 3.918 3.971 4.025 4.079 4.133 4.187
80 4.187 4.240 4.294 4.348 4.402 4.456 4.510 4.564 4.618 4.672 4.726
90 4.726 4.781 4.835 4.889 4.943 4.997 5.052 5.106 5.160 5.215 5.269
100 5.269 5.323 5.378 5.432 5.487 5.541 5.595 5.650 5.705 5.759 5.814
110 5.814 5.868 5.923 5.977 6.032 6.087 6.141 6.196 6.251 6.306 6.360
120 6.360 6.415 6.470 6.525 6.579 6.634 6.689 6.744 6.799 6.854 6.909
130 6.909 6.964 7.019 7.074 7.129 7.184 7.239 7.294 7.349 7.404 7.459
140 7.459 7.514 7.569 7.624 7.679 7.734 7.789 7.844 7.900 7.955 8.010
4.4.2 RTD
Resistance Temperature Detectors (RTDs) rely on the predictable
and repeatable phenomena of the electrical resistance of metals changing
with temperature.
The temperature coefficient for all pure metals is of the same order
- 0.003 to 0.007 ohms/ohm/°C. The most common metals used for
temperature sensing are platinum, nickel, copper and molybdenum. While
the resistance - temperature characteristics of certain semiconductor and
52
54. Oil and Gas Measuring Instruments
ceramic materials are used for temperature sensing, such sensors are
generally not classified as RTDs.
4.4.2.1 How are RTD constructed?
RTDs are manufactured in two ways: using wire or film. Wire
RTDs are a stretched coil of fine wire placed in a ceramic tube that
supports and protects the wire. The wire may be bonded to the ceramic
using a glaze. The wire types are generally the more accurate, due to the
tighter control over metal purity and less strain related errors. They are
also more expensive.
Figure 4.12 RTD
Film RTDs consist of a thin metal film that is silk-screened or
vacuum spluttered onto a ceramic or glassy substrate. A laser trimmer
then trims the RTD to its correct resistance value.
Film sensors are less accurate than wire types, but they are
relatively inexpensive, they are available in small sizes and they are more
robust. Film RTDs can also function as a strain gauge - so don't strain
them! The alumina element should be supported by grease or a light
elastomer, but never embedded in epoxy or mechanically clamped
between hard surfaces.
53
55. Oil and Gas Measuring Instruments
Figure 4.13 Typical Sheath Mounted RTD Probe
RTDs cannot generally be used in their basic sensing element form,
as they are too delicate. They are usually built into some type of
assembly, which will enable them to withstand the various environmental
conditions to which they will be exposed when used. Most commonly this
is a stainless steel tube with a heat conducting grease (that also dampens
vibration). Standard tube diameters include 3, 4.5, 6, 8, 10, 12 and 15 mm
and standard tube lengths include 250, 300, 500, 750 and 1000 mm.
4.4.2.2 Characteristics of RTDs
Metal RTDs have a response defined by a polynomial:
R(t) = R0 ( 1 + a.t + b.t 2 + c.t 3 )
Where R0 is the resistance at 0°C, "t" in the temperature in Celsius, and
"a", "b" and "c" are constants dependent on the characteristics of the
metal. In practice this equation is a close but not perfect fit for most
RTDs, so slight modifications are often be made.
Commonly, the temperature characteristics of an RTD are specified
as a single number (the "alpha"), representing the average temperature
coefficient over the 0 to 100°C temperature range as calculated by:
54
56. Oil and Gas Measuring Instruments
alpha = ( R100 - R0 ) / 100 . R0 in ohms/ohm/°C
Note: RTDs cover a sufficient temperature range that their response needs
to be calibrated in terms of the latest temperature scale ITS90.
It is also of interest to note that the temperature coefficient of an
alloy is frequently very different from that of the constituent metals.
Small traces of impurities can greatly change the temperature
coefficients. Sometimes trace "impurities" are deliberately added so as to
swamp the effects of undesired impurities which are uneconomic to
remove. Other alloys can be tailored for particular temperature
characteristics. For example, an alloy of 84% copper, 12% Manganese
and 4% Nickel has the property of having an almost zero response to
temperature. The alloy is used for the manufacture of precision resistors.
4.4.2.3 Types RTDs
While almost any metal may be used for RTD manufacture, in
practice the number used is limited.
Temperature
Metal Alpha Comments
Range
Copper Pt -200°C to 260°C 0.00427 Low cost
0.00300 Lower cost alternative to platinum in the
Molybdenum Mo -200°C to 200°C
0.00385 lower temperature ranges
Nickel Ni -80°C to 260°C 0.00672 Low cost, limited temperature range
Ni-
Nickel - Iron -200°C to 200°C 0.00518 Low cost
Fe
0.00385
Platinum Pt -240°C to 660°C Good precision
0.00392
55
57. Oil and Gas Measuring Instruments
4.4.2.4 Platinum RTDs
Platinum is by far the most common RTD material, primarily
because of its long-term stability in air. There are two standard Platinum
sensor types, each with a different doping level of 'impurities'. To a large
extent there has been a convergence in platinum RTD standards, with
most national standards bodies adopting the international IEC751-1983,
with amendment 1 in 1986 and amendment 2 in 1995. The USA
continues to maintain its own standard.
All the platinum standards use a modified polynomial known as the
Callendar - Van Dusen equation:
R(t) = R0 ( 1 + a.t + b.t2 + c.(t - 100).t3 )
Platinum RTDs are available with two temperature coefficients or alphas
- the choice is largely based on the national preference in you country, as
indicated in the following table:
Alpha R0
Standard Polynomial Coefficients
ohms/ohm/°C ohms
200°C < t < 0°C
a = 3.90830x10⁻³
b = -5.77500x10⁻⁷
IEC751
0.00385055 100 c = -4.18301x10⁻¹²
(Pt100)
0°C < t < 850°C
a & b as above, but
c = 0.0
a = 3.97869x10⁻³
SAMA
0.0039200 98.129 b = -5.86863x10⁻⁷
RC-4
c = -4.16696x10⁻¹²
The international IEC 751 standard specifies tolerance classes as
indicated in the following table. While only Classes A and B are defined
in IEC 751, it has become common practice to extended the Classes to C
56
58. Oil and Gas Measuring Instruments
and D, which roughly double the previous error tolerance. The tolerance
classes are often applied to other RTD types.
Tolerance Class Tolerance Equation (°C)
Class A ± ( 0.15 + 0.002.| t | )
Class B ± ( 0.30 + 0.005. | t | )
Class C ± ( 0.40 + 0.009. | t | )
Class D ± ( 0.60 + 0.0018. | t | )
Where | t | indicated the magnitude of the temperature in Celsius (that is
sign is dropped). Some manufacturers further subdivide their RTD
Tolerance Classes into Tolerance Bands for greater choice in price
performance ratios.
4.4.2.6 Characteristics of Platinum RTDs
The IEC751 specifies a number of other characteristics - insulation
resistance, environmental protection, maximum thermoelectric effect,
vibration tolerance, lead marking and sensor marking. Some of these are
discussed below:
Thermoelectric Effect: Platinum RTD generally employs two metals -
the platinum sensing element and copper lead wires, making it a good
candidate for a thermocouple. If a temperature gradient is allows to
develop along the sensing element, a thermoelectric voltage with a
magnitude of about 7 µV /°C will be generated. This is only likely to be a
problem with very high-precision measurements operating at low
excitation currents.
Wiring Configurations and Lead Marking: There are three wiring
configurations that can be used for measuring resistance - 2, 3 and 4 wire
connections.
57
59. Oil and Gas Measuring Instruments
Figure 4.14 Wiring configurations
IEC751 requires that wires connected to the same end of the resistor be
the same colour - either red or white, and that the wires at each end be
different.
4.4.3 Thermistor
Thermistor temperature sensors are constructed from sintered metal
oxide in a ceramic matrix that changes electrical resistance with
temperature. They are sensitive but highly non-linear. Their sensitivity,
reliability, ruggedness and ease of use, has made them popular in research
application, but they are less commonly applied to industrial applications,
probably due to a lack on interchangeability between manufactures.
Thermistors are available in large range of sizes and base resistance
values (resistance at 25°C). Interchangeability is possible to ±0.05°C
although ±1°C is more common.
4.4.3.1 Thermistor construction
The most common form of the thermistor is a bead with two wires
attached. The bead diameter can range from about 0.5mm (0.02") to 5mm
(0.2'').
Figure 4.15Themistor
58
60. Oil and Gas Measuring Instruments
Mechanically the thermistor is simple and strong, providing the
basis for a high reliability sensor. The most likely failure mode is for the
lead to separate from the body of the thermistor - an unlikely event if the
sensor is mounted securely and with regard to likely vibration. The
sintered metal oxide material is prone to damage by moisture, so is
passivated by glass or epoxy encapsulation. If the encapsulation is
compromised and moisture penetrates, silver migration under the dc bias
can eventually cause shorting between the electrodes.
Like other temperature sensors, thermistors are often mounted in
stainless steel tubes, to protect them from the environment in which they
are to operate. Grease is typically used to improve the thermal contact
between the sensor and the tube.
4.4.3.2 Thermistor characteristics
The following are typical characteristic for the popular 44004
thermistor from YSI:
Parameter Specification
Resistance at 25°C 2252 ohms (100 to 1M available)
Measurement range -80 to +120°C typical (250°C max.)
Interchangeability (tolerance) ±0.1 or ±0.2°C
Stability over 12 months < 0.02°C at 25°C, < 0.25°C at 100°C
Time constant < 1.0 seconds in oil, < 60 seconds in still air
self-heating 0.13 °C/mW in oil, 1.0 °C/mW in air
Coefficients
a = 1.4733 x 10⁻³, b = 2.372 x 10⁻³, c = 1.074 x 10⁻⁷
(see Linearization below)
Dimensions ellipsoid bead 2.5mm x 4mm
59
61. Oil and Gas Measuring Instruments
4.4.4 Semiconductor
The semiconductor (or IC for integrated circuit) temperature sensor
is an electronic device fabricated in a similar way to other modern
electronic semiconductor components such as microprocessors. Typically
hundreds or thousands of devices are formed on thin silicon wafers.
Before the wafer is scribed and cut into individual chips, they are usually
laser trimmed. Semiconductor temperature sensors are available from a
number of manufacturers. There are no generic types as with
thermocouple and RTDs, although a number of devices are made by more
than one manufacturer. The AD590 and the LM35 have traditionally been
the most popular devices, but over the last few years better alternatives
have become available.
These sensors share a number of characteristics - linear outputs,
relatively small size, limited temperature range (-40 to +120°C typical),
low cost, good accuracy if calibrated but also poor interchangeability.
Often the semiconductor temperature sensors are not well designed
thermally, with the semiconductor chip not always in good thermal
contact with an outside surface. Some devices are inclined to oscillate
unless precautions are taken. Provided the limitations of the
semiconductor temperature sensors are understood, they can be used
effectively in many applications. The most popular semiconductor
temperature sensors are based on the fundamental temperature and
current characteristics of the transistor. If two identical transistors are
operated at different but constant collector current densities, then the
difference in their base-emitter voltages is proportional to the absolute
temperature of the transistors. This voltage difference is then converted to
a single ended voltage or a current. An offset may be applied to convert
the signal from absolute temperature to Celsius or Fahrenheit.
60
62. Oil and Gas Measuring Instruments
In general, the semiconductor temperature sensor is best suited for
embedded applications - that is, for use within equipment. This is because
they tend to be electrically and mechanically more delicate than most
other temperature sensor types. However they do have legitimate
application in many areas, hence their inclusion.
4.5 Level Sensing Elements
4.5.1 Radar Tank Gauging
Figure 4.16 RTG
FMCW radar principle and FFT signal analysis, (FMCW =
frequency-modulated continuous wave). A radar signal is emitted from an
antenna, reflected from the target (in this case, the product surface) and
received back after a delay interval t. The distance of the reflecting
product surface is measured by way of the transit time t of the microwave
signal: for every meter from a target the waves travel a distance of 2 m,
61
63. Oil and Gas Measuring Instruments
for which they require a time of approx. 6.7 ns. In general, the measured
distance is a = c x t / 2; where c = the speed of light.
The FMCW radar system uses a linear frequency-modulated high-
frequency signal; transmission frequency increases linearly within a time
interval (frequency sweep). Since the transmission frequency changes due
to the time delay during signal propagation, a low-frequency signal
(typically, up to a few kHz), the frequency f of which is proportional to
the reflector distance a, is obtained from the difference between the
current transmission frequency and the received frequency. The product
level is then computed from the difference between tank height and
distance.
Figure 4.17 RTG Signalling
62
64. Oil and Gas Measuring Instruments
4.5.2 Vibrating Fork
A piezoelectric crystal operated Vibrating Fork type level switch
for detection of level of powders / granules / solids in the hoppers, bins
and silos, etc.
Figure 4.18 Vibrating fork
4.5.3 LVDT
The letters LVDT are an acronym for Linear Variable
Differential Transformer, a common type of electromechanical
transducer that can convert the rectilinear motion of an object to which it
is coupled mechanically into a corresponding electrical signal. LVDT
linear position sensors are readily available that can measure movements
as small as a few millionths of an inch up to several inches, but are also
capable of measuring positions up to ±20 inches (±0.5 m).
Figure 4.19 LVDT Core
63
65. Oil and Gas Measuring Instruments
The figure (4.19) shows the components of a typical LVDT. The
transformer's internal structure consists of a primary winding centered
between a pair of identically wound secondary windings, symmetrically
spaced about the primary. The coils are wound on a one-piece hollow
form of thermally stable glass reinforced polymer, encapsulated against
moisture, wrapped in a high permeability magnetic shield, and then
secured in cylindrical stainless steel housing. This coil assembly is
usually the stationary element of the position sensor.
The moving element of an LVDT is a separate tubular armature of
magnetically permeable material called the core, which is free to move
axially within the coil's hollow bore, and mechanically coupled to the
object whose position is being measured. This bore is typically large
enough to provide substantial radial clearance between the core and bore,
with no physical contact between it and the coil.
In operation, the LVDT's primary winding is energized by alternating
current of appropriate amplitude and frequency, known as the primary
excitation. The LVDT's electrical output signal is the differential AC
voltage between the two secondary windings, which varies with the axial
position of the core within the LVDT coil. Usually this AC output voltage
is converted by suitable electronic circuitry to high level DC voltage or
current that is more convenient to use.
4.5.3.1 Advantages
LVDTs have certain significant features and benefits, most of
which derive from its fundamental physical principles of operation or
from the materials and techniques used in its construction.
Friction-Free Operation
64
66. Oil and Gas Measuring Instruments
One of the most important features of an LVDT is its friction-free
operation. In normal use, there is no mechanical contact between the
LVDT's core and coil assembly, so there is no rubbing, dragging or other
source of friction. This feature is particularly useful in materials testing,
vibration displacement measurements, and high resolution dimensional
gauging systems.
Infinite Resolution
Since an LVDT operates on electromagnetic coupling principles in a
friction-free structure, it can measure infinitesimally small changes in
core position. This infinite resolution capability is limited only by the
noise in an LVDT signal conditioner and the output display's resolution.
These same factors also give an LVDT its outstanding repeatability.
Unlimited Mechanical Life
Because there is normally no contact between the LVDT's core and coil
structure, no parts can rub together or wear out. This means that an LVDT
features unlimited mechanical life. This factor is especially important in
high reliability applications such as aircraft, satellites and space vehicles,
and nuclear installations. It is also highly desirable in many industrial
process control and factory automation systems.
Over travel Damage Resistant
The internal bore of most LVDTs is open at both ends. In the event of
unanticipated over travel, the core is able to pass completely through the
sensor coil assembly without causing damage. This invulnerability to
position input overload makes an LVDT the ideal sensor for applications
like extensometers that are attached to tensile test samples in destructive
materials testing apparatus.
Single Axis Sensitivity
An LVDT responds to motion of the core along the coil's axis, but is
generally insensitive to cross-axis motion of the core or to its radial
65
67. Oil and Gas Measuring Instruments
position. Thus, an LVDT can usually function without adverse effect in
applications involving misaligned or floating moving members, and in
cases where the core doesn't travel in a precisely straight line.
Separable Coil And Core
Because the only interaction between an LVDT's core and coil is
magnetic coupling, the coil assembly can be isolated from the core by
inserting a non-magnetic tube between the core and the bore. By doing
so, a pressurized fluid can be contained within the tube, in which the core
is free to move, while the coil assembly is depressurized. This feature is
often utilized in LVDTs used for spool position feedback in hydraulic
proportional and/or servo valves.
Environmentally Robust
The materials and construction techniques used in assembling an LVDT
result in a rugged, durable sensor that is robust to a variety of
environmental conditions. Bonding of the windings is followed by epoxy
encapsulation into the case, resulting in superior moisture and humidity
resistance, as well as the capability to take substantial shock loads and
high vibration levels in all axes. And the internal high-permeability
magnetic shield minimizes the effects of external AC fields.
Both the case and core are made of corrosion resistant metals, with the
case also acting as a supplemental magnetic shield. And for those
applications where the sensor must withstand exposure to flammable or
corrosive vapors and liquids, or operate in pressurized fluid, the case and
coil assembly can be hermetically sealed using a variety of welding
processes.
Ordinary LVDTs can operate over a very wide temperature range, but, if
required, they can be produced to operate down to cryogenic
temperatures, or, using special materials, operate at the elevated
temperatures and radiation levels found in many nuclear reactors.
66
68. Oil and Gas Measuring Instruments
Null Point Repeatability
The location of an LVDT's intrinsic null point is extremely stable and
repeatable, even over its very wide operating temperature range. This
makes an LVDT perform well as a null position sensor in closed-loop
control systems and high-performance servo balance instruments.
Fast Dynamic Response
The absence of friction during ordinary operation permits an LVDT to
respond very fast to changes in core position. The dynamic response of an
LVDT sensor itself is limited only by the inertial effects of the core's
slight mass. More often, the response of an LVDT sensing system is
determined by characteristics of the signal conditioner.
Absolute Output
An LVDT is an absolute output device, as opposed to an incremental
output device. This means that in the event of loss of power, the position
data being sent from the LVDT will not be lost. When the measuring
system is restarted, the LVDT's output value will be the same as it was
before the power failure occurred.
4.5.3.2 Theory of Operation
This figure illustrates what happens when the LVDT's core is in
different axial positions. The LVDT's primary winding, P, is energized by
a constant amplitude AC source. The magnetic flux thus developed is
coupled by the core to the adjacent secondary windings, S1 and S2 . If the
core is located midway between S1 and S2 , equal flux is coupled to each
secondary so the voltages, E1 and E2 , induced in windings S1 and S2
respectively, are equal. At this reference midway core position, known as
the null point, the differential voltage output, (E1 - E2), is essentially
zero.
67
69. Oil and Gas Measuring Instruments
Figure 4.20 LVDT Signalling
If the core is moved closer to S1 than to S2 , more flux is coupled to S1
and less to S2 , so the induced voltage E1 is increased while E2 is
decreased, resulting in the differential voltage (E1 - E2). Conversely, if
the core is moved closer to S2 , more flux is coupled to S2 and less to S1 ,
so E2 is increased as E1 is decreased, resulting in the differential voltage
(E2 - E1 ). The top graph shows how the magnitude of the differential
output voltage, EOUT, varies with core position. The value of EOUT at
maximum core displacement from null depends upon the amplitude of the
primary excitation voltage and the sensitivity factor of the particular
LVDT, but is typically several volts RMS. The phase angle of this AC
output voltage, EOUT, referenced to the primary excitation voltage, stays
constant until the center of the core passes the null point, where the phase
angle changes abruptly by 180 degrees, as shown in the middle graph.
This 180 degree phase shift can be used to determine the direction of the
core from the null point by means of appropriate circuitry. This is shown
in the bottom graph, where the polarity of the output signal represents the
core's positional relationship to the null point. The figure shows also that
68
70. Oil and Gas Measuring Instruments
the output of an LVDT is very linear over its specified range of core
motion, but that the sensor can be used over an extended range with some
reduction in output linearity. The output characteristics of an LVDT vary
with different positions of the core. Full range output is a large signal,
typically a volt or more, and often requires no amplification. Note that an
LVDT continues to operate beyond 100% of full range, but with degraded
linearity.
4.5.4 Servo Motor
A micro-controller based multi-function instrument for precision
level measurement of liquids stored in Cone Roof, Floating Roof tanks,
pressurized Spheres, Mounded Vessels, Bullets and Cryogenic storage
tanks.
Figure 4.21 Servo-motor Type
4.5.5 Pressure Sensing Type
In this type of level gauging, the pressure or differential pressure is
measured converted to level by the following equation.
69
71. Oil and Gas Measuring Instruments
P g (h2 h1 )
If the tank is open to atmosphere the pressure at the bottom is indication
of level. In closed tanks, differential pressure is the measurand that
indicates the level. The linkage may be direct, liquid filled or sealed
liquid filled.
Figure 4.22 Pressure sensing Type
4.6 Vibration Sensing
4.6.1 Inductive Sensor (Eddy Current)
Inductive sensors use currents induced by magnetic fields to detect
nearby metal objects. The inductive sensor uses a coil (an inductor) to
generate a high frequency magnetic field as shown in Figure 4.23. If there
is a metal object near the changing magnetic field, current will flow in the
object. This resulting current flow sets up a new magnetic field that
opposes the original magnetic field. The net effect is that it changes the
70
72. Oil and Gas Measuring Instruments
inductance of the coil in the inductive sensor. By measuring the
inductance the sensor can determine when a metal have been brought
nearby. These sensors will detect any metals, when detecting multiple
types of metal multiple sensors are often used.
Figure 4.23 Inductive Sensor
The sensors can detect objects a few centimeters away from the
end. But, the direction to the object can be arbitrary as shown in Figure
4.24. The magnetic field of the unshielded sensor covers a larger volume
around the head of the coil. By adding a shield (a metal jacket around the
sides of the coil) the magnetic field becomes smaller, but also more
directed. Shields will often be available for inductive sensors to improve
their directionality and accuracy.
Figure 4.24 Shielded and Unshielded
71
73. Oil and Gas Measuring Instruments
4.7 Role Play
Each Trainee should speak thoroughly about one of the electrical
transducers for
Pressure.
Temperature.
Level Gauging and Vibration Sensing.
72
74. Oil and Gas Measuring Instruments
Chapter 5
Flow Measurement
5.1 Learning Objectives
1. Review basic properties of fluid flow.
2. To understand the theory of operation of different flow meters.
3. Select the optimum meter according to the application.
4. To avoid pitfalls in flow metering.
5.2 Basic Principles of Fluid Flow and Measurement
5.2.1 Density and Specific Volume
The density of a fluid is the ratio of its mass to its volume. Its
specific volume is the reciprocal of its density. The density of water is
roughly 1000 times that of air at atmospheric pressure.
M
V
5.2.2 Thermal Expansion Coefficient
The thermal expansion coefficient, , is the fractional increase in
specific volume, Vs, caused by a temperature increase of 1 degree.
1 dVs
Vs dT
73
75. Oil and Gas Measuring Instruments
5.2.3 Compressibility
The compressibility of a fluid, , is the fractional decrease in
specific volume caused by unit increase of pressure.
1 dVs
Vs dP
5.2.4 Viscosity
The viscosity, , of a fluid is a measure of its resistance to shearing
at a constant rate.
where is the shear stress and is the rate of shear strain. The SI unit of
viscosity is Pascal second, but it is usual to express it in centipoises, cP,
where one cP being 0.001 Pa s. Viscosity is referred to as absolute or
dynamic viscosity to distinguish it from kinematics viscosity, , which is
the ratio of viscosity to density. The Si unit of which is m 2 s-1 and
commonly known by centistokes, cSt, where one cSt being 10 -6 m2 s-1.
5.2.5 Air Solubility of Liquids
Air is soluble in liquids, and its solubility is directly proportional to
the absolute pressure. The solubility decreases markedly as the
temperature of the water increases. It is very much soluble in
hydrocarbons where the solubility is not decreased much with increasing
temperature, until quite high temperatures are reached.
74
76. Oil and Gas Measuring Instruments
5.2.6 Humidity in gases
Gases may be either dry or humid. This is because a gas at a given
temperature is capable of holding a certain maximum amount of water
vapor; this value increases with temperature increase. The relative
humidity is defined as the ratio of the actual partial pressure of the water
vapor to the value of partial pressure that would exist under saturated
conditions at the same temperature.
Sudden changes in humidity may cause errors in gas flow
measurement. In particular, errors easily occur if unsaturated gas is
passed through a wet gas meter, or if a sudden expansion cools a gas
sufficiently to cause precipitation of some of its water vapor.
5.2.7 Reynolds Number
The behavior of fluids flowing through pipes is governed by a
quantity known as Reynolds number which is defined by
vD
Re D
where v is the mean velocity and D is the pipe diameter. The numerator is
a measure of the flowing fluid's ability to generate a dynamic forces,
while the denominator is a measure of its ability to generate viscous
forces. This means that Reynolds number indicates which kind of forces
predominate the flowing fluid.
5.2.8 Laminar and Turbulent Flow
Laminar flow occurs at Reynolds numbers below about 2000. This
can be likened to the flow of traffic on a busy motorway, with the traffic
75