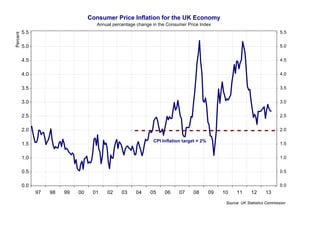
The document examines trends in consumer price inflation in the UK economy over time. It shows that inflation has varied from just under 1% to slightly over 5% since 1997, with an inflation target of 2% set by the Bank of England. Various charts break down inflation trends for different goods and services, as well as public expectations for future inflation. Housing, fuel and food costs make up a significant proportion of the weighted Consumer Price Index. Crude oil prices are also seen to correlate with changes in overall consumer price inflation.
Quarterly growth and levels of GDP for the UK
CPI 12-month inflation rate for the last 10 years: September 2006 to September 2016
Male and Female Employment Rates in the UK
Non-UK nationals working in the UK labour market
Components of Aggregate Demand in recent years
UK unemployment rates by region, seasonally adjusted, June to August 2016
Average UK house price, January 2005 to August 2016, not seasonally adjusted
Constant price GDP per hour worked for G7 countries, 2000 to 2015
Quarterly growth of GDP and GDP per head for UK
Economic Growth for the UK and the EU(28)
UK Bond Yields during 2016
Sterling Exchange Rate (as an index number)
UK Trade Balances By Sector (% of GDP)
UK Current Account Components (% of GDP)
Contributions to CPI Inflation (%)
In this short revision video, we look at the substantial productivity gap between the UK and many of the UK’s major competitor countries.
Paul Krugman, the Nobel Prize-winning economist said twenty fives years ago that “Productivity isn’t everything, but in the long run it is almost everything,”
Modelling Investment - Forecasts for the UK Economy 2016John Ashcroft
Modelling Investment - Forecasts for the UK Economy 2016. Published in association with the December Economic Outlook, we outline our sectoral forecasts of investment in the UK
A short presentation looking at key economic indicators in the UK economy.
Covers:
UK GDP: the level and the % below pre downturn level
Compares how GDP recovered in past downturns to how it is recovering from the most recent one.
'Lost Output'
Output from the 3 main sectors of the economy: services, production and construction.
The Labour Market:
Employment
Hours worked
Wages and Prices
Public Sector Debt
House Prices
Follow @statshan on twitter, teaching with statistics on FB and find more resources from me on the TES website.
Please let me know what you think as I would like to make these regular presentations if they are seen as useful.
This is a presentation on aspects of the recent performance of the UK economy. All students are expected to have a good contextual knowledge of recent trends in indicators such as economic growth, inflation, unemployment, the trade balance, interest rates and government borrowing.
The saturday economist uk economic outlook march 2016John Ashcroft
The Saturday Economist : UK Economic Outlook March 2016, Drink with me to days gone by : Service Sector (Leisure Sector) continues to drive output in the UK economy, We expect GDP growth of 2.6% this year slowing to 2.5% in 2017.
There is a lot of concern about the sustainability of the economic recovery. As a result, the Belgian Federal Planning Bureau revised its GDP growth forecast 2014 downwards.
What can we expect ?
Latvijas Bankas ekonomistes Santas Bērziņas un Ievas Opmanes prezentācija sanāksmē ar starptautisko reitinga aģentūru "Moody's Investors Service" 2022. gada 24. martā.
The Saturday Economist UK Economic Outlook December 2015John Ashcroft
The Saturday Economist, UK Economic Outlook December 2015 is out now. We have lowered our forecasts for growth in 2015 and 2016. Check out over twenty pages of analysis
The Saturday Economist, UK Economic Outlook June 2016John Ashcroft
Growth in 2015 was 2.3% down from 2.9% in 2014. We now expect growth of 2.2% in 2016 … following the disappointing performance of manufacturing and construction in the first quarter.
The inflation outlook is still muted, with the fall in world oil, energy, food and commodity prices continuing to dominate headline inflation.
The UK economy grew by 2.0% in the first quarter, revisions to construction and manufacturing growth pulling total output lower. The service sector continues to drive growth.
In this June economics update we forecast world growth of 3.2% in 2016 up from 3.1% in 2015. UK Inflation will average just 0.3%, CPI basis, over the balance of the year 2016. Unemployment will continue to fall, government borrowing will also fall. The service sector will lead the recovery as manufacturing and construction output falls slightly.
We are forecasting a modest fall in manufacturing of around 0.2% in 2016 with a 0.9% fall in construction activity based on the latest data. The trade figures will continue to disappoint, offset by a further £2 billion oil dividend, despite a moderate oil price recovery. The challenge to the current account following the drop in overseas investment income continues and will present a significant problem to the outlook for sterling over the medium term.
Our forecast is based on a "remain" referendum outcome! .
This ppt is of subject called Elements of Corporate Finance .
it include the information about the OPEC , reasons , some current information about crude oil and major suppliers of crude oil to india( 2015)
GROWTH FACTORS AND CHALLENGES FOR OIL MARKET; Demographic Factors; Oil Demand; Motorization in Asian Countries; Upstream Costs Increase; US Shale Oil Production; Deepwater Production; Iraqi production growth prospects; GTL – challenge for the oil market after 2020
One of the most significant roles of a modern government is to ensure that the economy performs to its full capacity.
The government has to consider the performance indicators like inflation, unemployment and economic growth and devise policies to achieve their aims. In this session we will consider the options that fall into the fiscal and monetary policy
portfolio.
AS Macro Economics: Economic Cycle and Objectivestutor2u
In this session we are going to focus on the performance of
the UK economy over recent years and see how economic
growth appears to follow a cyclical pattern
A2 Essay Exam Skills - Common External Tariffs in the EUtutor2u
This is an example of a colour coded approach to writing an exam essay for A2 macro on the impact on consumers and producers of the common external tariff which is part of the EU's customs union.
These slides are from our January 2014 revision workshops for unit 3 microeconomics. They focus on some of the arguments surrounding the possible introduction of a £7 per hour national minimum wage in the UK
Students should be able to:
Understand the characteristics of this market structure with particular reference to the interdependence of firms
Explain the behaviour of firms in this market structure
Explain reasons for collusive and non-collusive behaviour
Evaluate the reasons why firms may wish to pursue both overt and tacit collusion
Students should be able to:
Understand the distinction between normal and supernormal profit
Explain and illustrate the concept of profit maximisation using marginal cost and marginal revenue
Welcome to the monthly economic forum. Here we will be showcasing the latest economic and social developments with a wide range of analytic topics. Each month we will feature 'State of the Economy', providing a stocktake of the latest trends and developments.
Presentations this month include:
New estimates of core inflation - trimmed mean CPI
The Impact of the Coronavirus Pandemic on UK GDP
International Trade Flows of G7 Economies
We also welcome Fergal Shortall, Director of Monetary Analysis, Bank of England who will be providing a welcome to the forum.
The Economy: Getting Through The Recession (updated)Savannah Whaley
We are in a deep and protracted recession that began in the fourth quarter of 2007. It began in housing and has spread through the entire U.S. and overseas economies. Economic weakness has intensified through 2008 and will worsen through the first half of 2009.
The overall measure of consumer confidence increased by three percentage points in Q3 to -5, a five year high and its largest increase quarter-on-quarter.
The headline CPI (for all urban areas) annual inflation rate in September 2015 was 4,6%. This rate was the same as the corresponding annual rate of 4,6% in August 2015. On average, prices were unchanged between August 2015 and September 2015.
This is a revision presentation on the state of the UK economy five months on from the June 23rd Brexit vote.
Overview:
Post-Brexit impact yet to fully materialize in the macro data
Inflation is back with rising commodity prices and a weaker currency since June 2016
Labour market performance remains strong
But scale of UK current account deficit is a problem
Structural weaknesses on the UK supply-side are unlikely to be resolved soon despite renewed focus on infrastructure and industrial policy in the new May/Hammond government
Productivity and skills gaps hurt UK competitiveness
Risk is that Brexit will lower the UK’s trend growth rate if the economy is not “match-fit” post 2019
Lots of external uncertainties as we head into 2017
Webinar by E&C America Inc.
Energy Procurement: How risk management can benefit your company
Watch the recording of the webinar here:http://youtu.be/QG6WY6ebTlc
Inspirational presentation from Nick Parsons,Head of Research, UK and Europe and Global Head FX Strategy | Wholesale Banking | National Australia Bank Limited
What is the UK economic and property market outlook? A presentation I gave in Birmingham in June 2011 when I was Head of EMEA Research at Jones Lang LaSalle (now JLL).
In this revision presentation we look at recent trends in UK trade union membership, consider how trade unions can affect both pay and employment and challenge the textbook view that union-negotiated pay increases inevitably have negative consequences for employment.
In this revision presentation we cover key examples of pure and quasi public goods and consider the arguments for and against an increase in government spending on public goods.
Poverty Reduction Policies in Low Income Countriestutor2u
This revision presentation covers some of the main causes of continued high levels of extreme poverty in low and middle income countries and considers a range of pro-poor government interventions designed to increase productivity and regular employment and waged income in formal labour markets.
You don’t need to produce a lot of evidence in your macroeconomics exams but knowing some basic and key facts and figures can make your answers stand out from the crowd! Here is a quickfire journey through twenty important economic numbers that won’t change before the exam – use them to support your answer and impress the examiner!
Microeconomics - Great Applied Examples for Examstutor2u
In this presentation, I have chosen loads of current examples that you might want to use as context in your microeconomics exams. We look at examples from different market structures, recent mergers and takeovers, the world's most valuable companies, the largest employer, unicorn business, de-mergers, the biggest initial public offerings (IPOs) and much else. Hopefully a useful video to go through to add some super examples into your revision notes.
This revision presentation considers the variety of stakeholders impacted by business activity. How will a change in objectives, such as a move from profit maximisation to revenue maximisation have an effect on different stakeholders?
This revision presentation looks at profit satisficing as an alternative objective for businesses. Why might firms satisfice? What are some of the possible consequences for economic welfare and efficiency?
In this presentation we consider the theory of wage-setting with a monopsony employer and the possible impact that a trade union might have on wages and employment. We also look at efficiency wage theory and mutual gains from pay bargaining between stakeholders.
For many economists, the labour market is the most important market of all to study, analyse and evaluate. Like product markets for goods and services, labour markets can also fail. The main types of labour market failure are labour immobility including skills gaps, inequality, disincentives to be economically active, labour market discrimination and the effects of monopsony power of employers.
Updated revision presentation on aspects of behavioural economics and topical issues where behavioural nudges are being used to change the choices of consumers and businesses.
UiPath Test Automation using UiPath Test Suite series, part 4DianaGray10
Welcome to UiPath Test Automation using UiPath Test Suite series part 4. In this session, we will cover Test Manager overview along with SAP heatmap.
The UiPath Test Manager overview with SAP heatmap webinar offers a concise yet comprehensive exploration of the role of a Test Manager within SAP environments, coupled with the utilization of heatmaps for effective testing strategies.
Participants will gain insights into the responsibilities, challenges, and best practices associated with test management in SAP projects. Additionally, the webinar delves into the significance of heatmaps as a visual aid for identifying testing priorities, areas of risk, and resource allocation within SAP landscapes. Through this session, attendees can expect to enhance their understanding of test management principles while learning practical approaches to optimize testing processes in SAP environments using heatmap visualization techniques
What will you get from this session?
1. Insights into SAP testing best practices
2. Heatmap utilization for testing
3. Optimization of testing processes
4. Demo
Topics covered:
Execution from the test manager
Orchestrator execution result
Defect reporting
SAP heatmap example with demo
Speaker:
Deepak Rai, Automation Practice Lead, Boundaryless Group and UiPath MVP
Connector Corner: Automate dynamic content and events by pushing a buttonDianaGray10
Here is something new! In our next Connector Corner webinar, we will demonstrate how you can use a single workflow to:
Create a campaign using Mailchimp with merge tags/fields
Send an interactive Slack channel message (using buttons)
Have the message received by managers and peers along with a test email for review
But there’s more:
In a second workflow supporting the same use case, you’ll see:
Your campaign sent to target colleagues for approval
If the “Approve” button is clicked, a Jira/Zendesk ticket is created for the marketing design team
But—if the “Reject” button is pushed, colleagues will be alerted via Slack message
Join us to learn more about this new, human-in-the-loop capability, brought to you by Integration Service connectors.
And...
Speakers:
Akshay Agnihotri, Product Manager
Charlie Greenberg, Host
Dev Dives: Train smarter, not harder – active learning and UiPath LLMs for do...UiPathCommunity
💥 Speed, accuracy, and scaling – discover the superpowers of GenAI in action with UiPath Document Understanding and Communications Mining™:
See how to accelerate model training and optimize model performance with active learning
Learn about the latest enhancements to out-of-the-box document processing – with little to no training required
Get an exclusive demo of the new family of UiPath LLMs – GenAI models specialized for processing different types of documents and messages
This is a hands-on session specifically designed for automation developers and AI enthusiasts seeking to enhance their knowledge in leveraging the latest intelligent document processing capabilities offered by UiPath.
Speakers:
👨🏫 Andras Palfi, Senior Product Manager, UiPath
👩🏫 Lenka Dulovicova, Product Program Manager, UiPath
Software Delivery At the Speed of AI: Inflectra Invests In AI-Powered QualityInflectra
In this insightful webinar, Inflectra explores how artificial intelligence (AI) is transforming software development and testing. Discover how AI-powered tools are revolutionizing every stage of the software development lifecycle (SDLC), from design and prototyping to testing, deployment, and monitoring.
Learn about:
• The Future of Testing: How AI is shifting testing towards verification, analysis, and higher-level skills, while reducing repetitive tasks.
• Test Automation: How AI-powered test case generation, optimization, and self-healing tests are making testing more efficient and effective.
• Visual Testing: Explore the emerging capabilities of AI in visual testing and how it's set to revolutionize UI verification.
• Inflectra's AI Solutions: See demonstrations of Inflectra's cutting-edge AI tools like the ChatGPT plugin and Azure Open AI platform, designed to streamline your testing process.
Whether you're a developer, tester, or QA professional, this webinar will give you valuable insights into how AI is shaping the future of software delivery.
UiPath Test Automation using UiPath Test Suite series, part 3DianaGray10
Welcome to UiPath Test Automation using UiPath Test Suite series part 3. In this session, we will cover desktop automation along with UI automation.
Topics covered:
UI automation Introduction,
UI automation Sample
Desktop automation flow
Pradeep Chinnala, Senior Consultant Automation Developer @WonderBotz and UiPath MVP
Deepak Rai, Automation Practice Lead, Boundaryless Group and UiPath MVP
Let's dive deeper into the world of ODC! Ricardo Alves (OutSystems) will join us to tell all about the new Data Fabric. After that, Sezen de Bruijn (OutSystems) will get into the details on how to best design a sturdy architecture within ODC.
DevOps and Testing slides at DASA ConnectKari Kakkonen
My and Rik Marselis slides at 30.5.2024 DASA Connect conference. We discuss about what is testing, then what is agile testing and finally what is Testing in DevOps. Finally we had lovely workshop with the participants trying to find out different ways to think about quality and testing in different parts of the DevOps infinity loop.
State of ICS and IoT Cyber Threat Landscape Report 2024 previewPrayukth K V
The IoT and OT threat landscape report has been prepared by the Threat Research Team at Sectrio using data from Sectrio, cyber threat intelligence farming facilities spread across over 85 cities around the world. In addition, Sectrio also runs AI-based advanced threat and payload engagement facilities that serve as sinks to attract and engage sophisticated threat actors, and newer malware including new variants and latent threats that are at an earlier stage of development.
The latest edition of the OT/ICS and IoT security Threat Landscape Report 2024 also covers:
State of global ICS asset and network exposure
Sectoral targets and attacks as well as the cost of ransom
Global APT activity, AI usage, actor and tactic profiles, and implications
Rise in volumes of AI-powered cyberattacks
Major cyber events in 2024
Malware and malicious payload trends
Cyberattack types and targets
Vulnerability exploit attempts on CVEs
Attacks on counties – USA
Expansion of bot farms – how, where, and why
In-depth analysis of the cyber threat landscape across North America, South America, Europe, APAC, and the Middle East
Why are attacks on smart factories rising?
Cyber risk predictions
Axis of attacks – Europe
Systemic attacks in the Middle East
Download the full report from here:
https://sectrio.com/resources/ot-threat-landscape-reports/sectrio-releases-ot-ics-and-iot-security-threat-landscape-report-2024/
"Impact of front-end architecture on development cost", Viktor TurskyiFwdays
I have heard many times that architecture is not important for the front-end. Also, many times I have seen how developers implement features on the front-end just following the standard rules for a framework and think that this is enough to successfully launch the project, and then the project fails. How to prevent this and what approach to choose? I have launched dozens of complex projects and during the talk we will analyze which approaches have worked for me and which have not.
GraphRAG is All You need? LLM & Knowledge GraphGuy Korland
Guy Korland, CEO and Co-founder of FalkorDB, will review two articles on the integration of language models with knowledge graphs.
1. Unifying Large Language Models and Knowledge Graphs: A Roadmap.
https://arxiv.org/abs/2306.08302
2. Microsoft Research's GraphRAG paper and a review paper on various uses of knowledge graphs:
https://www.microsoft.com/en-us/research/blog/graphrag-unlocking-llm-discovery-on-narrative-private-data/
PHP Frameworks: I want to break free (IPC Berlin 2024)Ralf Eggert
In this presentation, we examine the challenges and limitations of relying too heavily on PHP frameworks in web development. We discuss the history of PHP and its frameworks to understand how this dependence has evolved. The focus will be on providing concrete tips and strategies to reduce reliance on these frameworks, based on real-world examples and practical considerations. The goal is to equip developers with the skills and knowledge to create more flexible and future-proof web applications. We'll explore the importance of maintaining autonomy in a rapidly changing tech landscape and how to make informed decisions in PHP development.
This talk is aimed at encouraging a more independent approach to using PHP frameworks, moving towards a more flexible and future-proof approach to PHP development.
PHP Frameworks: I want to break free (IPC Berlin 2024)
Inflation charts
1. Consumer Price Inflation for the UK Economy
Percent
Annual percentage change in the Consumer Price Index
5.5
5.5
5.0
5.0
4.5
4.5
4.0
4.0
3.5
3.5
3.0
3.0
2.5
2.5
2.0
2.0
CPI Inflation target = 2%
1.5
1.5
1.0
1.0
0.5
0.5
0.0
0.0
97
98
99
00
01
02
03
04
05
06
07
08
09
10
11
12
13
Source: UK Statistics Commission
2. Inflation Expectations
Bank of England/NOP, how do you expect prices to change over the next 12 months?
6.0
5.0
5.0
4.0
Percent
6.0
4.0
3.0
3.0
2.0
2.0
1.0
1.0
0.0
0.0
Q1
Q3
Q1
Q3
Q1
Q3
Q1
Q3
Q1
Q3
Q1
Q3
06
07
08
09
10
11
How do you expect prices to change over the next 12 months?
United Kingdom, Consumer Prices, By Commodity, All items (CPI), Chg Y/Y
Q1
Q3
12
Q1
13
Source: Bank of England
3. Consumer Price Inflation in Europe and the UK
Percent
Annual percentage change in consumer prices
6
6
UK
5
5
4
4
3
3
2
2
1
1
Euro Zone
0
0
-1
-1
05
06
07
08
09
10
11
12
13
Source: Reuters EcoWin
4. Changing Real Prices for Goods and Services
Retail Price Index, January 1988 = 100
600
500
500
400
Index
600
400
Cigarettes
300
Rail fares
300
Repairs
200
200
All goods and services
Clothing and footwear
100
100
Electrical appliances
0
0
88 89 90 91 92 93 94 95 96 97 98 99 00 01 02 03 04 05 06 07 08 09 10 11 12 13
Source: Monthly Digest and Statistics
5. Electricity and Gas Prices compared with changes in the CPI
Index of consumer prices, 2005=100
250
250
225
225
200
200
Gas Prices
175
Index
175
150
150
Electricity Prices
125
125
Consumer Price Index (all items)
100
100
75
75
05
06
All items (CPI)
07
Gas
08
09
10
11
12
13
Electricity
Source: Reuters EcoWin
6. Consumer Price Inflation and Interest Rates for the UK
Annual percentage change in the UK Consumer Price Index, the inflation target is 2%
6
6
Base Interest Rates
5
5
Percent
4
4
3
3
2
2
Consumer Price Inflation
1
1
0
0
04
05
06
07
08
09
10
11
12
13
Source: Reuters EcoWin
9. Selected Weights in the UK Consumer Price Index
Total weights for the CPI = 1000. Source: Office of National Statistics
150
150
125
125
Housing, water and fuels
1996=100
100
100
Foods
75
75
Clothing and footwear
50
50
Alcohol, tobacco and narcotics
25
25
Education
0
0
03
04
05
06
07
08
09
10
11
12
13
Source: UK Statistics Commission
10. UK Inflation and Crude Oil Prices
Annual % change in the Consumer Price Index and the world crude price
US dollars per barrel of oil
150
150
Crude Oil Price
100
100
50
50
0
0
6.0
6.0
Consumer Price Inflation
5.0
4.0
Percent
5.0
4.0
3.0
3.0
2.0
2.0
1.0
1.0
0.0
0.0
07
08
09
10
11
12
13
Source: UK Statistics Commission and IPE