Download to read offline

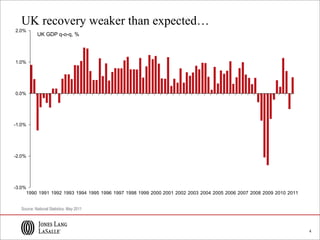
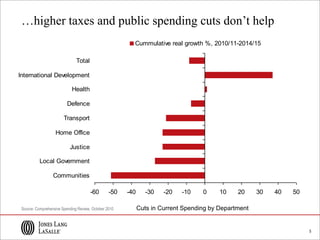
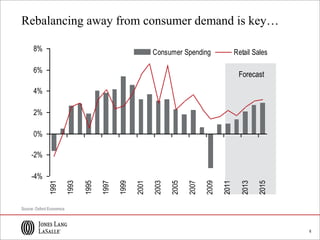
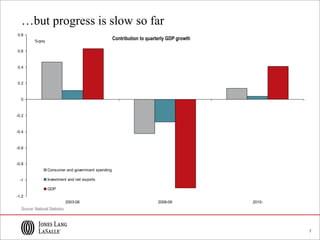
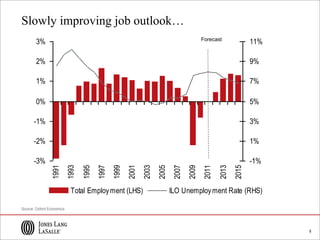
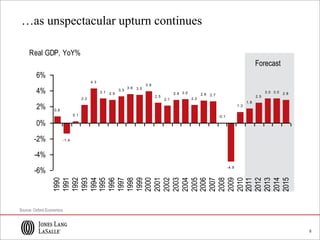
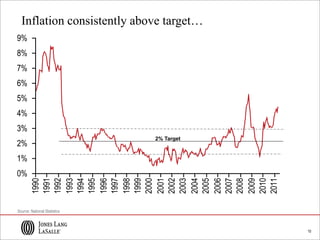
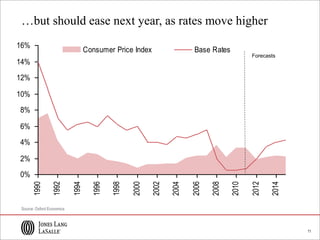
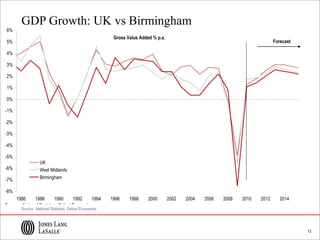
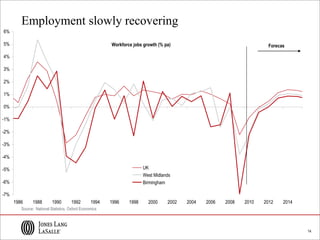
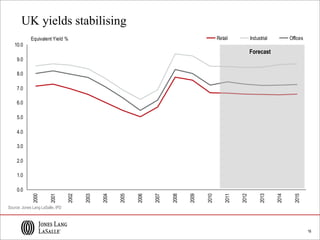
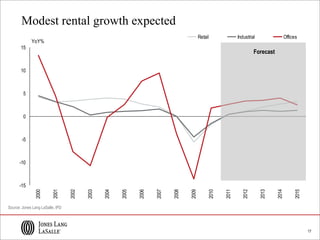
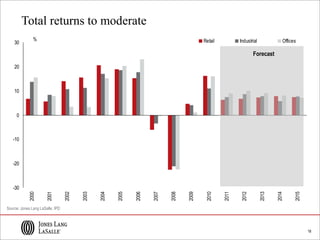
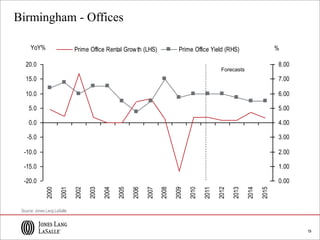
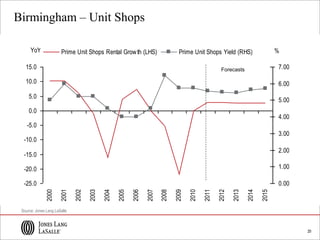
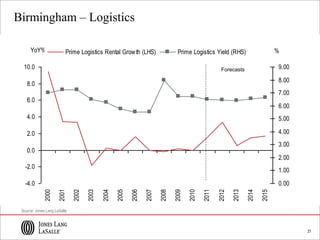

The document summarizes the current economic and property outlook for the UK and Birmingham region. It finds that the UK economic recovery has been weaker than expected, with output stagnating and inflation rising. Government spending cuts have also slowed the recovery. While employment is slowly improving, rebalancing the economy away from consumer demand to investment and exports is not happening quickly. For the Birmingham region specifically, GDP and employment growth have lagged the national levels but are also recovering gradually. Rental growth for offices, retail and logistics properties in Birmingham is expected to be modest in the near future.


