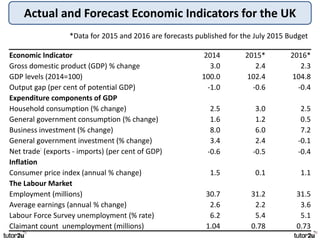
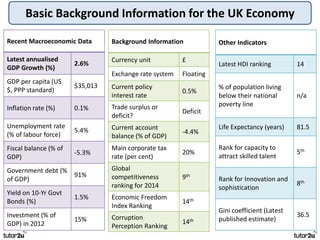
Introduction to the UK Economy
What are the key objectives of macroeconomic policy?
Price Stability (CPI
Inflation of 2%)
Growth of Real GDP
(National Output)
Falling Unemployment /
Raising Employment
Higher Average Living
Standards (national
income per capita)
Stable Balance of
Payments on the Current
Account
An Equitable Distribution
of Income and Wealth
Additional objectives of macroeconomic policy
Balancing the budget and
reducing the national debt
Improving economic
well-being
Better regional balance
in the UK economy
Improved access to
public services
Improved
competitiveness
Environmental
sustainability
Actual and Forecast Economic Indicators for the UK
*Data for 2015 and 2016 are forecasts published for the July 2015 Budget
Economic Indicator 2014 2015* 2016*
Gross domestic product (GDP) % change 3.0 2.4 2.3
GDP levels (2014=100) 100.0 102.4 104.8
Output gap (per cent of potential GDP) -1.0 -0.6 -0.4
Expenditure components of GDP
Household consumption (% change) 2.5 3.0 2.5
General government consumption (% change) 1.6 1.2 0.5
Business investment (% change) 8.0 6.0 7.2
General government investment (% change) 3.4 2.4 -0.1
Net trade:
(exports - imports) (per cent of GDP) -0.6 -0.5 -0.4
Inflation
Consumer price index (annual % change) 1.5 0.1 1.1
The Labour Market
Employment (millions) 30.7 31.2 31.5
Average earnings (annual % change) 2.6 2.2 3.6
Labour Force Survey unemployment (% rate) 6.2 5.4 5.1
Claimant count unemployment (millions) 1.04 0.78 0.73
Recent Macroeconomic Data
Latest annualised
GDP Growth (%)
2.6%
GDP per capita (US
$, PPP standard)
$35,013
Inflation rate (%) 0.1%
Unemployment rate
(% of labour force)
5.4%
Fiscal balance (% of
GDP)
-5.3%
Government debt (%
of GDP)
91%
Yield on 10-Yr Govt
Bonds (%)
1.5%
Investment (% of
GDP) in 2012
15%
Background Information
Currency unit £
Exchange rate system Floating
Current policy
interest rate
0.5%
Trade surplus or
deficit?
Deficit
Current account
balance (% of GDP)
-4.4%
Main corporate tax
rate (per cent)
20%
Global
competitiveness
ranking for 2014
9th
Economic Freedom
Index Ranking
14th
Corruption
Perception Ranking
14th
Other Indicators
Latest HDI ranking 14
% of population living
below their national
poverty line
n/a
Life Expectancy (years) 81.5
Rank for capacity to
attract skilled talent
5th
Rank for Innovation and
sophistication
8th
Gini coefficient (Latest
published estimate)
36.5
Basic Background Information for the UK Economy
-4.0%
-3.0%
-2.0%
-1.0%
0.0%
1.0%
2.0%
3.0%
4.0%
2006 2007 2008 2009 2010 2011 2012 2013 2014 2015 2016* 2017* 2018* 2019* 2020*
GDPgrowthratecomparedtopreviousyear
The chart shows real GDP growth for the UK from 2010-2014. Data for 2015 onwards
shows forecast growth using figures from the International Monetary Fund (IMF)
Source: ONS
The UK Economic Cycle in Recent Years
Household Saving Ratio for the UK Economy
-4.0
-2.0
0.0
2.0
4.0
6.0
8.0
10.0
12.0
14.0 2000
2001
2002
2003
2004
2005
2006
2007
2008
2009
2010
2011
2012
2013
2014
2015
Household final consumption
Savings ratio
The chart shows the annual
growth in household
consumption of goods and
services along with the
household saving ratio (% of
disposable income)
The saving ratio in the UK
has been falling since 2010
mainly due to a period of
relatively strong consumer
spending that has out-
paced the growth of real
disposable income
%
Capital Investment as a share of UK GDP
This chart shows total investment spending measured as a share of GDP –
it is expressed in nominal and in real terms i.e. inflation adjusted.
0.0
2.0
4.0
6.0
8.0
10.0
12.0
14.0
16.0
18.0
1980
Q2
1983
Q2
1986
Q2
1989
Q2
1992
Q2
1995
Q2
1998
Q3
2001
Q3
2004
Q3
2007
Q3
2010
Q3
2013
Q3
Nominal
Real
In real terms and expressed as a share of GDP,
the level of capital investment spending in the
UK has remained stubbornly low.
Key UK Labour Market Data in Recent Years
Year
Labour Force
Survey
Unemployment
Level
Labour Force
Survey
Unemployment
Rate
Total
Employment
Employment
Rate
Thousands
Per cent of the
labour force
Thousands
Per cent of
population of
working age
2011 2,593 8.1 29,376 70.3
2012 2,572 8.0 29,696 71.0
2013 2,476 7.6 30,043 71.5
2014 2,027 6.2 30,726 72.9
2015 (April) 1,813 5.5 31,053 73.4
Source: HM-Treasury Databank
Unemployment in the UK Economy over Long Run
The unemployment rate has varied over the last 40 years. Our chart
shows the peaks over this period – the peak rate has been falling.
11.9
6.9
10.7
4.7
8.5
5.5
-4
-2
0
2
4
6
8
10
12
14
1973 1977 1981 1985 1989 1993 1997 2001 2005 2009 2013
18 month change
Unemployment Rate 16+
Labour Force Survey Unemployment Rate (%)
Unemployment by Age in the UK Economy
The decline in unemployment since 2011 has been across all age groups,
but has been greater for the 18 to 49 age brackets during this period
100
200
300
400
500
600
700
800
900
16-17 18-24 25-34 35-49 50-64 65+
2011
2012
2013
2014
2015 Q1-Q3
Total unemployment, seasonally adjusted
Duration of LFS Unemployment in the UK economy
500
1,000
1,500
2,000
2,500
3,000
2005 2006 2007 2008 2009 2010 2011 2012 2013 2014 2015
Over 24 months
12-24 months
6-12 months
Less than 6 months
Total unemployment, seasonally adjusted
0.0%
0.5%
1.0%
1.5%
2.0%
2.5%
3.0%
3.5%
4.0%
4.5%
5.0%
2000 2001 2002 2003 2004 2005 2006 2007 2008 2009 2010 2011 2012 2013 2014 2015
Inflationrate
CPI inflation target = 2%
Inflation Rate in the UK Economy in Recent Years
A lower inflation rate means
prices rise more slowly – this is
known as disinflation
Source: Office for National Statistics
CPI Inflation in the UK over the last 20 Years
The inflation rate for goods such as clothing and computing equipment has been,
on average, lower than for service such as insurance and education
-3
-2
-1
0
1
2
3
4
5
6
7
1995
JAN
1996
JAN
1997
JAN
1998
JAN
1999
JAN
2000
JAN
2001
JAN
2002
JAN
2003
JAN
2004
JAN
2005
JAN
2006
JAN
2007
JAN
2008
JAN
2009
JAN
2010
JAN
2011
JAN
2012
JAN
2013
JAN
2014
JAN
CPI all items
CPI goods
CPI services
Annual rate of change of consumer prices (%) Source: Office for National Statistics
CPI and Core Inflation in the UK In Recent Years
CPI All Items: Percentage change over 12 months
Core CPI: Excludes energy, food, alcohol & tobacco
Annual rate of change of consumer prices (%) Source: Office for National Statistics
-1
0
1
2
3
4
5
6
Jan-05
Aug-05
Mar-06
Oct-06
May-07
Dec-07
Jul-08
Feb-09
Sep-09
Apr-10
Nov-10
Jun-11
Jan-12
Aug-12
Mar-13
Oct-13
May-14
Dec-14
Jul-15
CPI All items
Core CPI
UK Balance of Trade in Goods and Services
-14
-12
-10
-8
-6
-4
-2
0
2
4
6
8
10
2013
Nov
2014
Feb
2014
May
2014
Aug
2014
Nov
2015
Feb
2015
May
2015
Aug
2015
Nov
£ billion, seasonally
adjusted
Balance of Trade in Goods Balance of Trade in Services
Balance of Total UK Trade
Britain runs a strong surplus in services but a large and persistent deficit in goods
UK Trade Balances in Goods and Services with the EU
The UK runs a trade surplus with countries such as Ireland but very large trade
deficits with countries such as Germany and Spain. Can you explain why?
-70
-60
-50
-40
-30
-20
-10
0
10
20
2003 2004 2005 2006 2007 2008 2009 2010 2011 2012 2013
Rest of the EU Spain Netherlands Ireland Germany France
Annual Trade Balance (£ billion)
Source: Office for National Statistics
Base Interest Rates and Mortgage Rate in the UK
0.0
1.0
2.0
3.0
4.0
5.0
6.0
7.0
8.0
19
99
20
00
20
01
20
02
20
03
20
04
20
05
20
06
20
07
20
08
20
09
20
10
20
11
20
12
20
13
20
14
20
15
Effective mortgage interest rate Base rate
Fluctuations in the UK Exchange Rate Index
65.0
70.0
75.0
80.0
85.0
90.0
95.0
100.0
105.0
110.0
2006 2007 2008 2009 2010 2011 2012 2013 2014 2015
ERI
€ : £
$ : £
Key Summary of UK Government Finances 2014-2021
Source: OBR, November 2015
Per cent of GDP
Outturn Forecast
2014-15 2015-16 2016-17 2017-18 2018-19 2019-20 2020-21
Revenue and spending
Tax revenues (% of GDP) 35.8 35.8 36.5 36.9 36.9 36.9 37.1
Government spending (% of GDP) 40.9 39.7 39.1 38.1 37.2 36.5 36.4
Size of the budget deficit (% of GDP)
Government borrowing 5.1 3.9 2.6 1.2 0.3 -0.4 -0.7
Cyclically adjusted current budget
deficit (% of GDP)
2.4 1.6 0.5 -0.5 -1.2 -1.9 -2.4
The Size of the National Debt:
Public sector net debt (% of GDP) 83.1 82.5 81.7 79.9 77.3 74.3 71.3
The Estimated Output Gap for the UK Economy
The chart shows the estimated output gap for the UK economy. Note that
there is a range of estimates from different economic forecasters.
-6.0
-5.0
-4.0
-3.0
-2.0
-1.0
0.0
1.0
2.0
3.0
4.0
2008 Q3 2009 Q3 2010 Q3 2011 Q3 2012 Q3 2013 Q3 2014 Q3 2015 Q3
November 2015 central
estimate
Highest forecast
Lowest forecast
Negative output gap –
i.e. the economy has
large margin of spare
capacity
Positive output gap – i.e.
where actual GDP is
above potential GDP – a
sign of possible excess
aggregate demand
Average UK House Prices by Region
£s
-
100,000
200,000
300,000
400,000
500,000
600,000
UK England Wales Scotland Northern
Ireland
North
East
North
West
Yorks &
The
Humber
East
Midlands
West
Midlands
East London South
East
South
West
Mix-adjusted average house price for UK countries and English
Regions, October 2015
Introduction to the UK Economy
Geoff Riley @tutor2ugeoff

Uk economy update 2015

  • 1.
  • 2.
    What are thekey objectives of macroeconomic policy? Price Stability (CPI Inflation of 2%) Growth of Real GDP (National Output) Falling Unemployment / Raising Employment Higher Average Living Standards (national income per capita) Stable Balance of Payments on the Current Account An Equitable Distribution of Income and Wealth
  • 3.
    Additional objectives ofmacroeconomic policy Balancing the budget and reducing the national debt Improving economic well-being Better regional balance in the UK economy Improved access to public services Improved competitiveness Environmental sustainability
  • 4.
    Actual and ForecastEconomic Indicators for the UK *Data for 2015 and 2016 are forecasts published for the July 2015 Budget Economic Indicator 2014 2015* 2016* Gross domestic product (GDP) % change 3.0 2.4 2.3 GDP levels (2014=100) 100.0 102.4 104.8 Output gap (per cent of potential GDP) -1.0 -0.6 -0.4 Expenditure components of GDP Household consumption (% change) 2.5 3.0 2.5 General government consumption (% change) 1.6 1.2 0.5 Business investment (% change) 8.0 6.0 7.2 General government investment (% change) 3.4 2.4 -0.1 Net trade: (exports - imports) (per cent of GDP) -0.6 -0.5 -0.4 Inflation Consumer price index (annual % change) 1.5 0.1 1.1 The Labour Market Employment (millions) 30.7 31.2 31.5 Average earnings (annual % change) 2.6 2.2 3.6 Labour Force Survey unemployment (% rate) 6.2 5.4 5.1 Claimant count unemployment (millions) 1.04 0.78 0.73
  • 5.
    Recent Macroeconomic Data Latestannualised GDP Growth (%) 2.6% GDP per capita (US $, PPP standard) $35,013 Inflation rate (%) 0.1% Unemployment rate (% of labour force) 5.4% Fiscal balance (% of GDP) -5.3% Government debt (% of GDP) 91% Yield on 10-Yr Govt Bonds (%) 1.5% Investment (% of GDP) in 2012 15% Background Information Currency unit £ Exchange rate system Floating Current policy interest rate 0.5% Trade surplus or deficit? Deficit Current account balance (% of GDP) -4.4% Main corporate tax rate (per cent) 20% Global competitiveness ranking for 2014 9th Economic Freedom Index Ranking 14th Corruption Perception Ranking 14th Other Indicators Latest HDI ranking 14 % of population living below their national poverty line n/a Life Expectancy (years) 81.5 Rank for capacity to attract skilled talent 5th Rank for Innovation and sophistication 8th Gini coefficient (Latest published estimate) 36.5 Basic Background Information for the UK Economy
  • 6.
    -4.0% -3.0% -2.0% -1.0% 0.0% 1.0% 2.0% 3.0% 4.0% 2006 2007 20082009 2010 2011 2012 2013 2014 2015 2016* 2017* 2018* 2019* 2020* GDPgrowthratecomparedtopreviousyear The chart shows real GDP growth for the UK from 2010-2014. Data for 2015 onwards shows forecast growth using figures from the International Monetary Fund (IMF) Source: ONS The UK Economic Cycle in Recent Years
  • 7.
    Household Saving Ratiofor the UK Economy -4.0 -2.0 0.0 2.0 4.0 6.0 8.0 10.0 12.0 14.0 2000 2001 2002 2003 2004 2005 2006 2007 2008 2009 2010 2011 2012 2013 2014 2015 Household final consumption Savings ratio The chart shows the annual growth in household consumption of goods and services along with the household saving ratio (% of disposable income) The saving ratio in the UK has been falling since 2010 mainly due to a period of relatively strong consumer spending that has out- paced the growth of real disposable income %
  • 8.
    Capital Investment asa share of UK GDP This chart shows total investment spending measured as a share of GDP – it is expressed in nominal and in real terms i.e. inflation adjusted. 0.0 2.0 4.0 6.0 8.0 10.0 12.0 14.0 16.0 18.0 1980 Q2 1983 Q2 1986 Q2 1989 Q2 1992 Q2 1995 Q2 1998 Q3 2001 Q3 2004 Q3 2007 Q3 2010 Q3 2013 Q3 Nominal Real In real terms and expressed as a share of GDP, the level of capital investment spending in the UK has remained stubbornly low.
  • 9.
    Key UK LabourMarket Data in Recent Years Year Labour Force Survey Unemployment Level Labour Force Survey Unemployment Rate Total Employment Employment Rate Thousands Per cent of the labour force Thousands Per cent of population of working age 2011 2,593 8.1 29,376 70.3 2012 2,572 8.0 29,696 71.0 2013 2,476 7.6 30,043 71.5 2014 2,027 6.2 30,726 72.9 2015 (April) 1,813 5.5 31,053 73.4 Source: HM-Treasury Databank
  • 10.
    Unemployment in theUK Economy over Long Run The unemployment rate has varied over the last 40 years. Our chart shows the peaks over this period – the peak rate has been falling. 11.9 6.9 10.7 4.7 8.5 5.5 -4 -2 0 2 4 6 8 10 12 14 1973 1977 1981 1985 1989 1993 1997 2001 2005 2009 2013 18 month change Unemployment Rate 16+ Labour Force Survey Unemployment Rate (%)
  • 11.
    Unemployment by Agein the UK Economy The decline in unemployment since 2011 has been across all age groups, but has been greater for the 18 to 49 age brackets during this period 100 200 300 400 500 600 700 800 900 16-17 18-24 25-34 35-49 50-64 65+ 2011 2012 2013 2014 2015 Q1-Q3 Total unemployment, seasonally adjusted
  • 12.
    Duration of LFSUnemployment in the UK economy 500 1,000 1,500 2,000 2,500 3,000 2005 2006 2007 2008 2009 2010 2011 2012 2013 2014 2015 Over 24 months 12-24 months 6-12 months Less than 6 months Total unemployment, seasonally adjusted
  • 13.
    0.0% 0.5% 1.0% 1.5% 2.0% 2.5% 3.0% 3.5% 4.0% 4.5% 5.0% 2000 2001 20022003 2004 2005 2006 2007 2008 2009 2010 2011 2012 2013 2014 2015 Inflationrate CPI inflation target = 2% Inflation Rate in the UK Economy in Recent Years A lower inflation rate means prices rise more slowly – this is known as disinflation Source: Office for National Statistics
  • 14.
    CPI Inflation inthe UK over the last 20 Years The inflation rate for goods such as clothing and computing equipment has been, on average, lower than for service such as insurance and education -3 -2 -1 0 1 2 3 4 5 6 7 1995 JAN 1996 JAN 1997 JAN 1998 JAN 1999 JAN 2000 JAN 2001 JAN 2002 JAN 2003 JAN 2004 JAN 2005 JAN 2006 JAN 2007 JAN 2008 JAN 2009 JAN 2010 JAN 2011 JAN 2012 JAN 2013 JAN 2014 JAN CPI all items CPI goods CPI services Annual rate of change of consumer prices (%) Source: Office for National Statistics
  • 15.
    CPI and CoreInflation in the UK In Recent Years CPI All Items: Percentage change over 12 months Core CPI: Excludes energy, food, alcohol & tobacco Annual rate of change of consumer prices (%) Source: Office for National Statistics -1 0 1 2 3 4 5 6 Jan-05 Aug-05 Mar-06 Oct-06 May-07 Dec-07 Jul-08 Feb-09 Sep-09 Apr-10 Nov-10 Jun-11 Jan-12 Aug-12 Mar-13 Oct-13 May-14 Dec-14 Jul-15 CPI All items Core CPI
  • 16.
    UK Balance ofTrade in Goods and Services -14 -12 -10 -8 -6 -4 -2 0 2 4 6 8 10 2013 Nov 2014 Feb 2014 May 2014 Aug 2014 Nov 2015 Feb 2015 May 2015 Aug 2015 Nov £ billion, seasonally adjusted Balance of Trade in Goods Balance of Trade in Services Balance of Total UK Trade Britain runs a strong surplus in services but a large and persistent deficit in goods
  • 17.
    UK Trade Balancesin Goods and Services with the EU The UK runs a trade surplus with countries such as Ireland but very large trade deficits with countries such as Germany and Spain. Can you explain why? -70 -60 -50 -40 -30 -20 -10 0 10 20 2003 2004 2005 2006 2007 2008 2009 2010 2011 2012 2013 Rest of the EU Spain Netherlands Ireland Germany France Annual Trade Balance (£ billion) Source: Office for National Statistics
  • 18.
    Base Interest Ratesand Mortgage Rate in the UK 0.0 1.0 2.0 3.0 4.0 5.0 6.0 7.0 8.0 19 99 20 00 20 01 20 02 20 03 20 04 20 05 20 06 20 07 20 08 20 09 20 10 20 11 20 12 20 13 20 14 20 15 Effective mortgage interest rate Base rate
  • 19.
    Fluctuations in theUK Exchange Rate Index 65.0 70.0 75.0 80.0 85.0 90.0 95.0 100.0 105.0 110.0 2006 2007 2008 2009 2010 2011 2012 2013 2014 2015 ERI € : £ $ : £
  • 20.
    Key Summary ofUK Government Finances 2014-2021 Source: OBR, November 2015 Per cent of GDP Outturn Forecast 2014-15 2015-16 2016-17 2017-18 2018-19 2019-20 2020-21 Revenue and spending Tax revenues (% of GDP) 35.8 35.8 36.5 36.9 36.9 36.9 37.1 Government spending (% of GDP) 40.9 39.7 39.1 38.1 37.2 36.5 36.4 Size of the budget deficit (% of GDP) Government borrowing 5.1 3.9 2.6 1.2 0.3 -0.4 -0.7 Cyclically adjusted current budget deficit (% of GDP) 2.4 1.6 0.5 -0.5 -1.2 -1.9 -2.4 The Size of the National Debt: Public sector net debt (% of GDP) 83.1 82.5 81.7 79.9 77.3 74.3 71.3
  • 21.
    The Estimated OutputGap for the UK Economy The chart shows the estimated output gap for the UK economy. Note that there is a range of estimates from different economic forecasters. -6.0 -5.0 -4.0 -3.0 -2.0 -1.0 0.0 1.0 2.0 3.0 4.0 2008 Q3 2009 Q3 2010 Q3 2011 Q3 2012 Q3 2013 Q3 2014 Q3 2015 Q3 November 2015 central estimate Highest forecast Lowest forecast Negative output gap – i.e. the economy has large margin of spare capacity Positive output gap – i.e. where actual GDP is above potential GDP – a sign of possible excess aggregate demand
  • 22.
    Average UK HousePrices by Region £s - 100,000 200,000 300,000 400,000 500,000 600,000 UK England Wales Scotland Northern Ireland North East North West Yorks & The Humber East Midlands West Midlands East London South East South West Mix-adjusted average house price for UK countries and English Regions, October 2015
  • 23.
    Introduction to theUK Economy Geoff Riley @tutor2ugeoff