Download to read offline
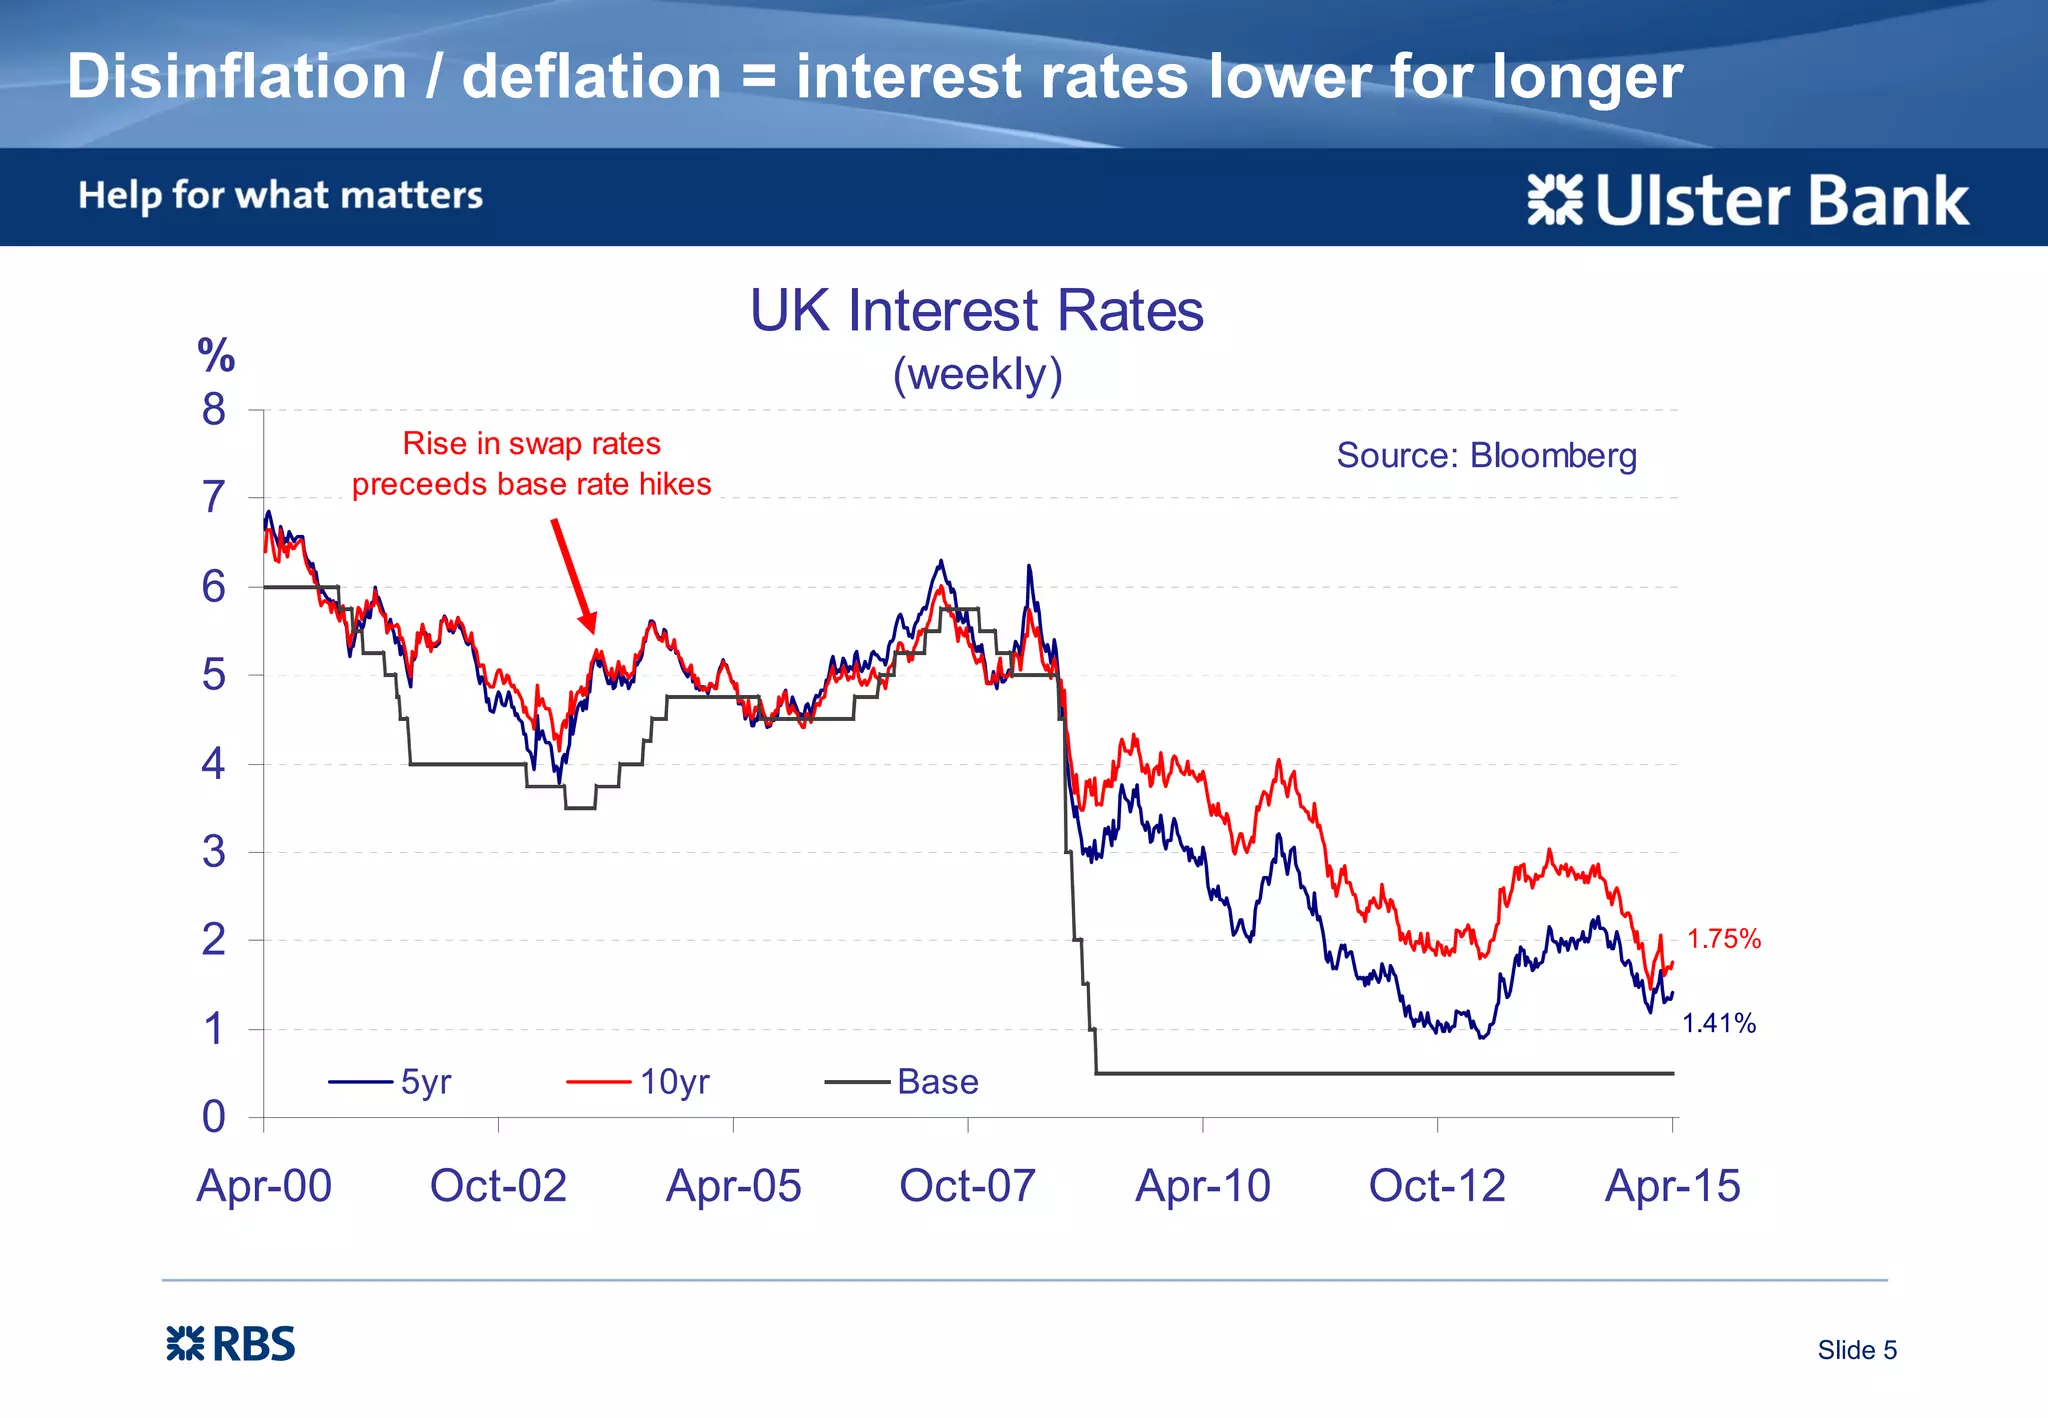
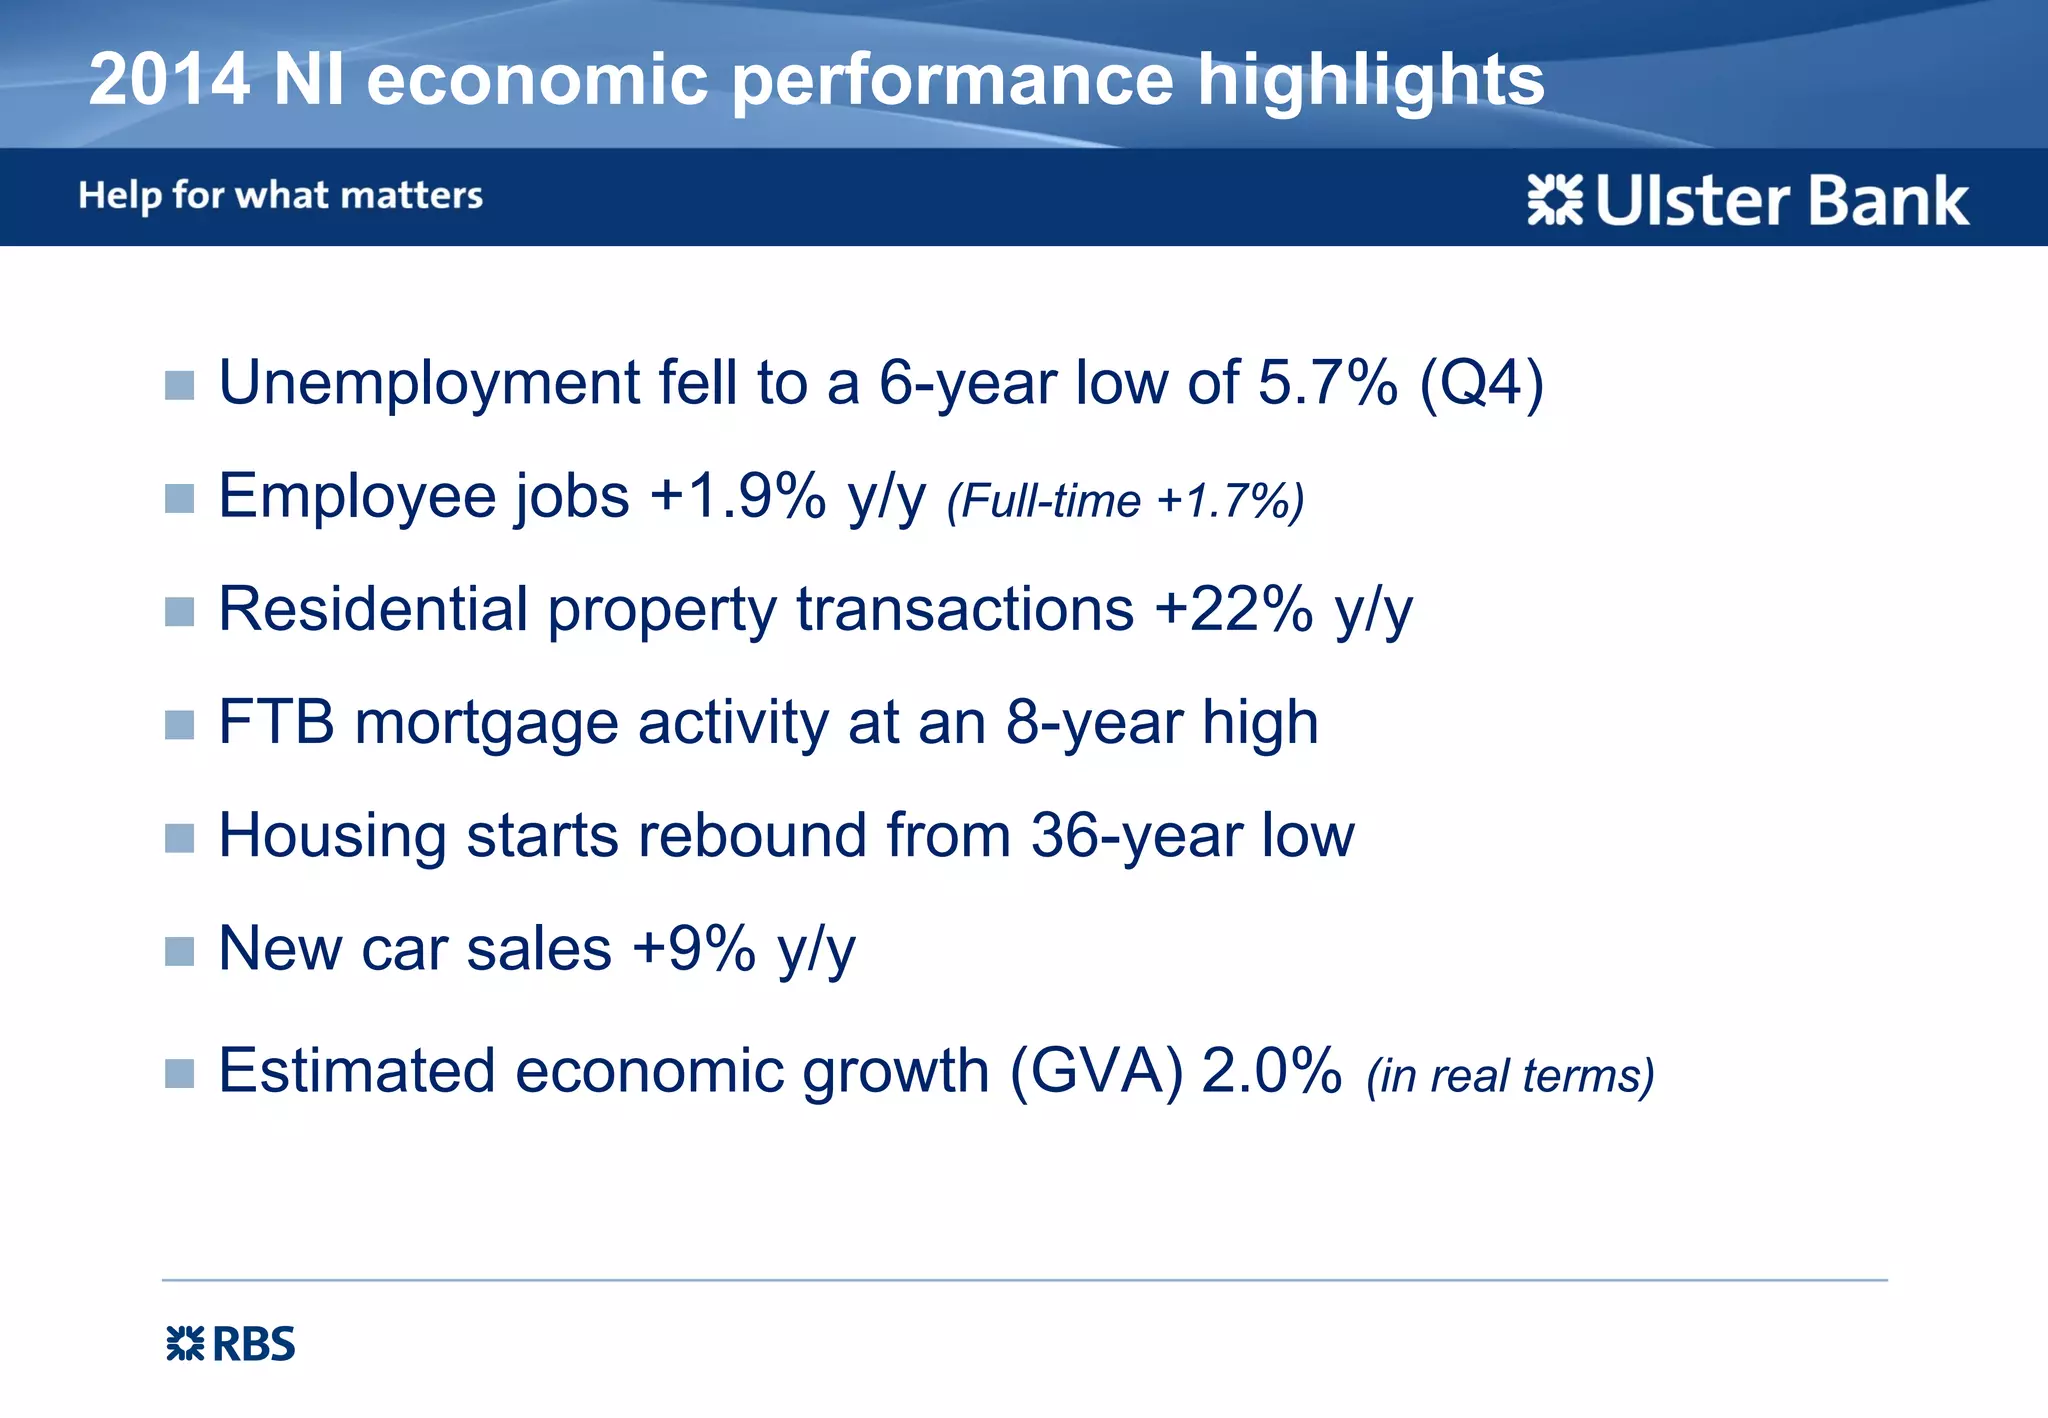
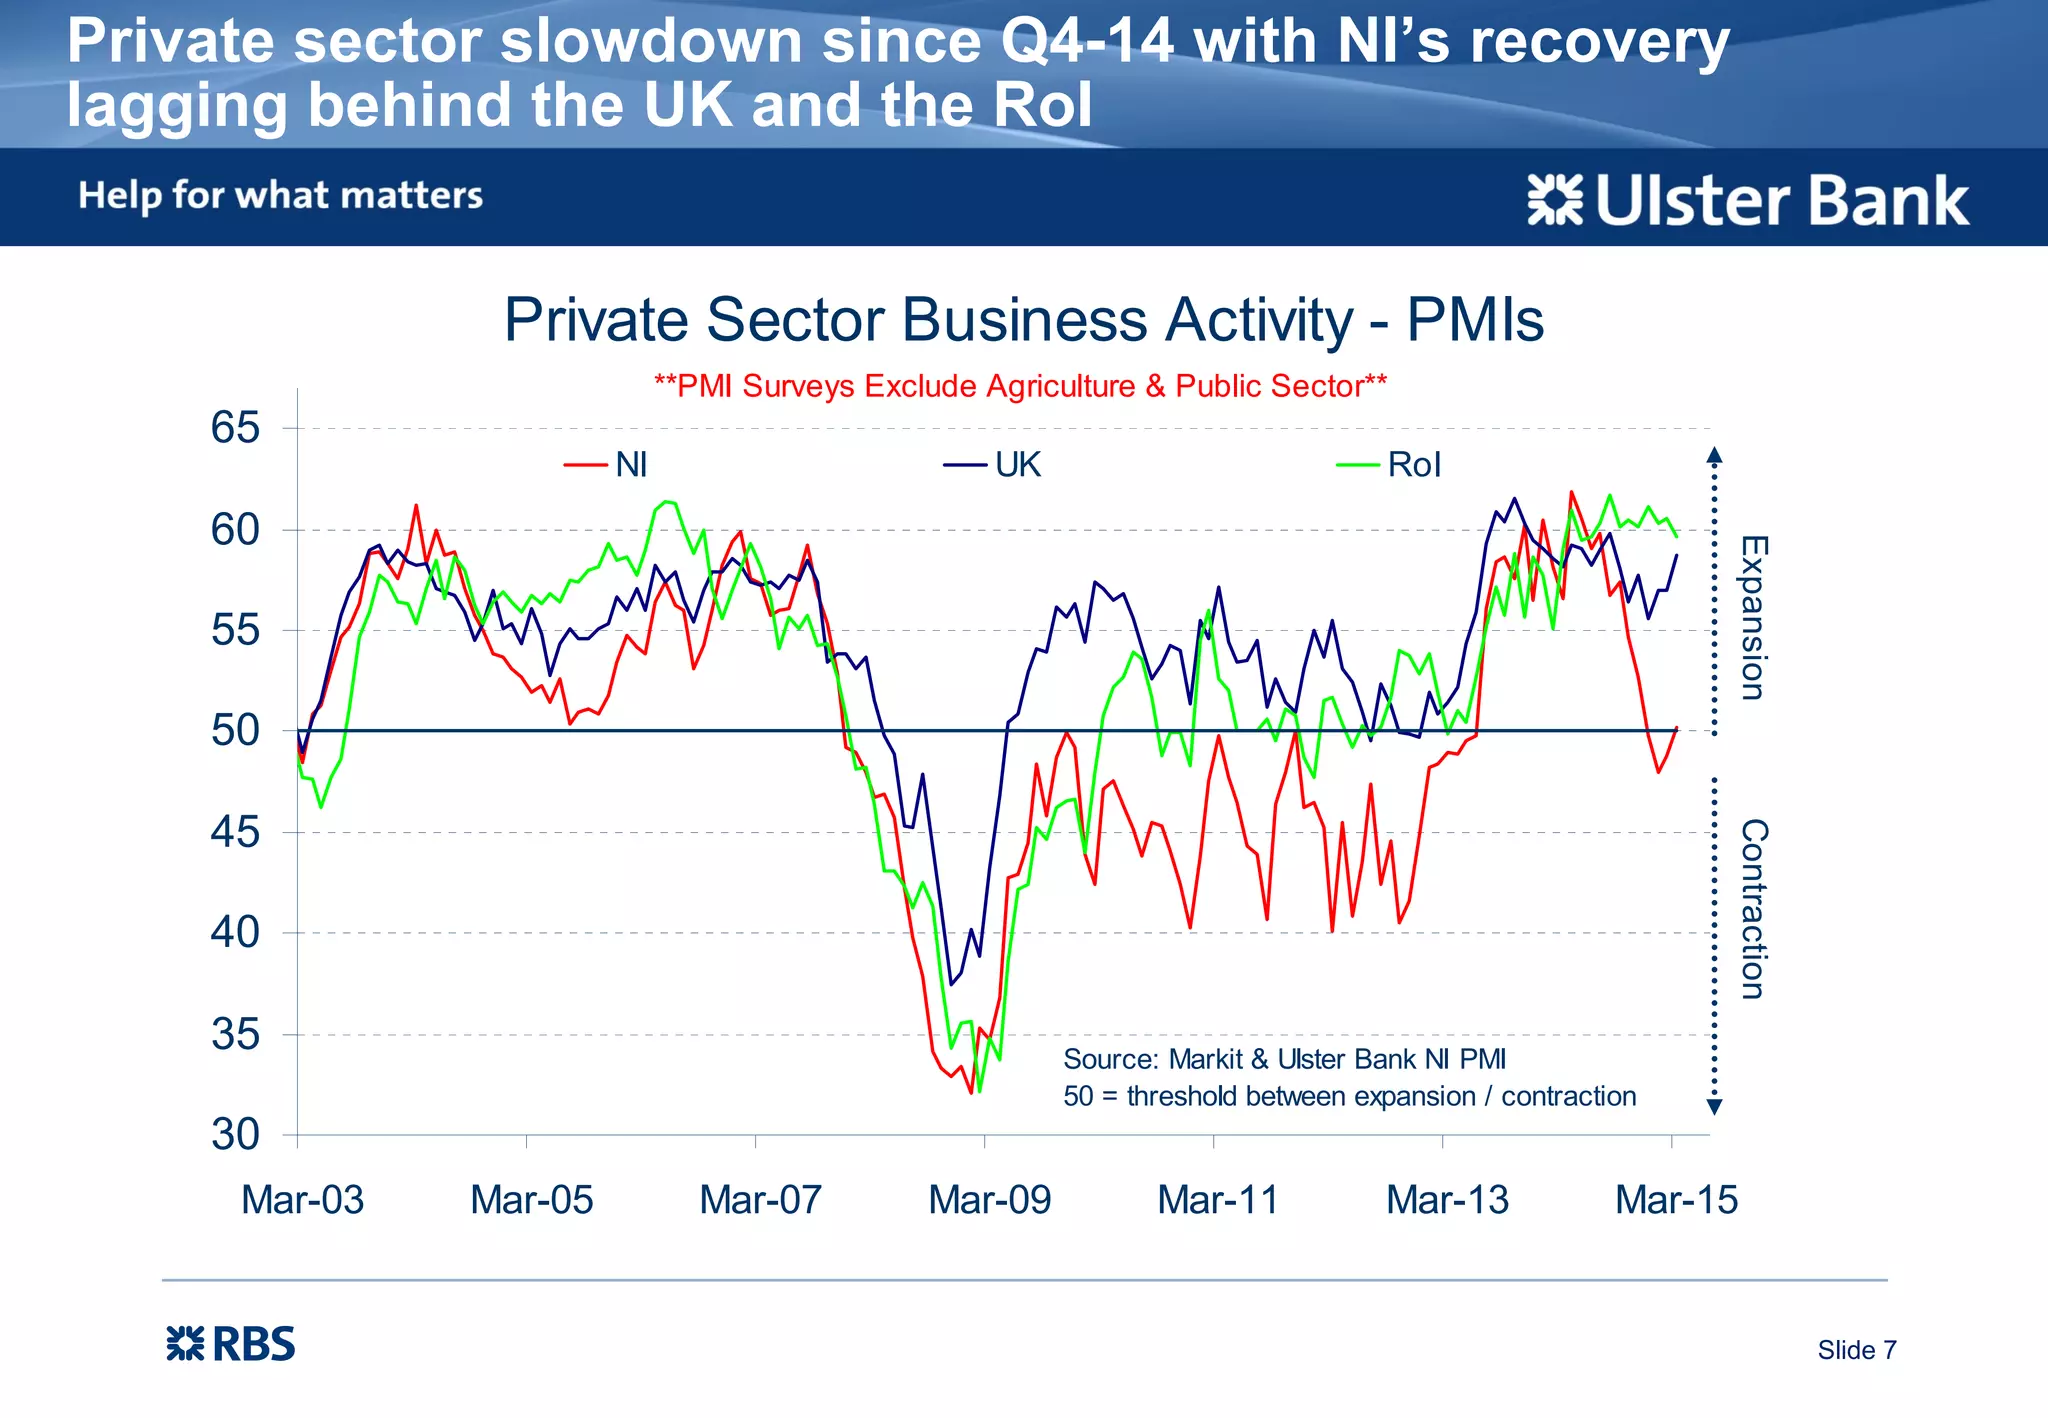
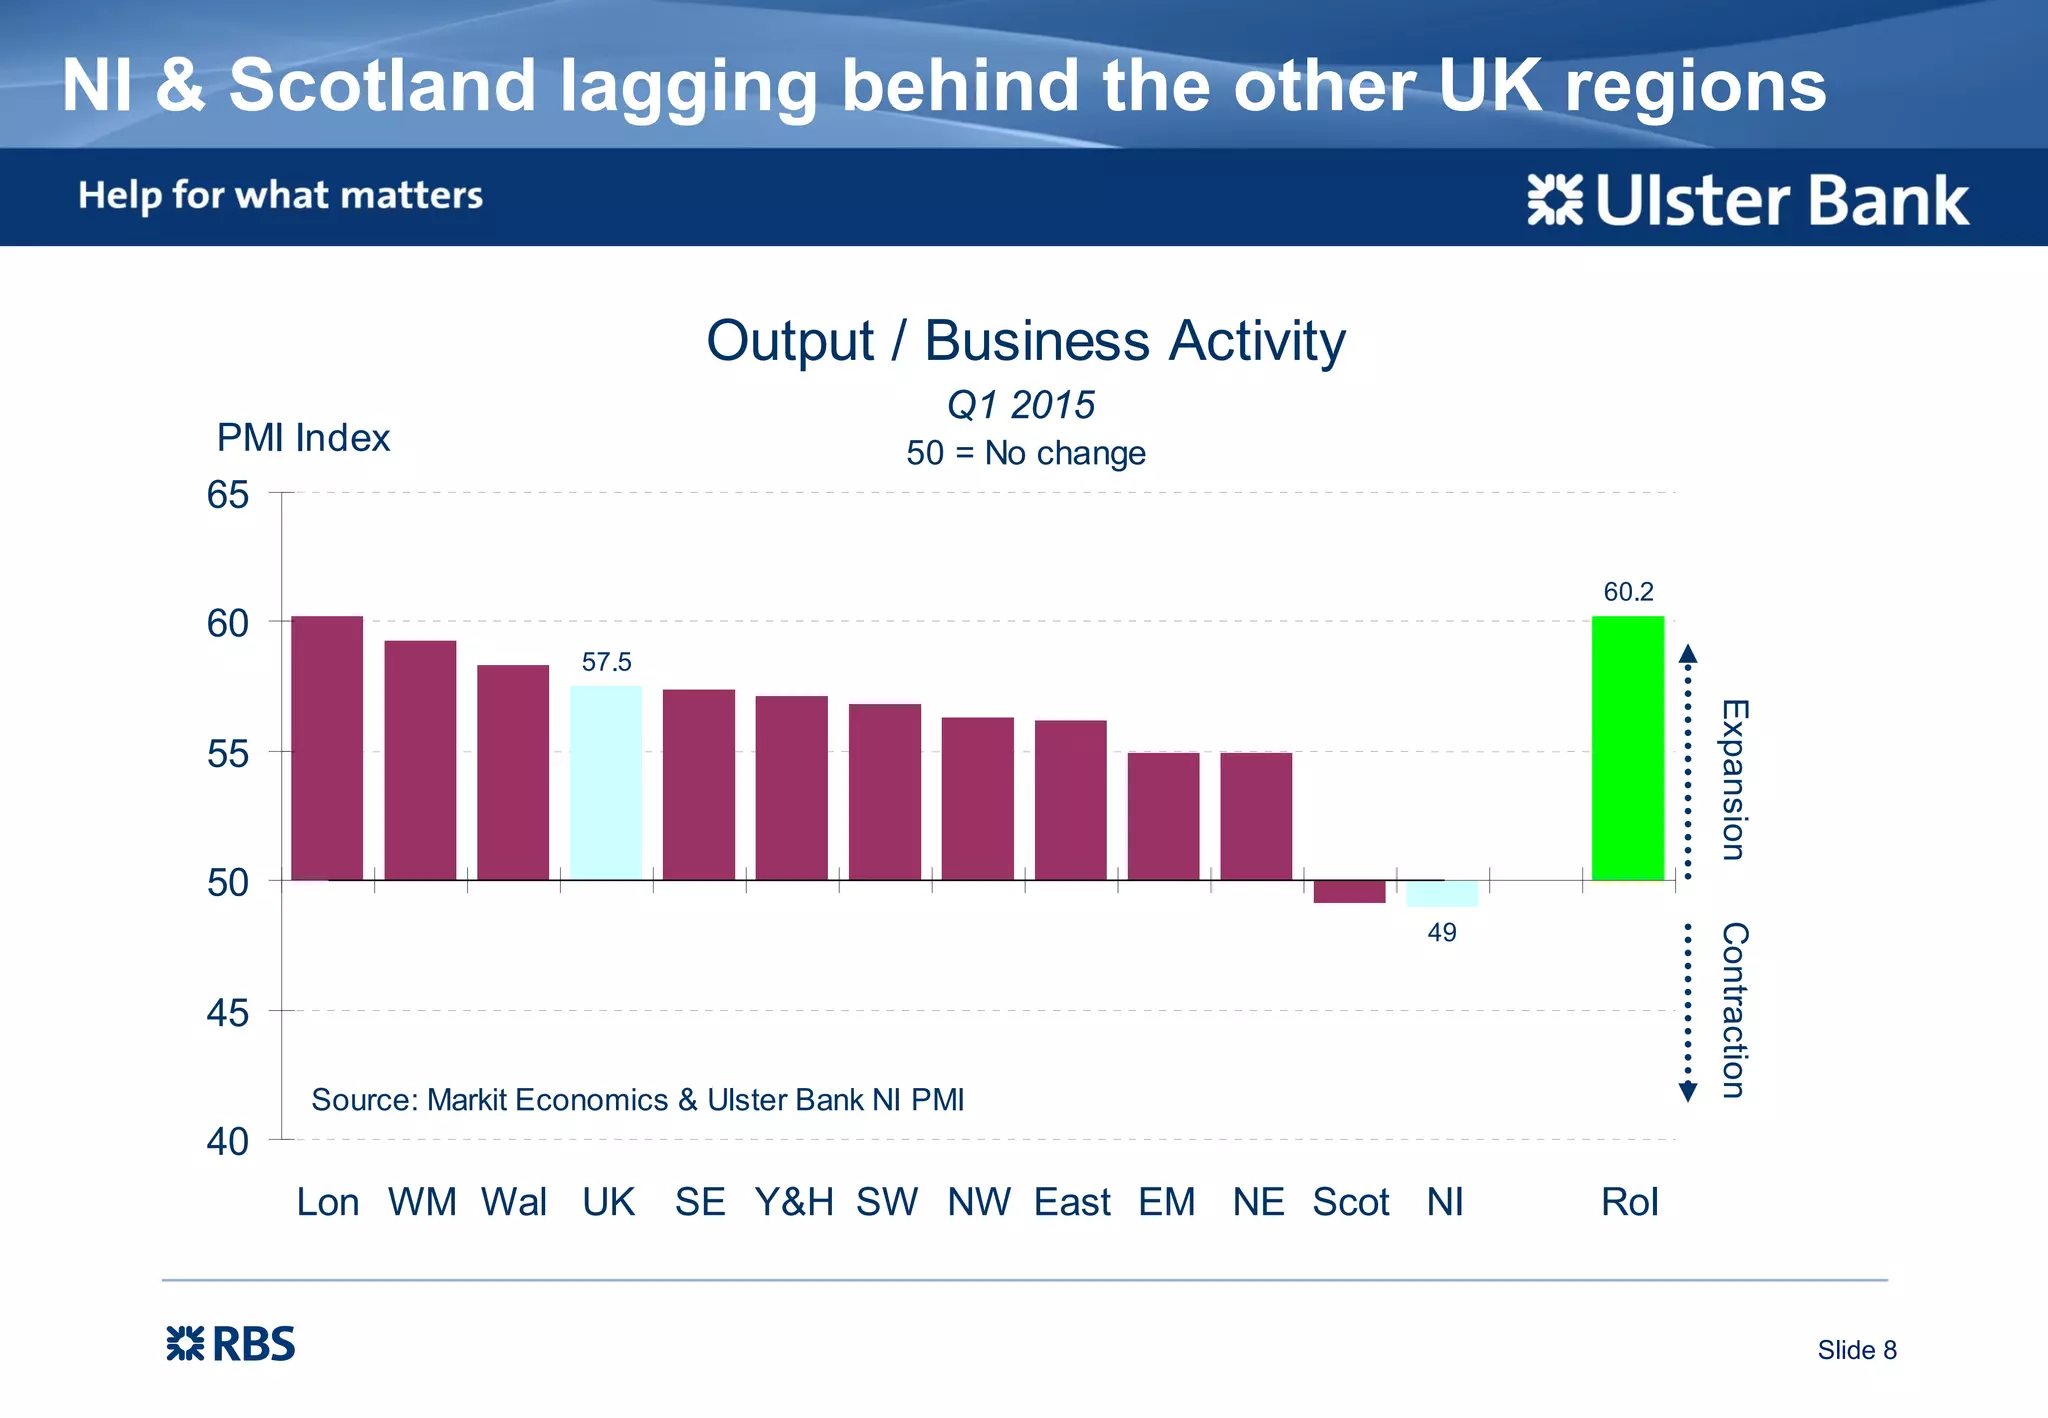
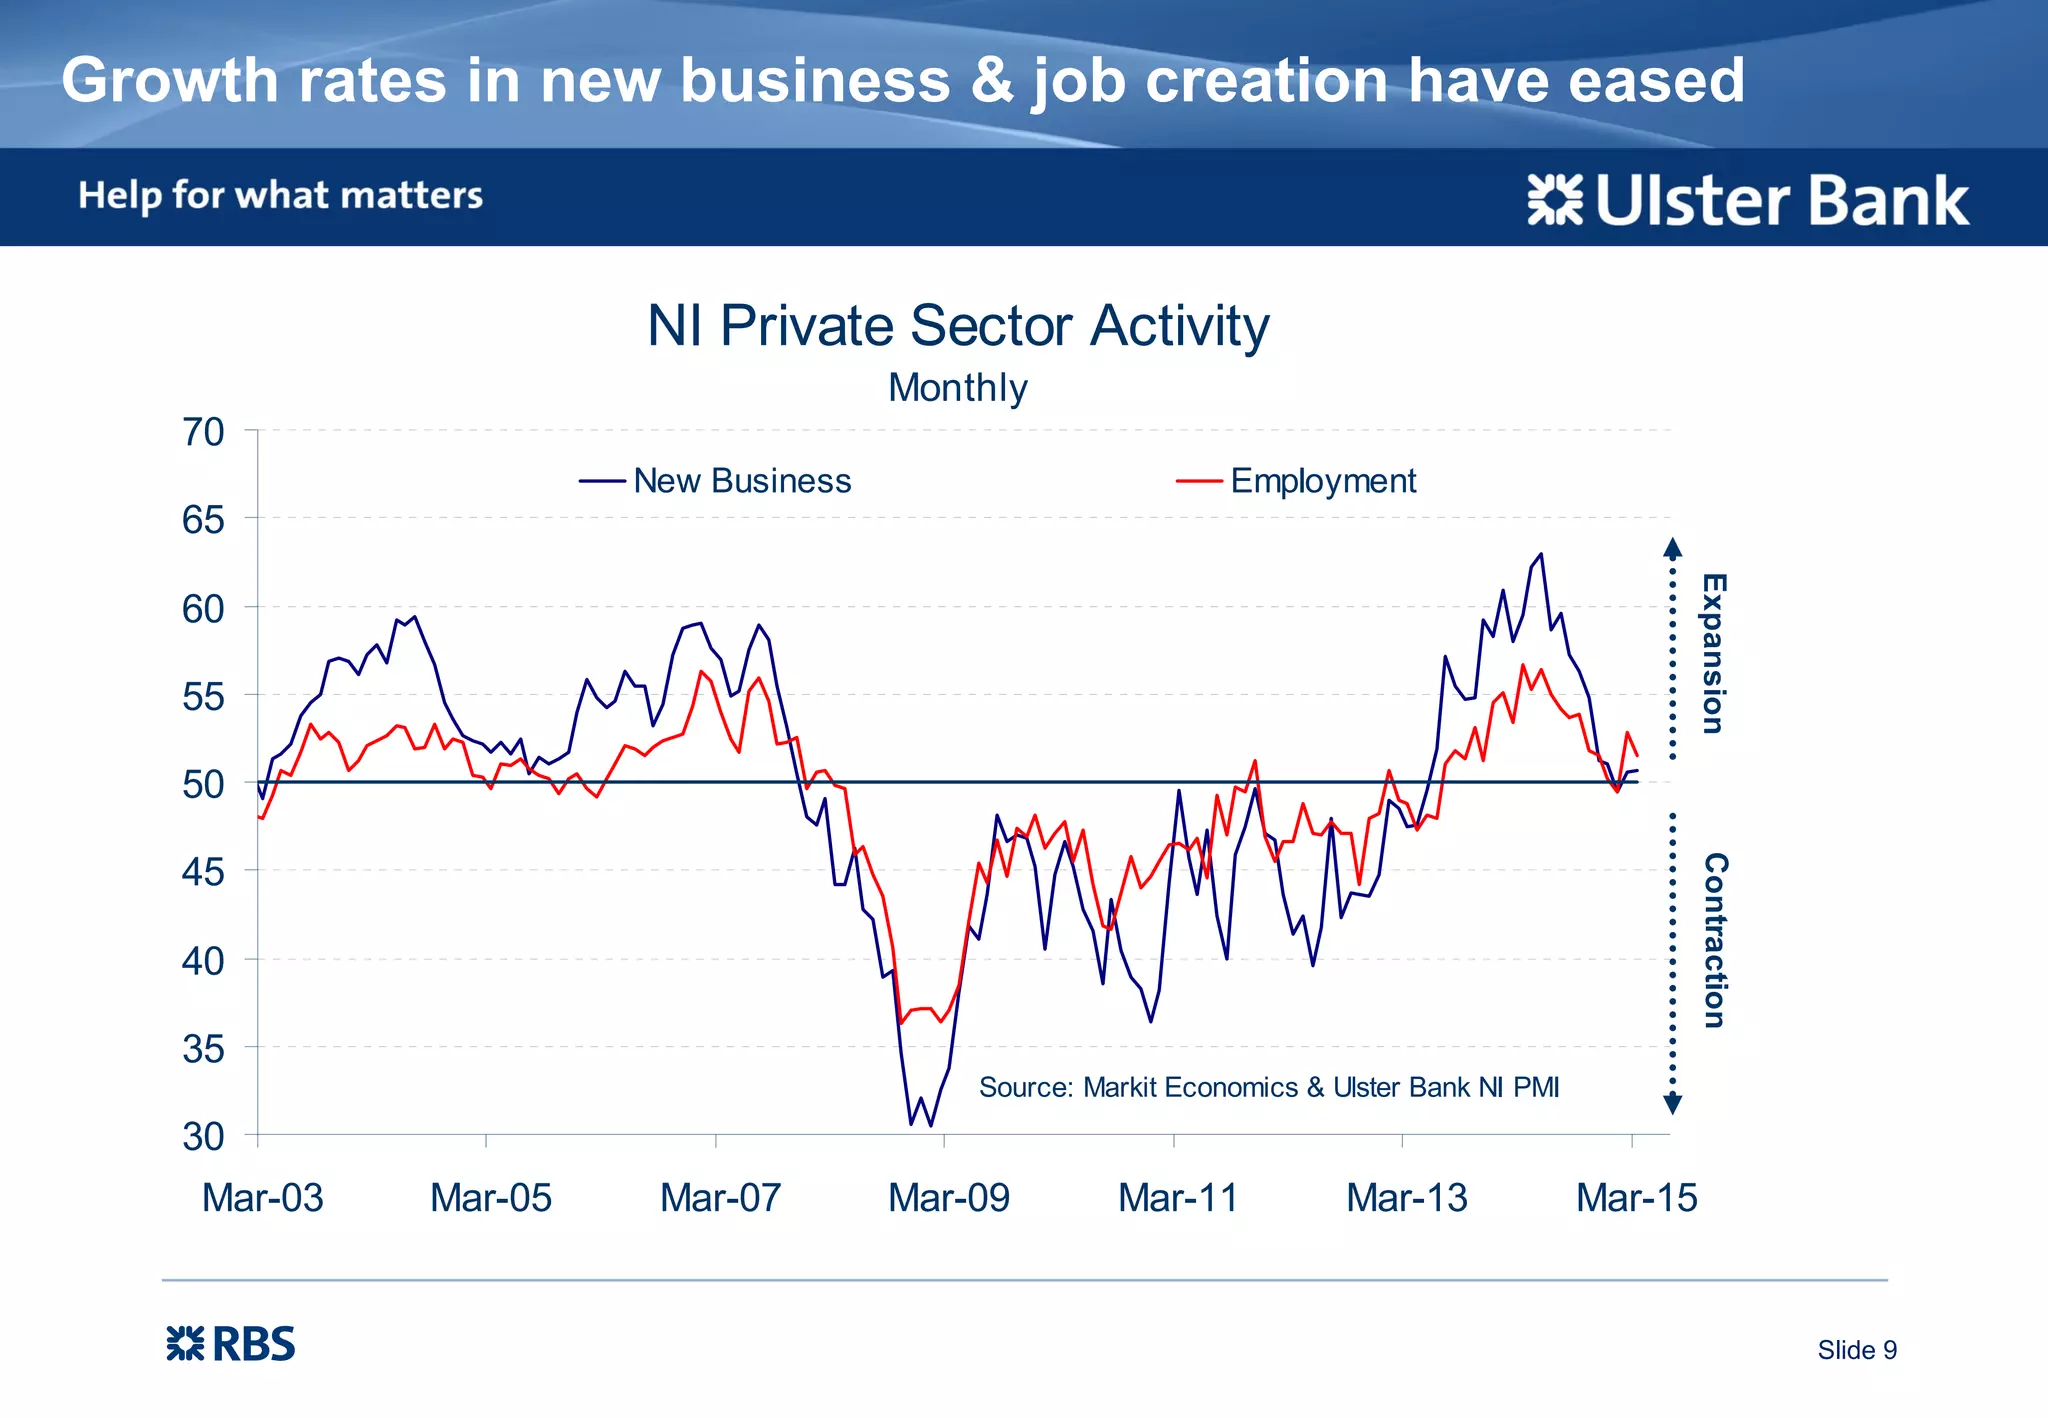
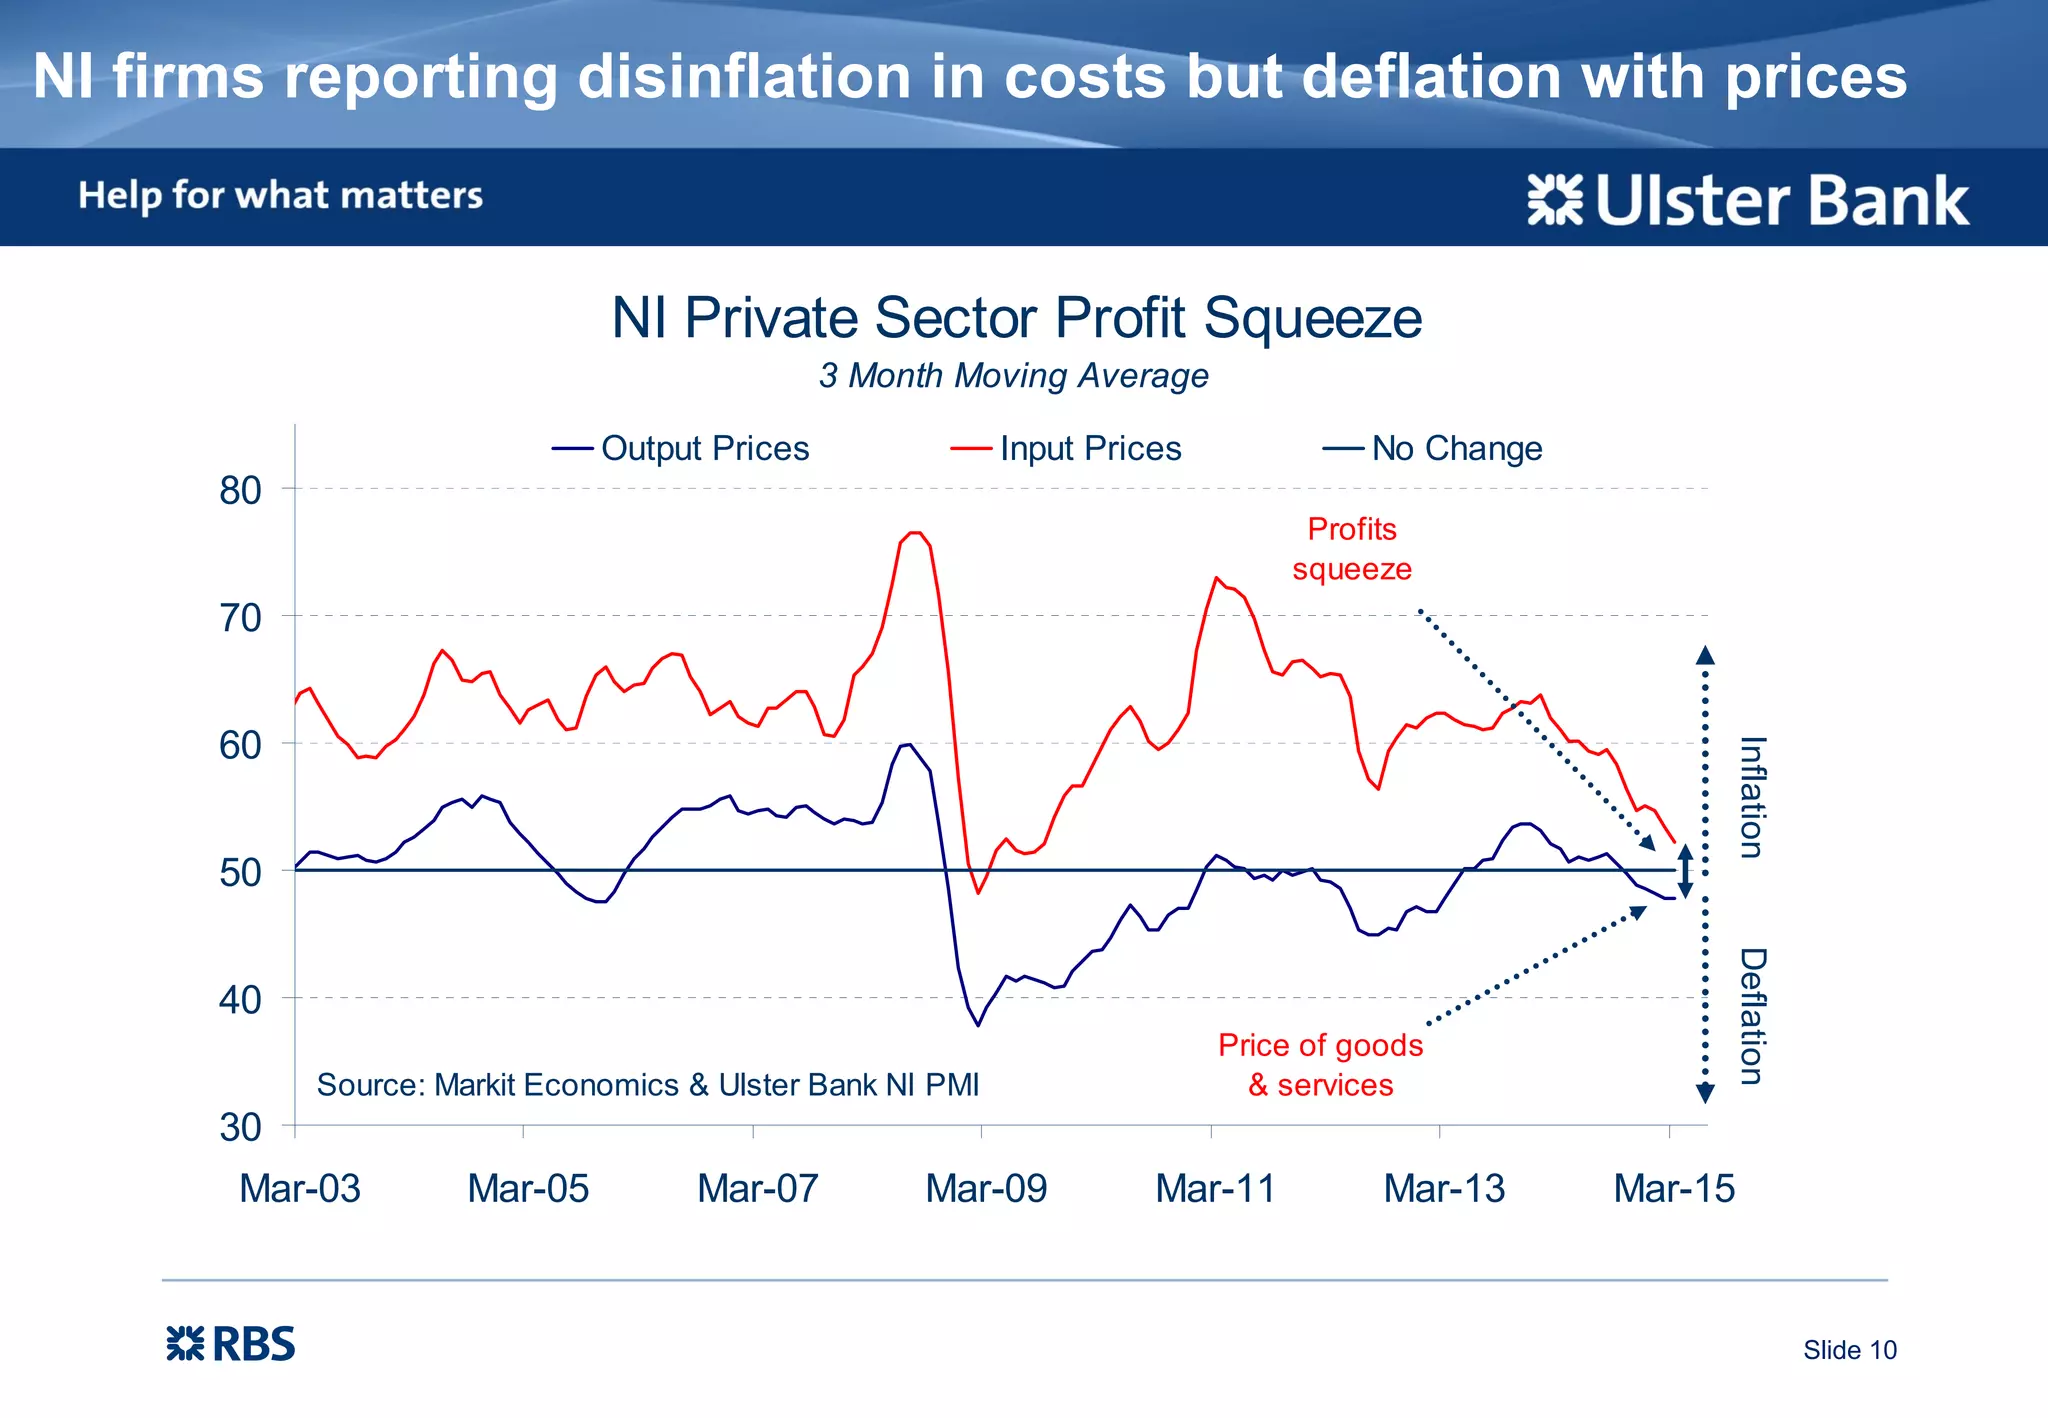
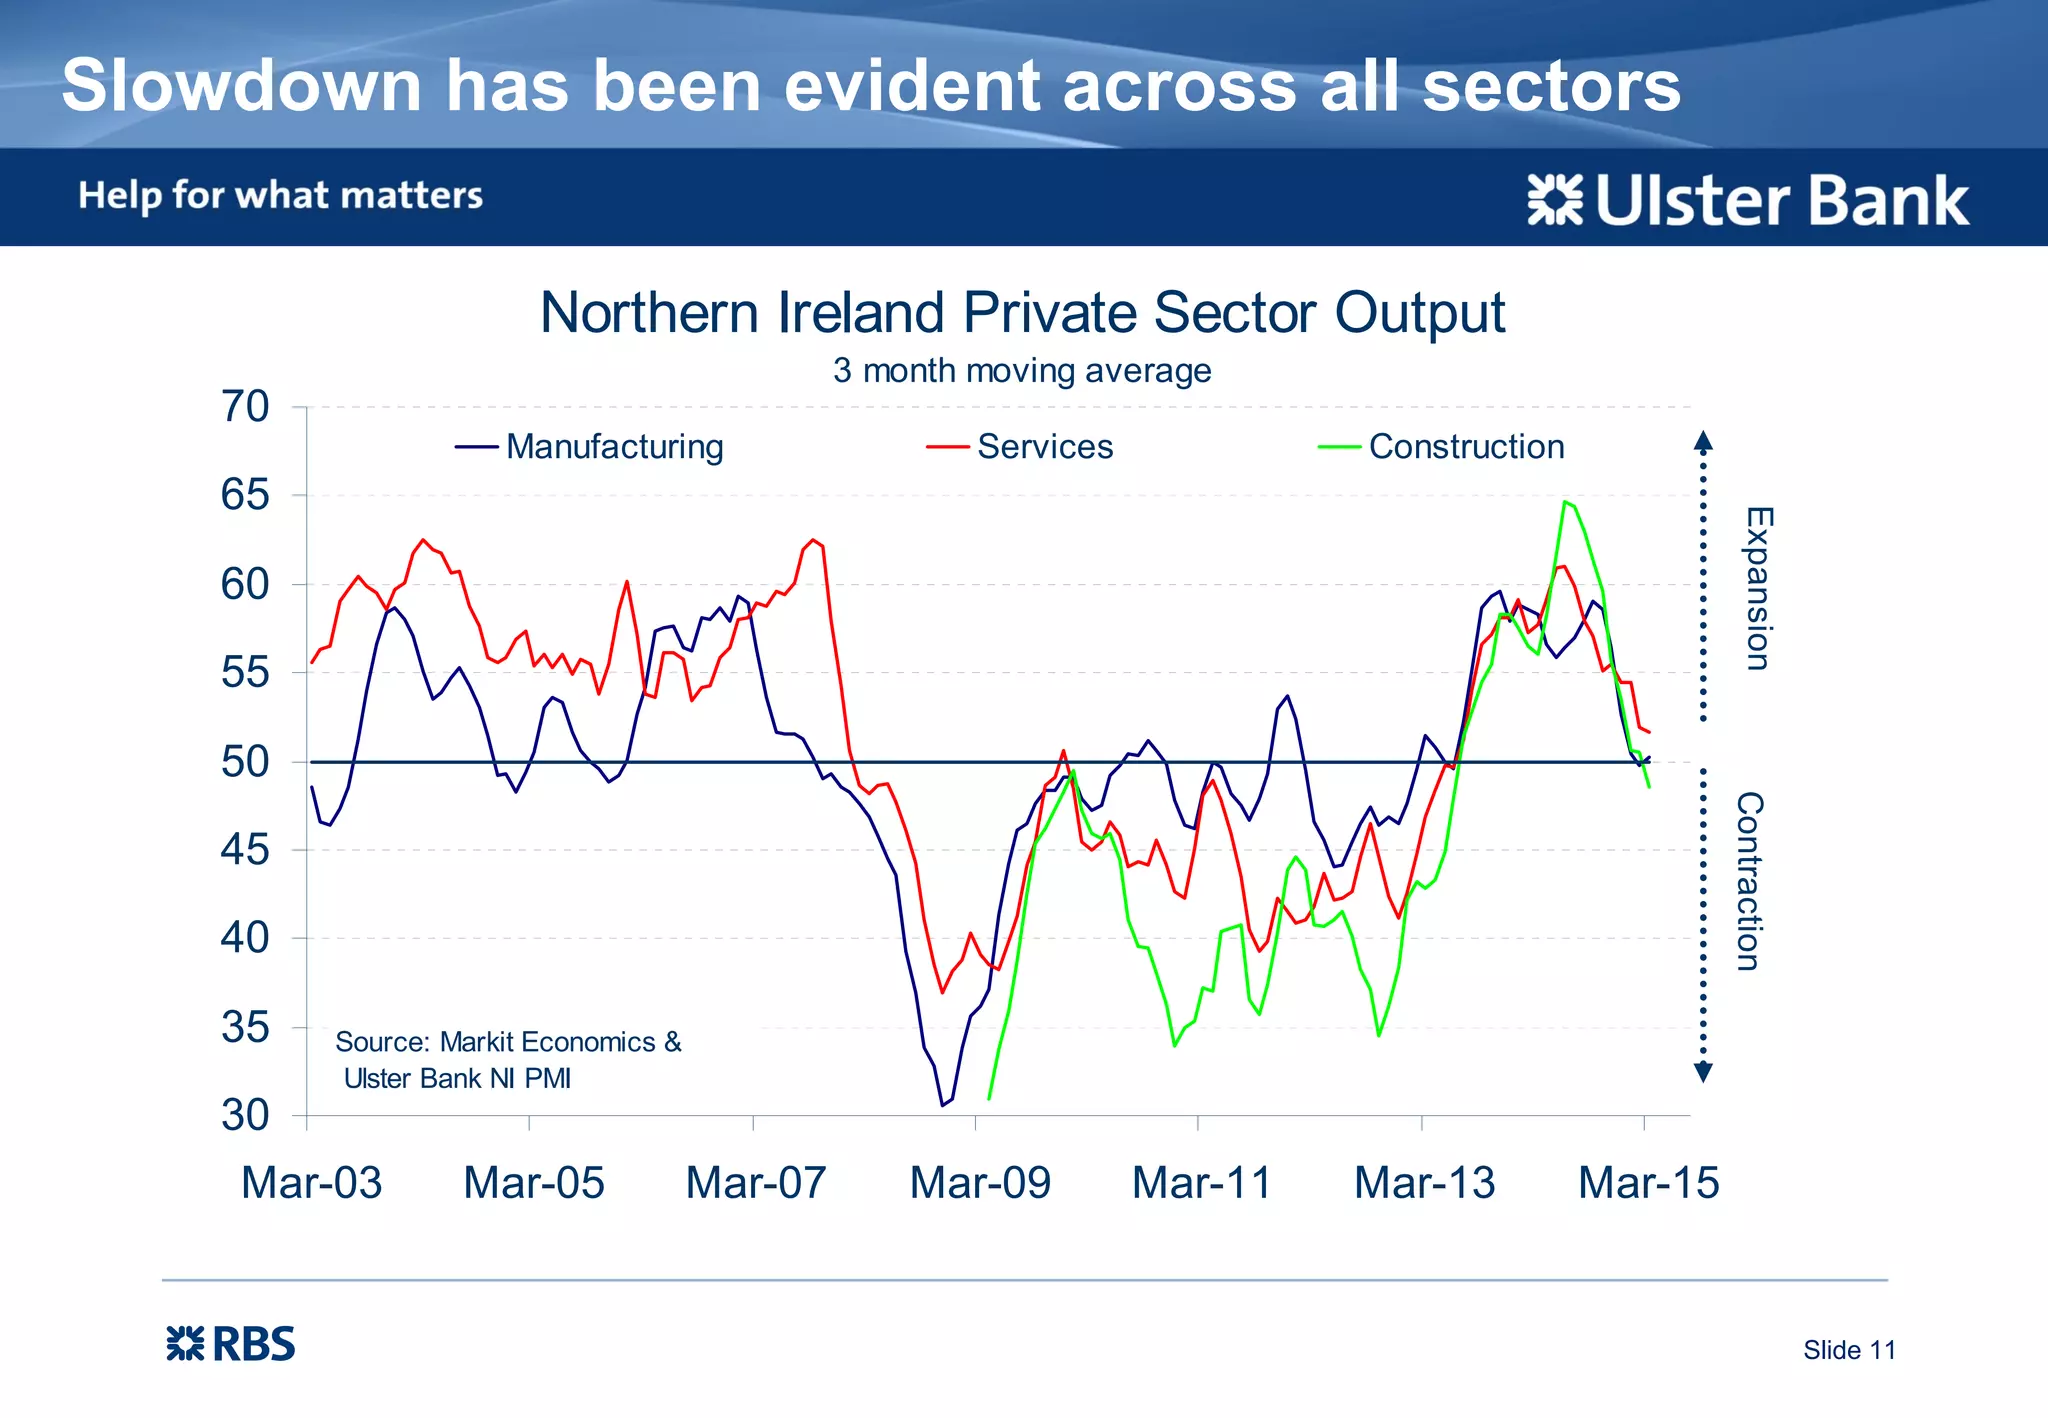
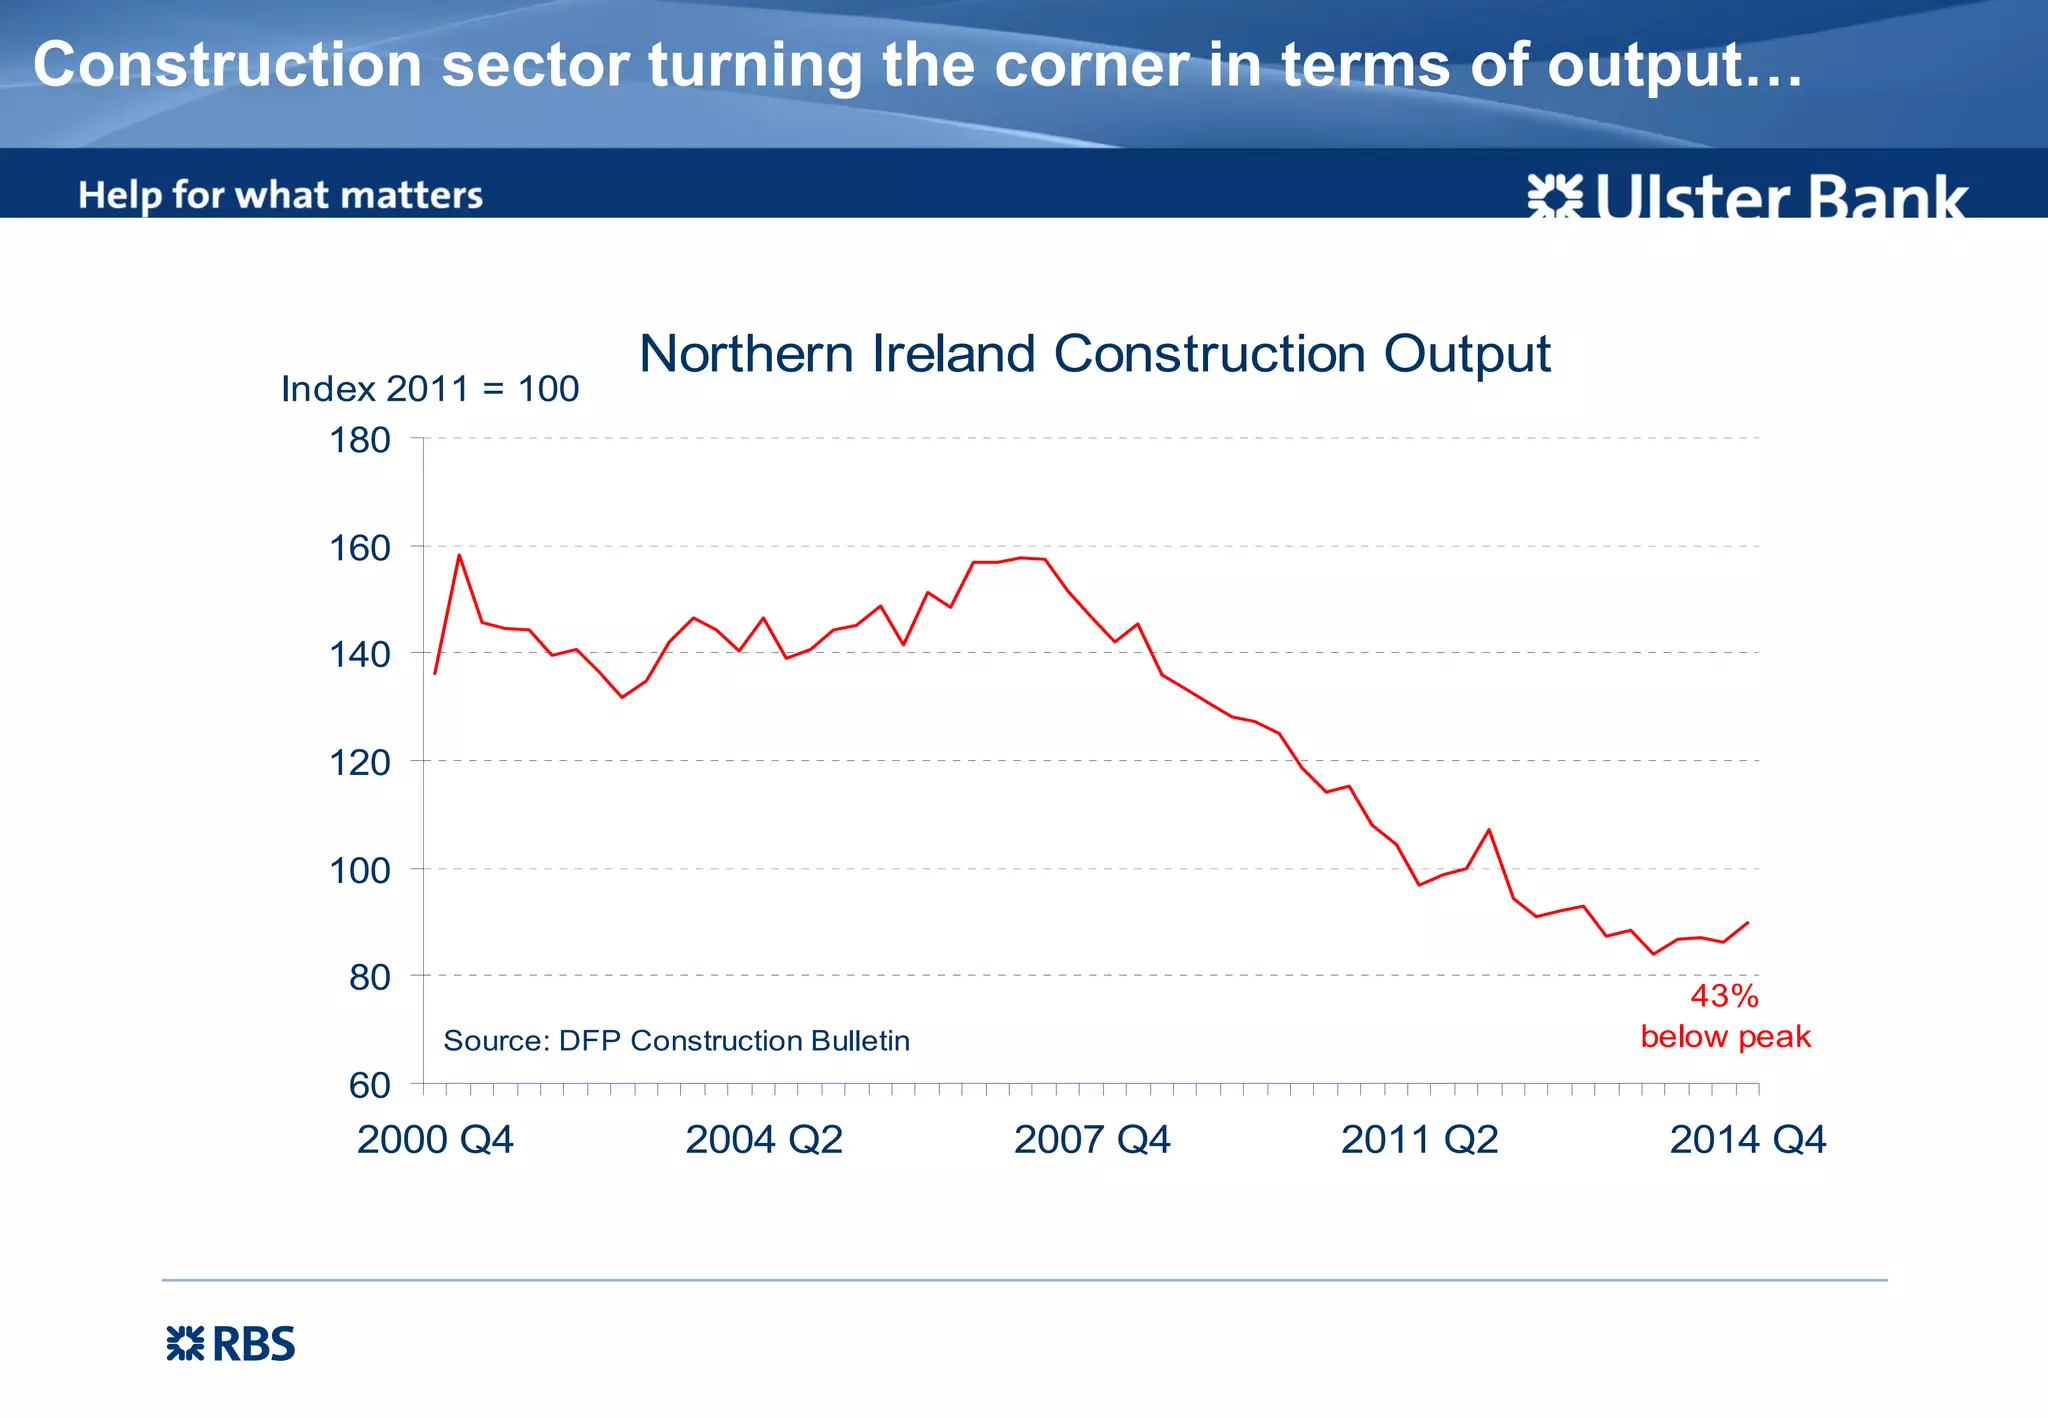
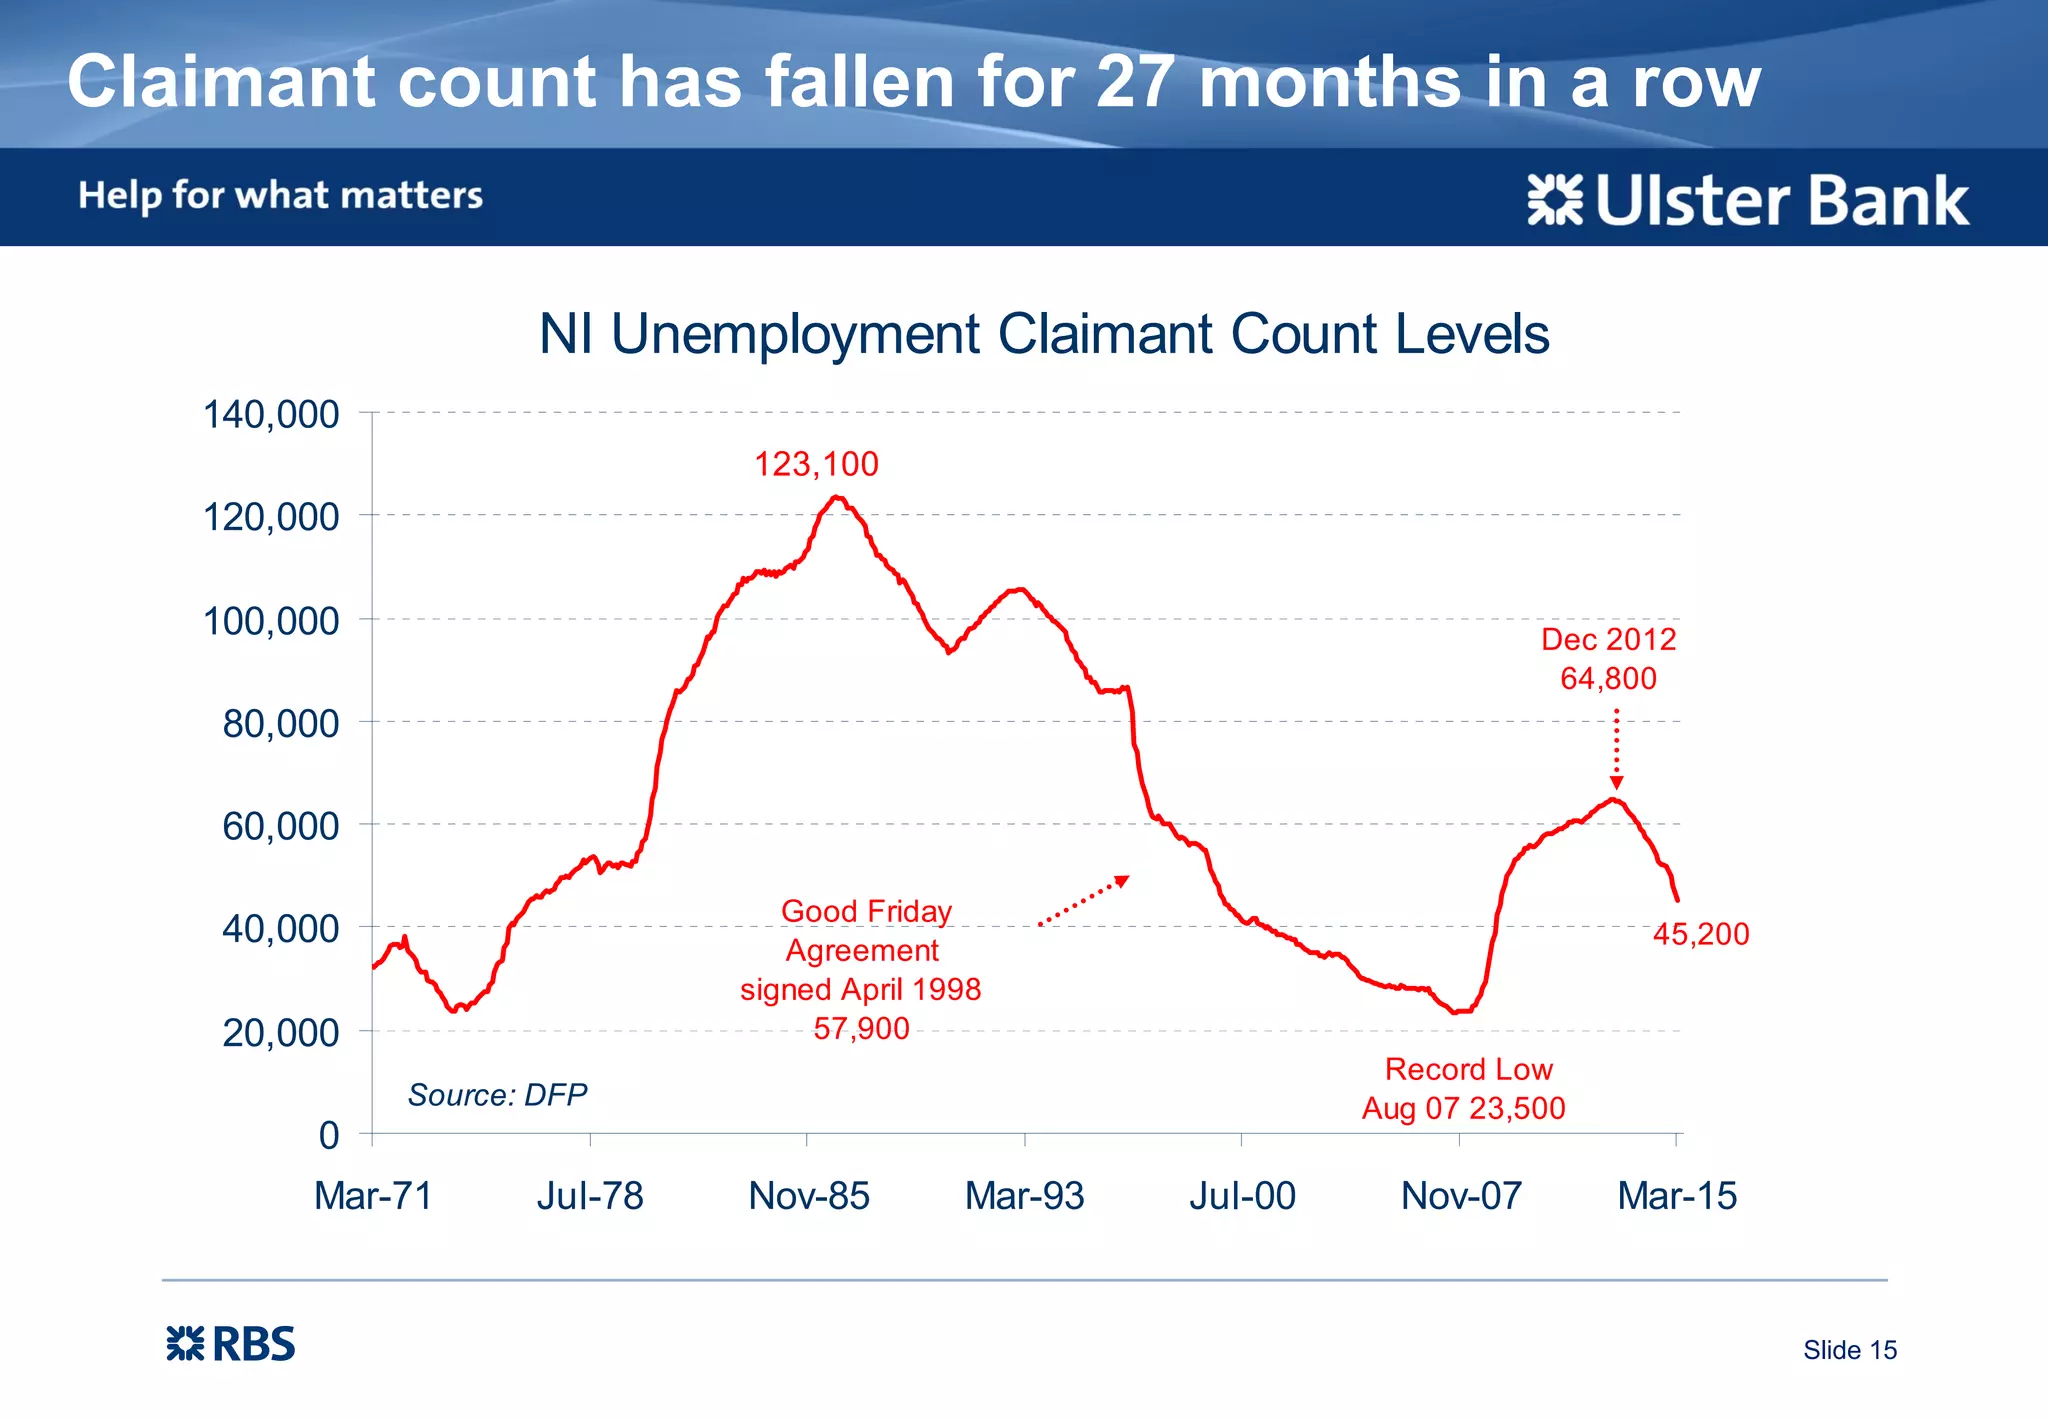

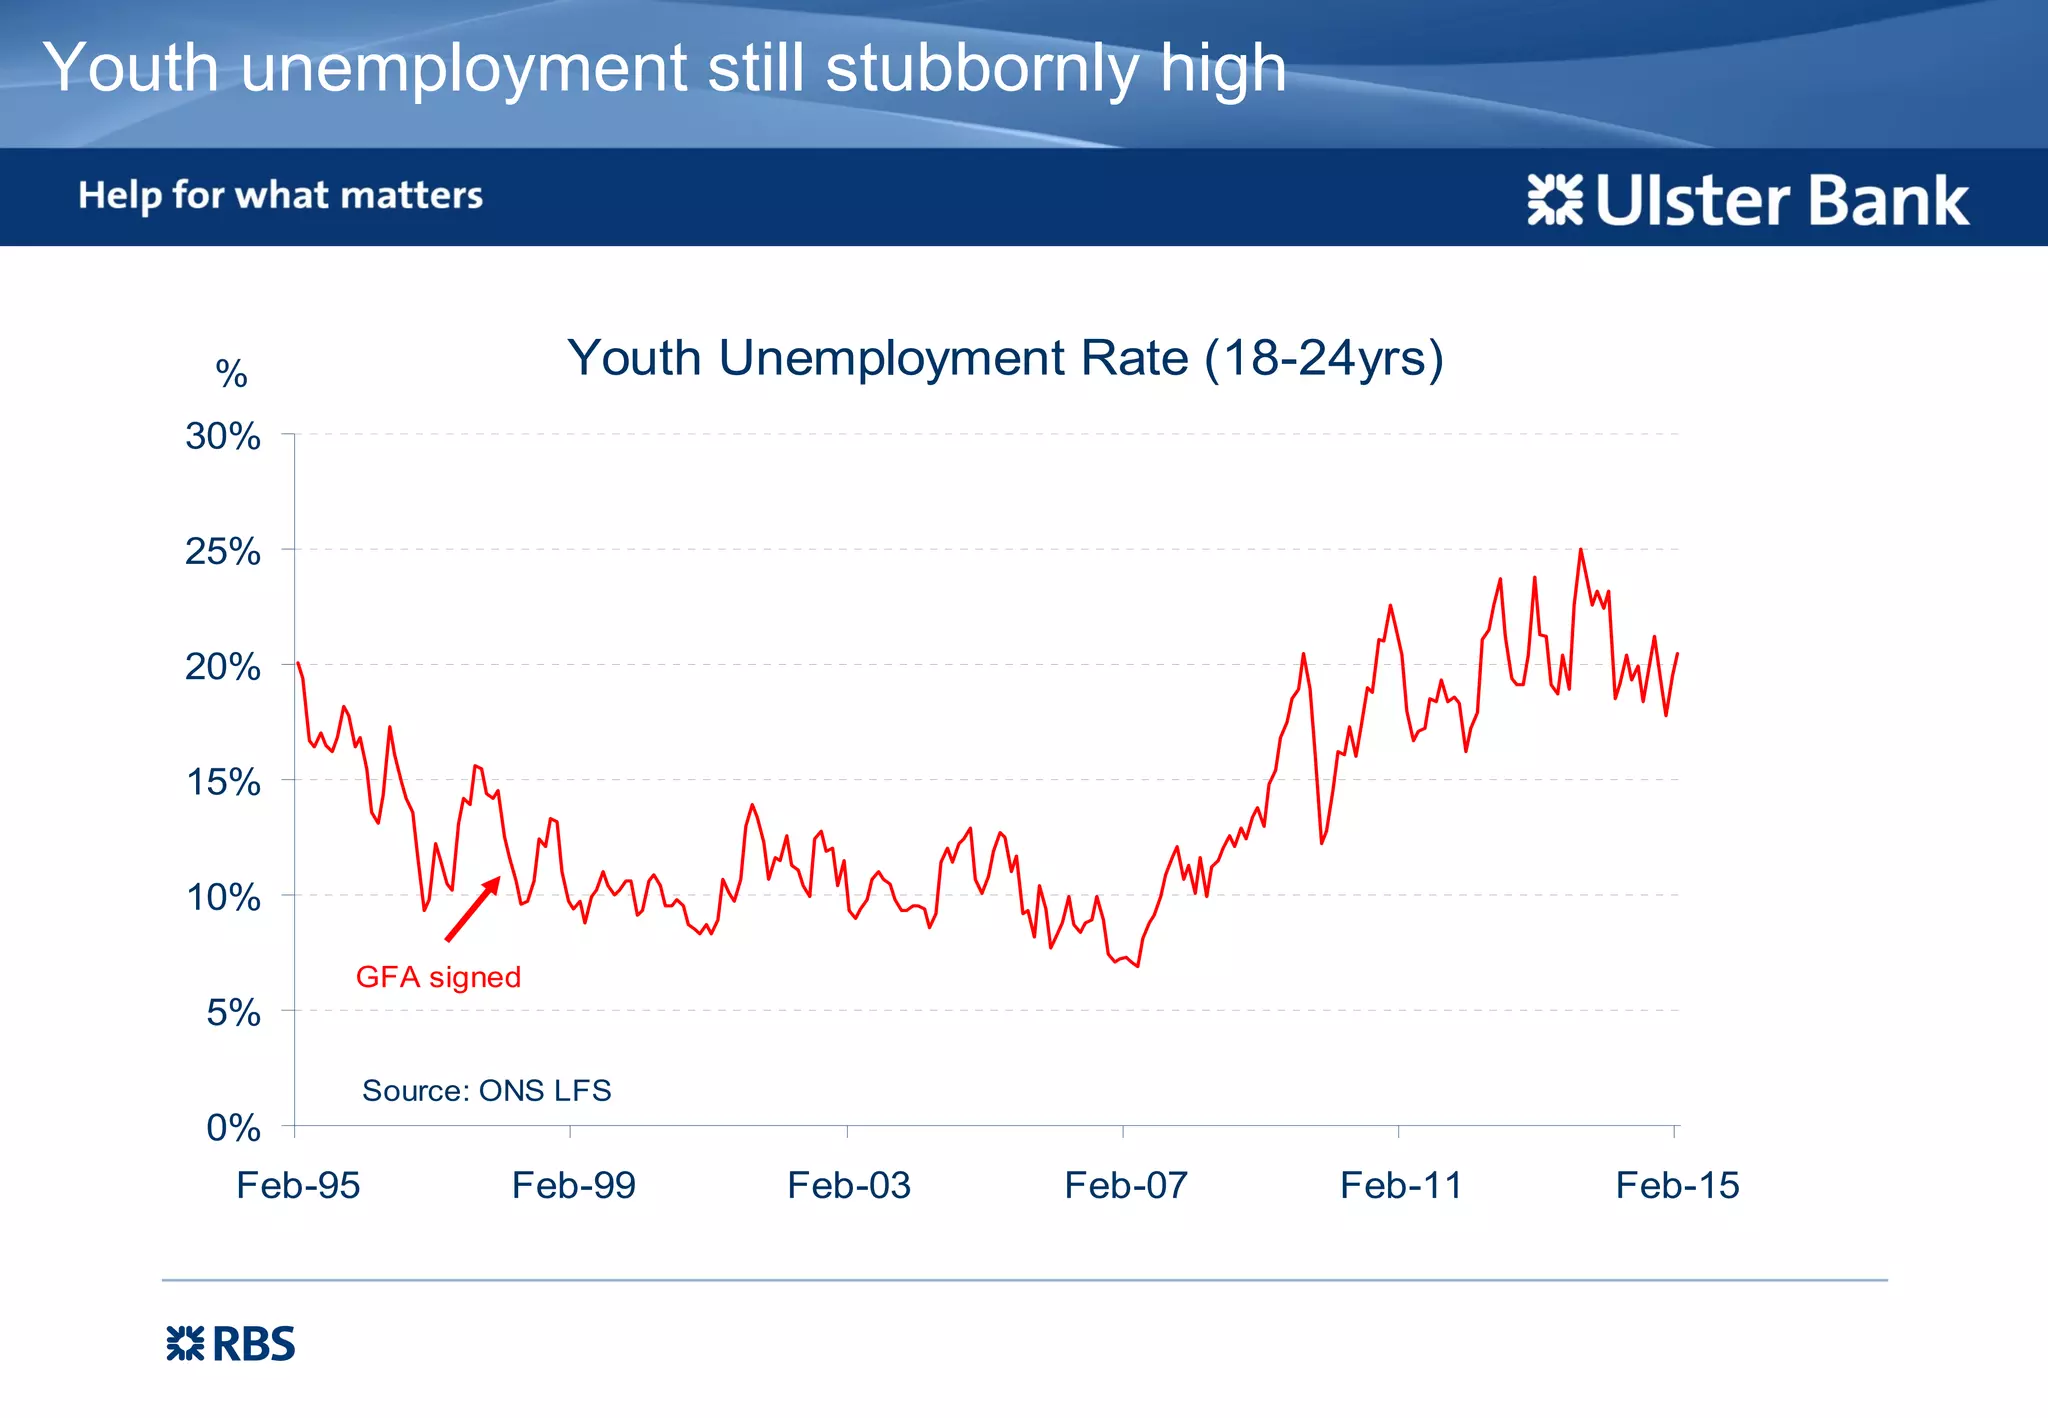

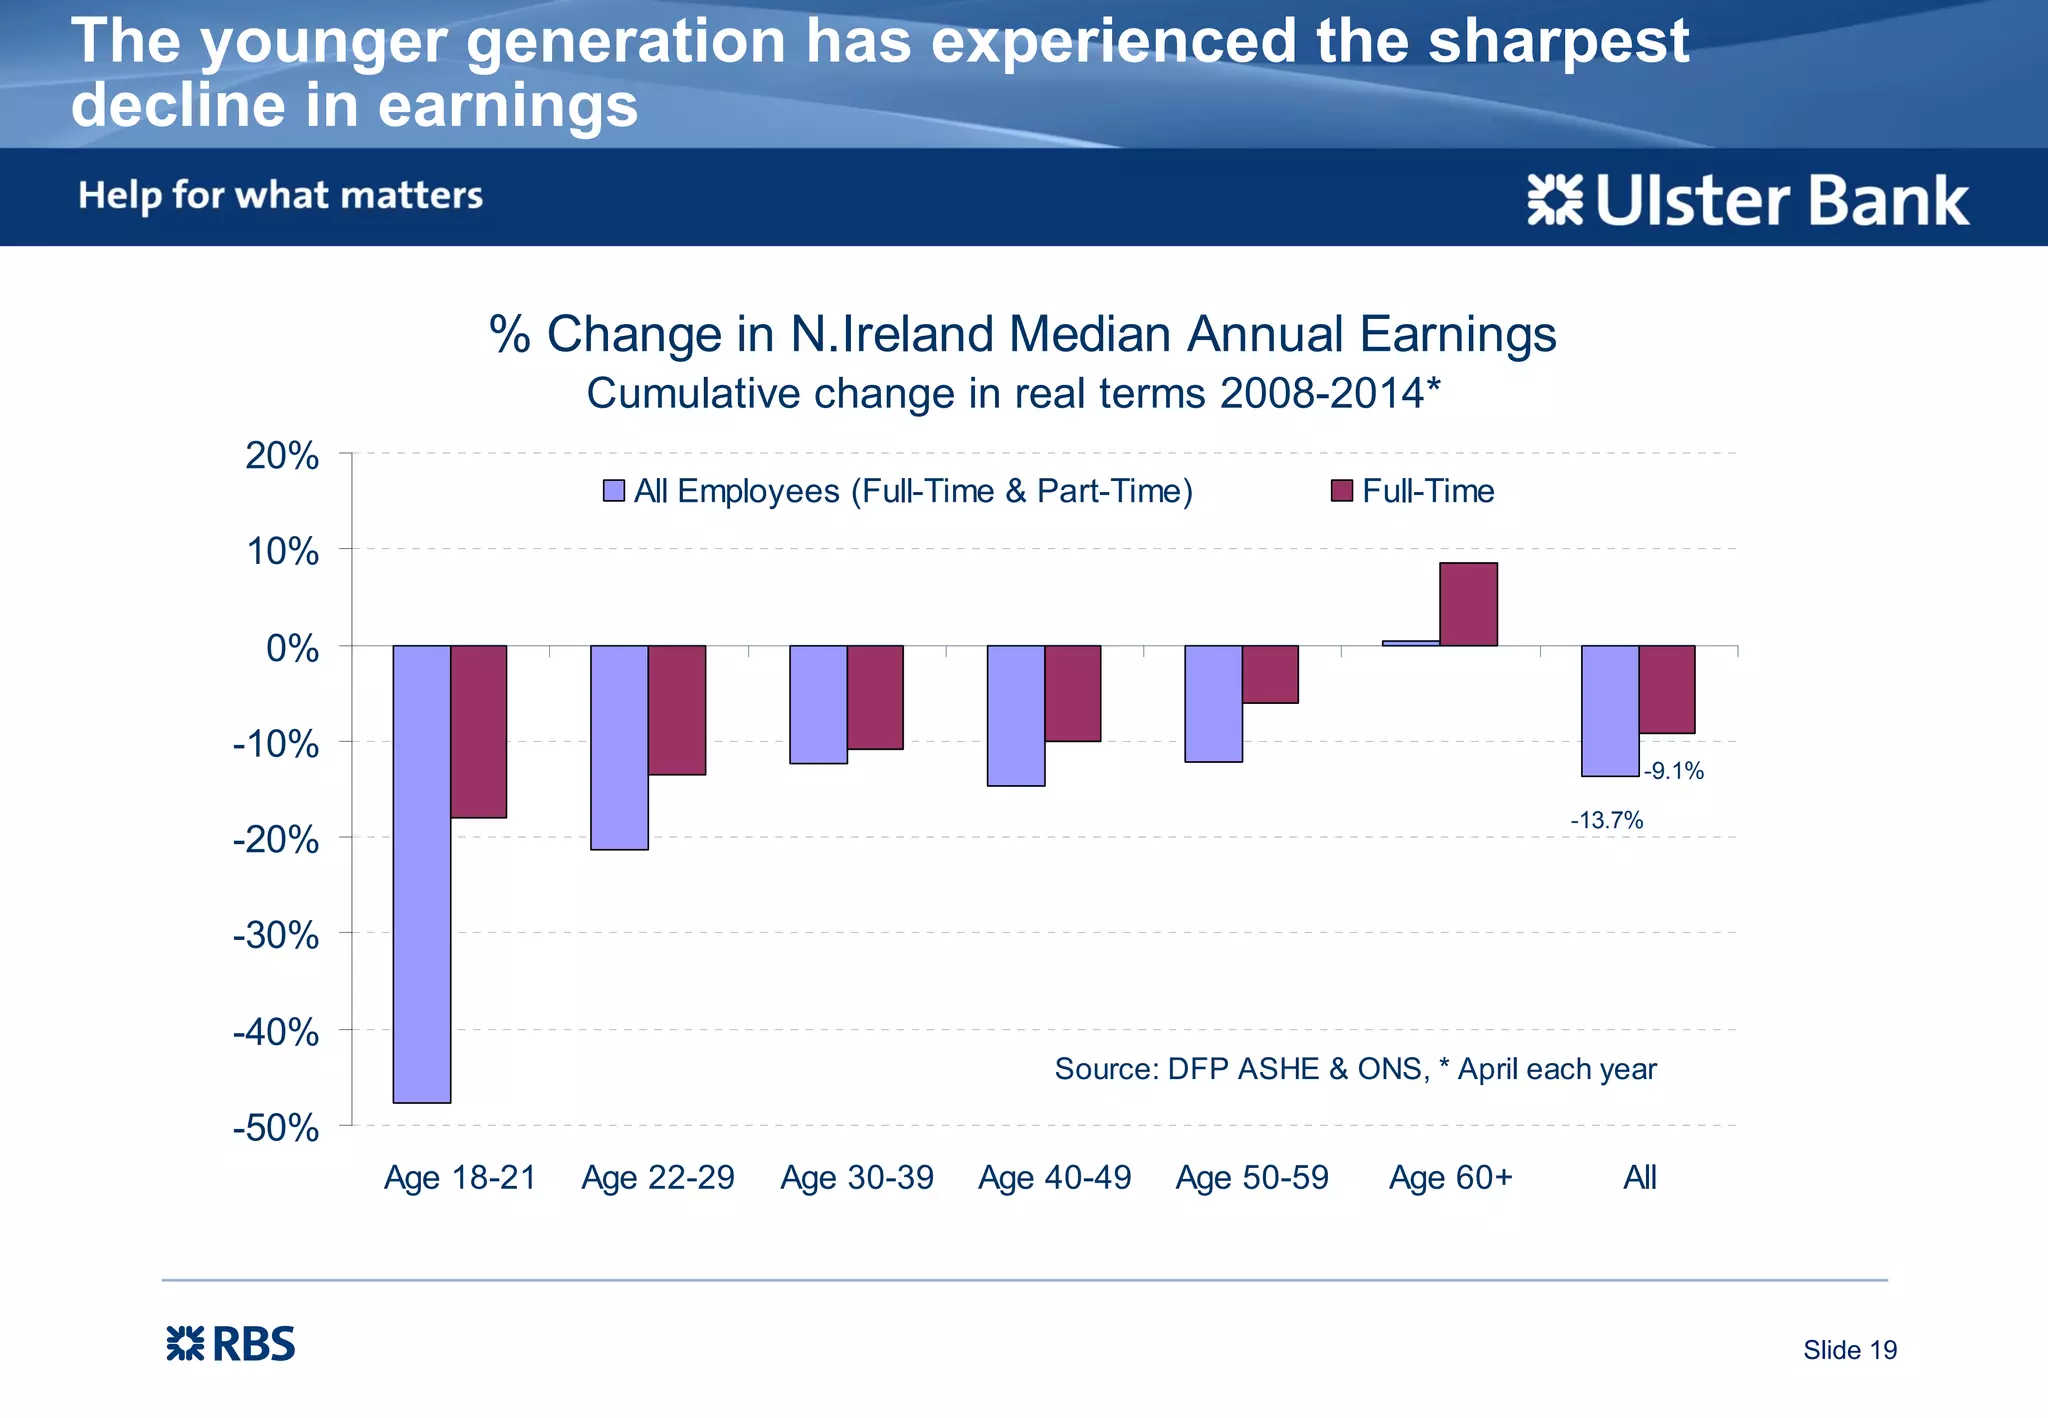


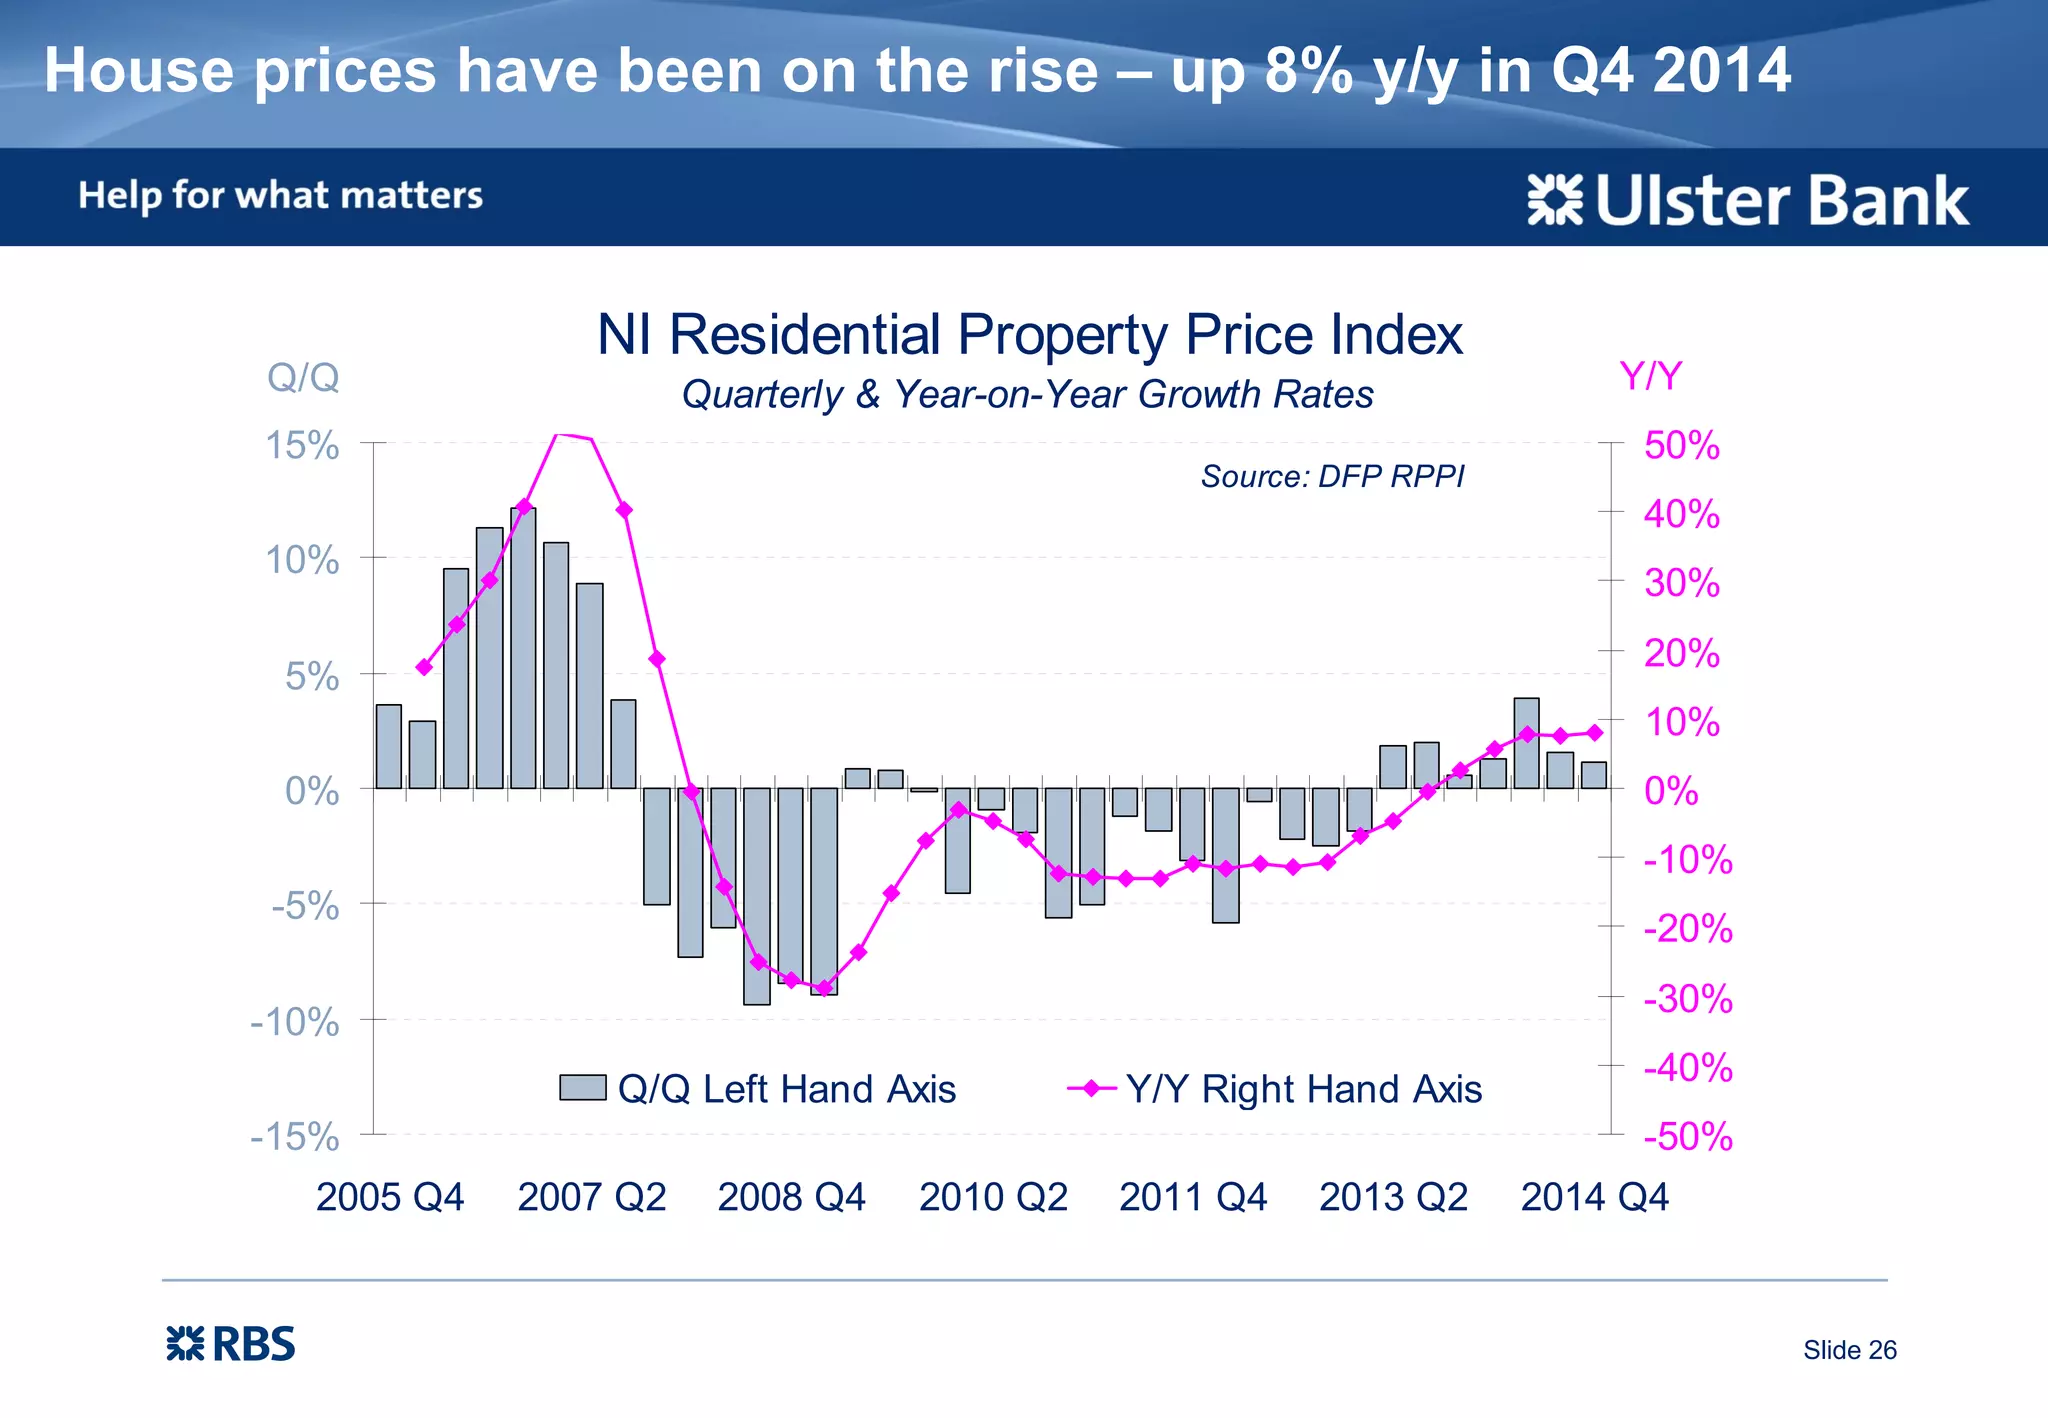
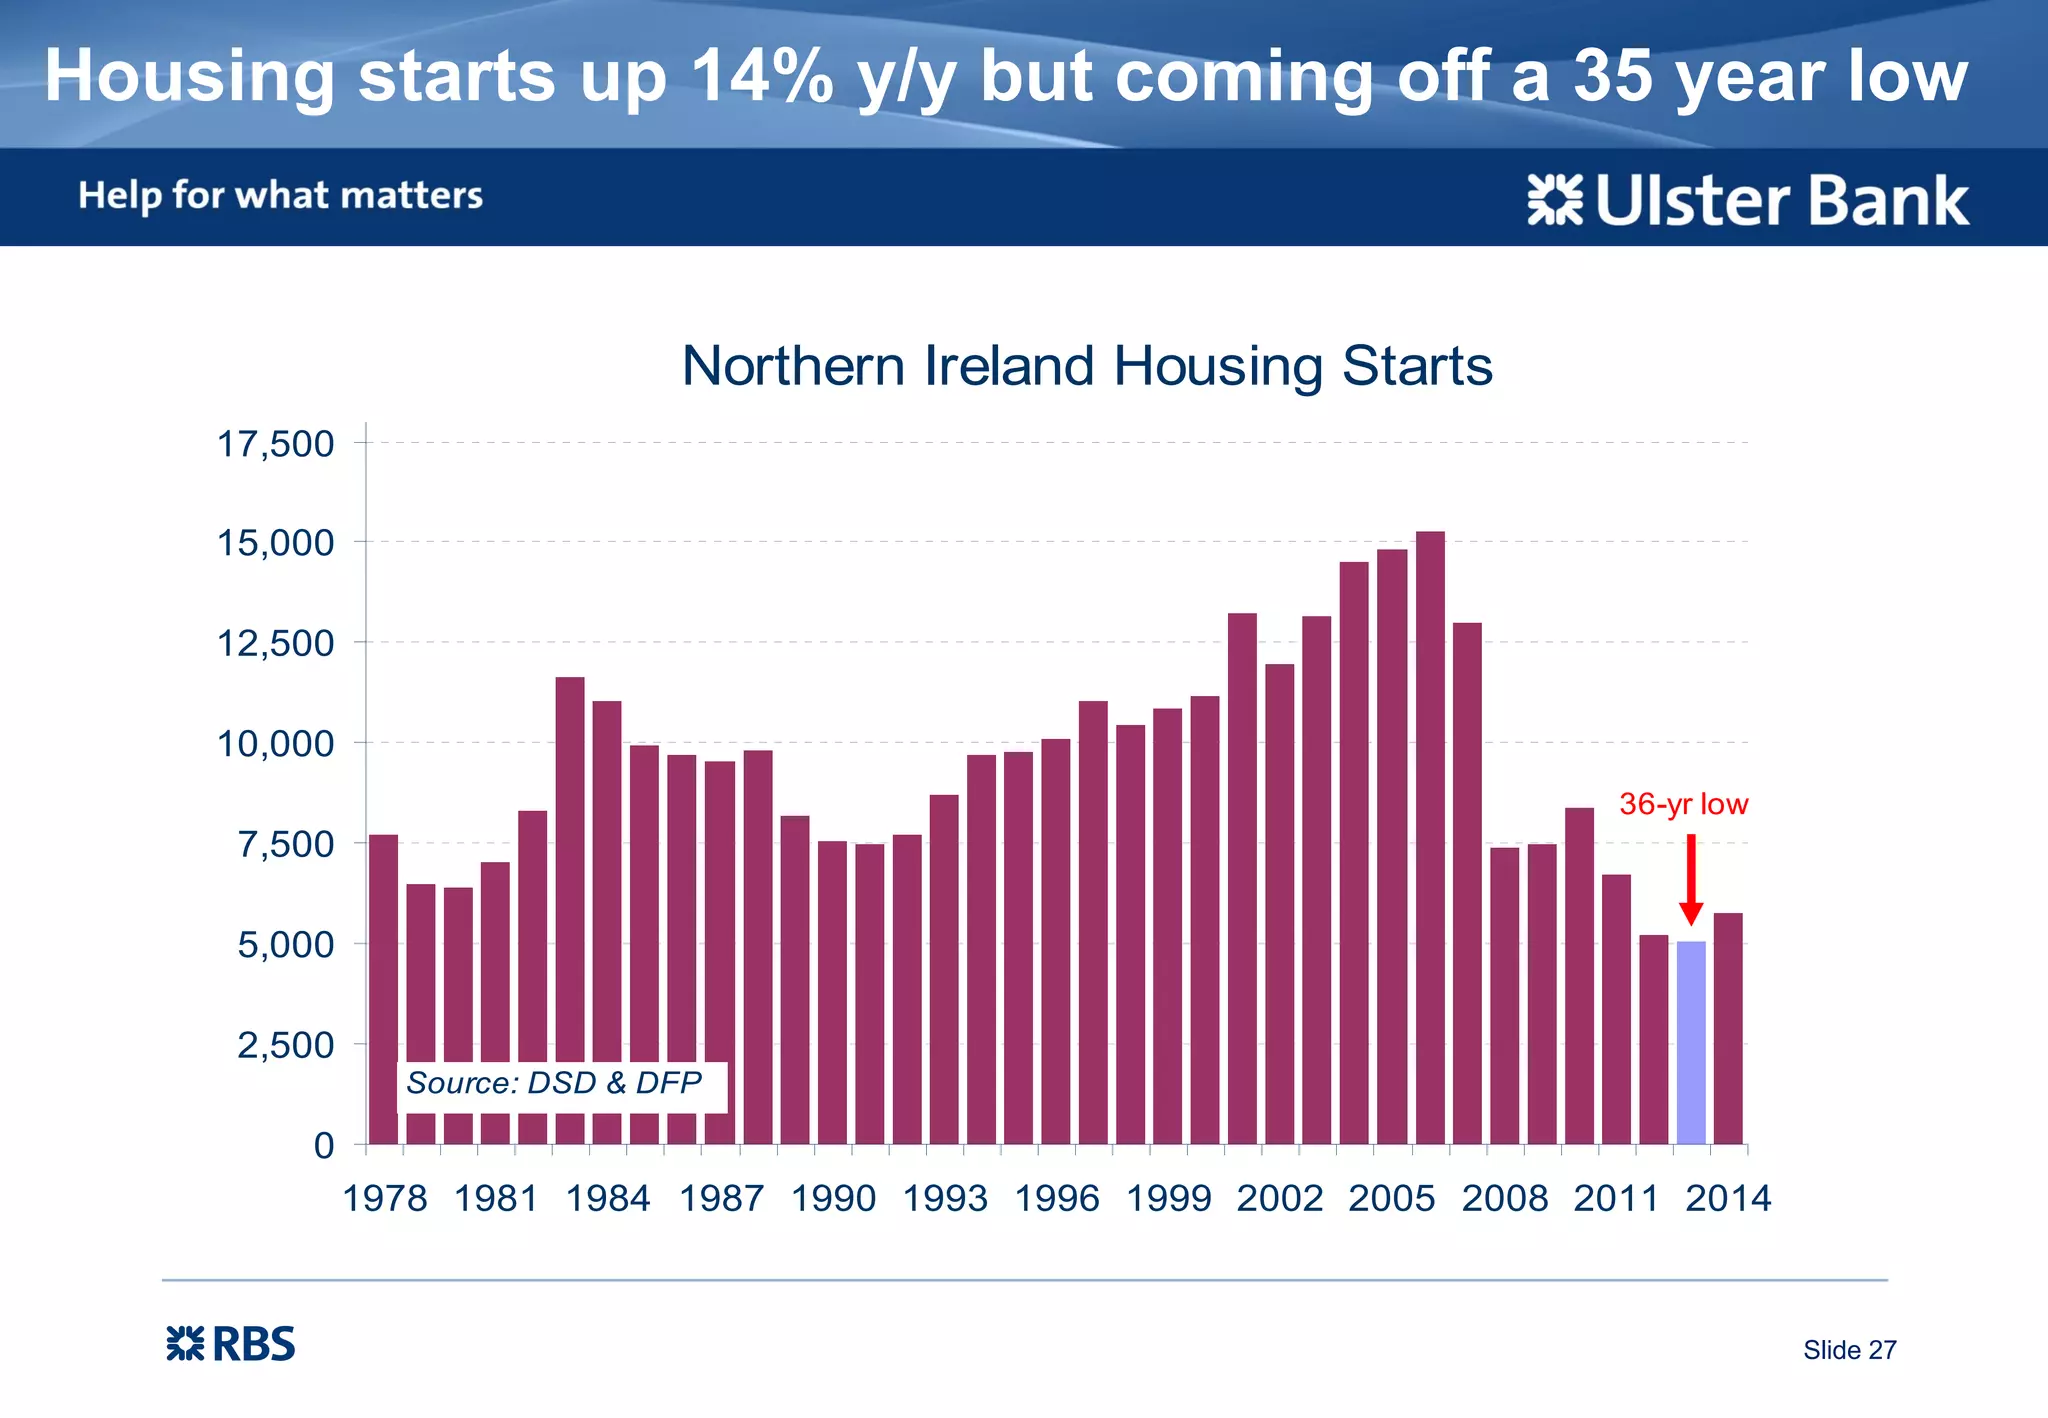


Richard Ramsey, Chief Economist at Ulster Bank, presented an economic outlook highlighting recent improvements such as a decline in unemployment to a six-year low of 5.7% and a rebound in housing starts. However, Northern Ireland's economic recovery appears to lag behind the rest of the UK and ROI, with challenges in the private sector evidenced by slowing growth rates and inflation concerns. Overall, while certain sectors are experiencing growth, significant disparities remain, particularly in youth unemployment and earnings.


