Download to read offline


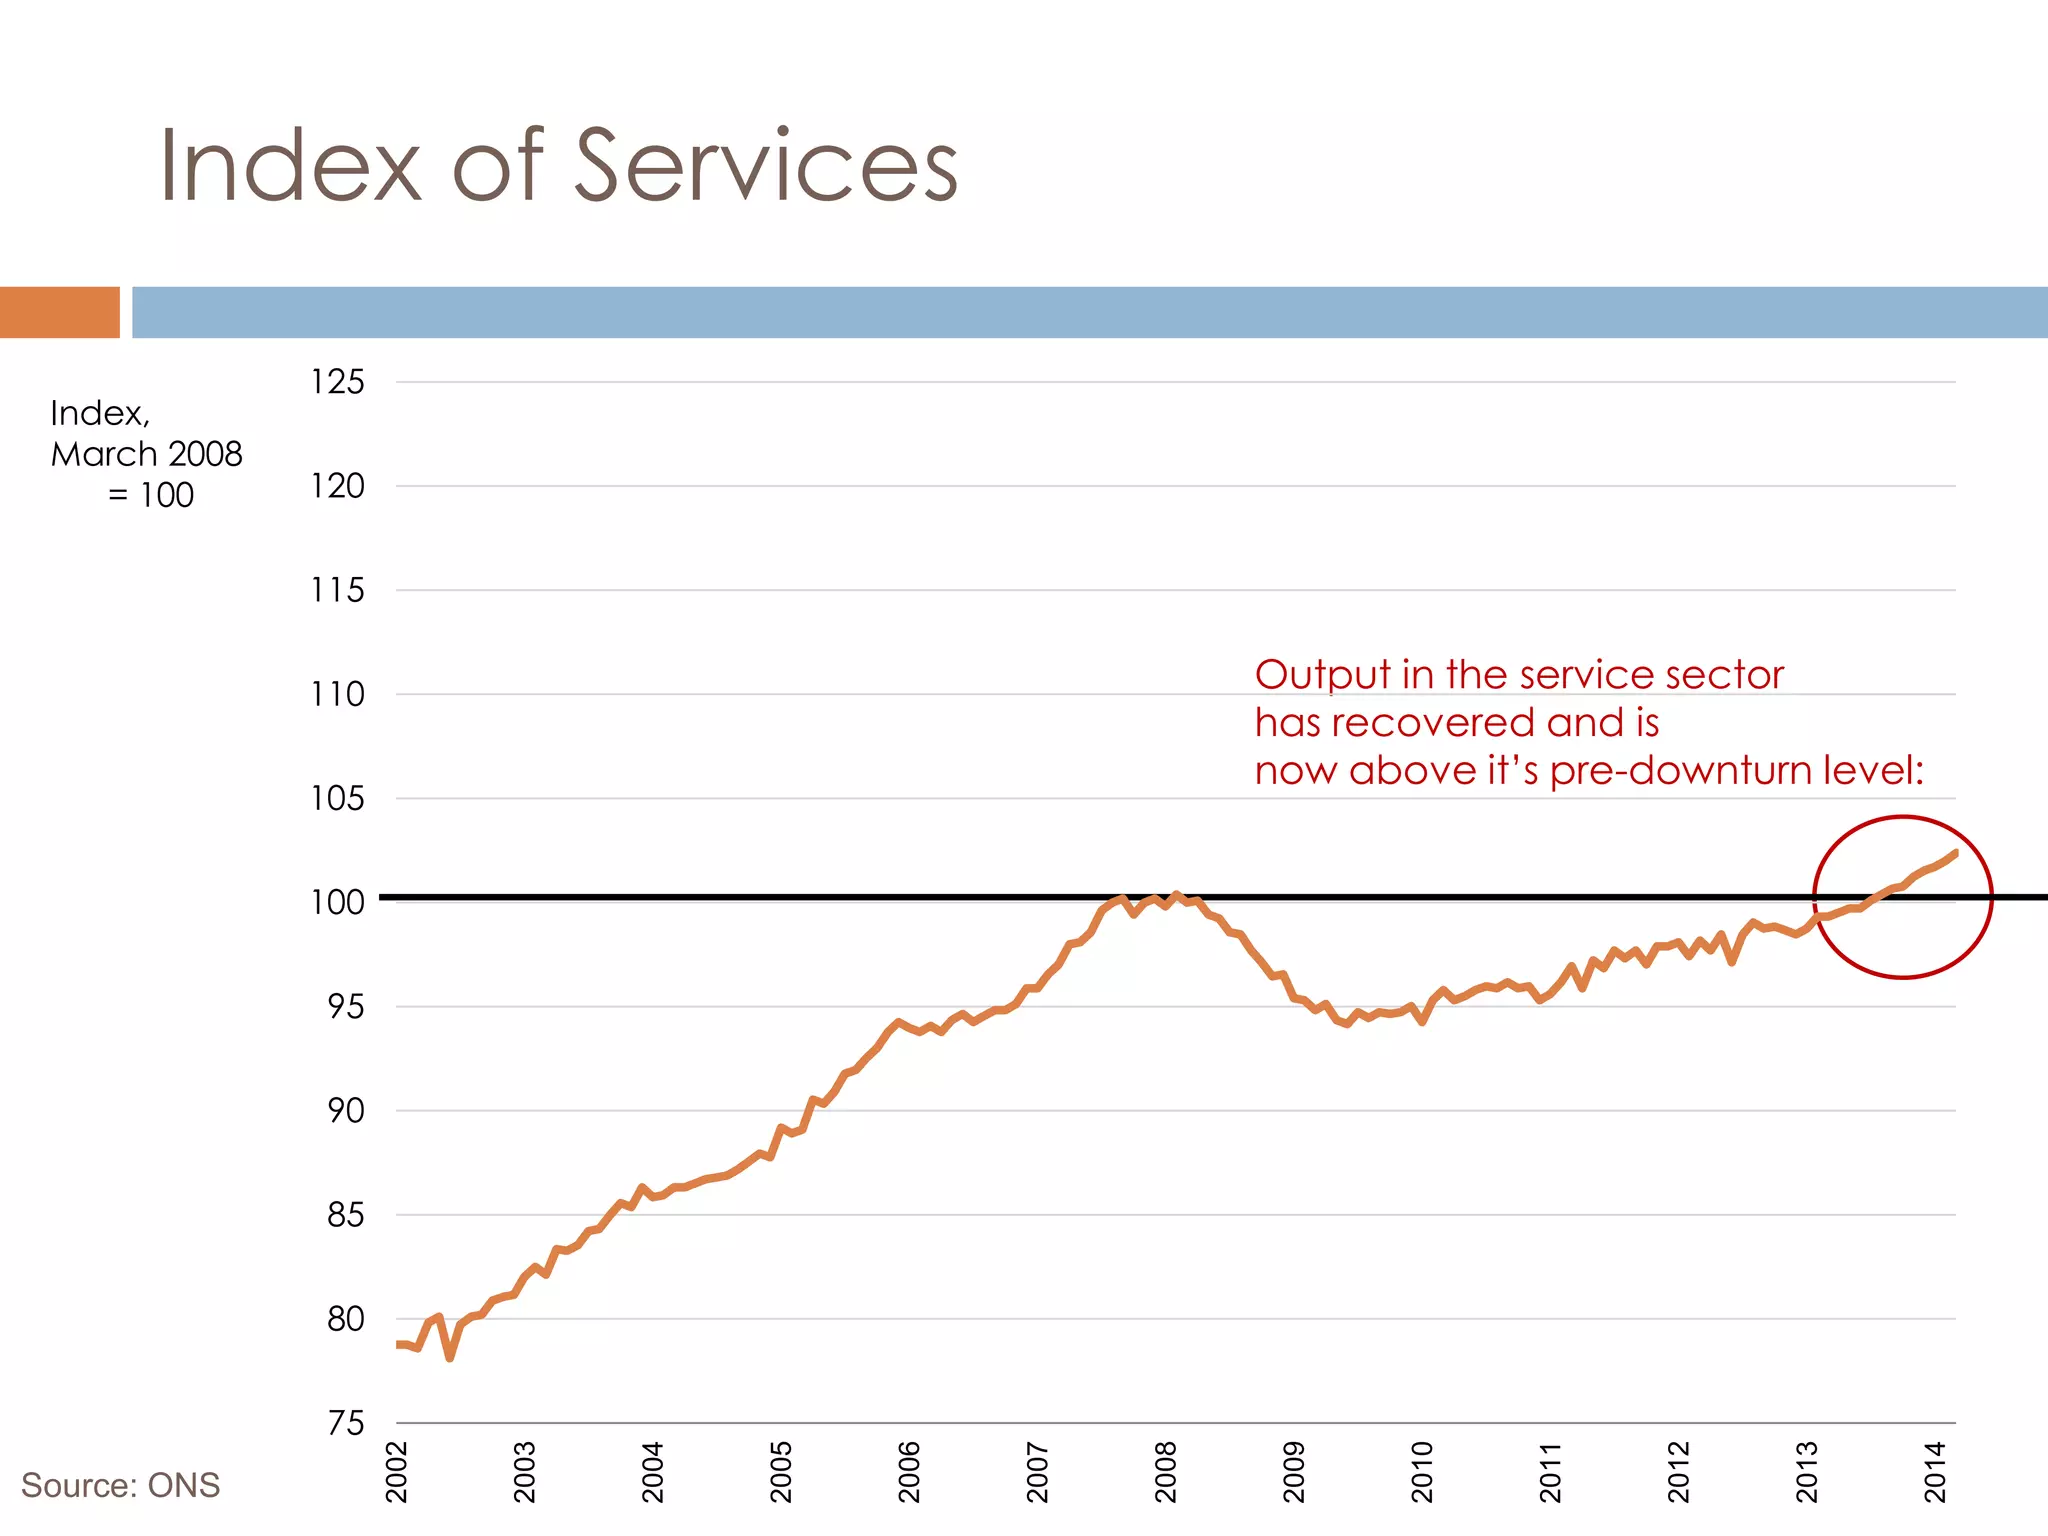


This document summarizes UK economic data from June 2014. It shows that while UK GDP and output in some sectors have recovered since the 2008 financial crisis, overall GDP and construction and production output have not returned to pre-crisis levels. Unemployment is still above pre-crisis levels but hours worked exceeded pre-crisis levels due to population growth. Wage growth has lagged inflation since the crisis. Public debt levels have risen significantly and house price growth has exceeded inflation over the long-term.


