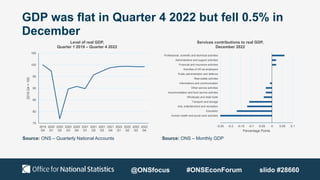
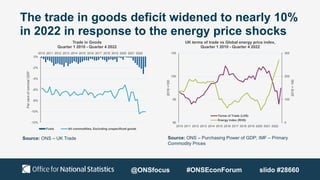
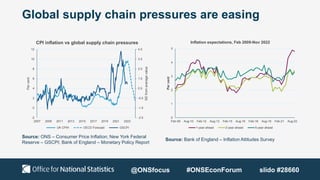
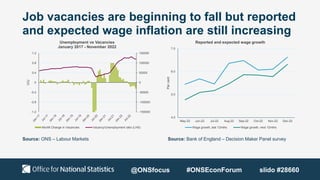
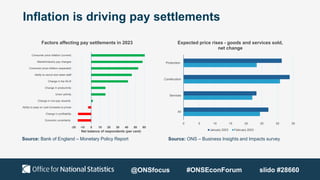
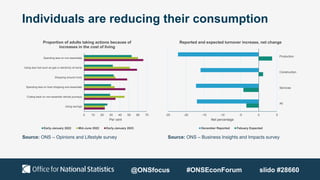
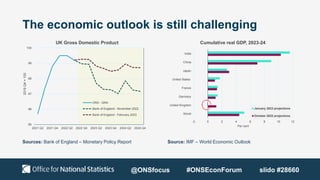
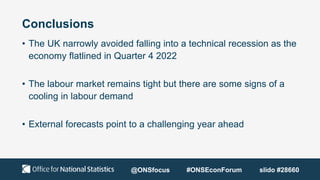
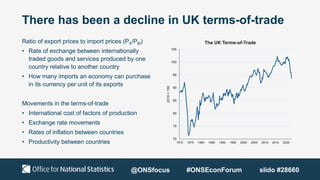
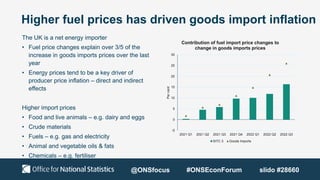
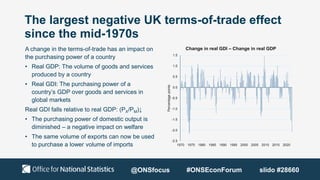
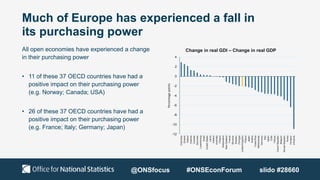
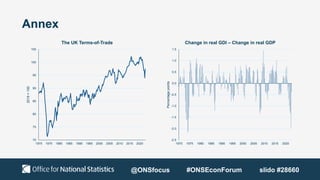
The document summarizes key points from a presentation at the Office for National Statistics Economic Forum. It discusses the current state of the UK economy based on recent GDP, trade, labor market, inflation, and consumption data. Some key points:
- GDP was flat in Q4 2022 but fell 0.5% in December, driven by declines in several service industries.
- The UK's trade deficit widened to nearly 10% of GDP in 2022 due to higher energy import prices following supply shocks.
- Global supply chain pressures are easing but reported and expected wage growth are still increasing. Job vacancies have begun to fall.
- Inflation is driving pay settlements higher. Individuals
Welcome to the monthly economic forum. Here we will be showcasing the latest economic and social developments with a wide range of analytic topics. Each month we will feature ‘State of the Economy’, providing a stocktake of the latest trends and developments.
Welcome to the monthly ONS Economic Forum. Here we will be showcasing the latest ONS economic and social analysis on a range of analytic topics to reflect latest current affairs and global developments.
To coincide with COP-27, presentations this month include:
Climate Change Insights – a look at our quarterly publication that brings together climate change-related statistics and analysis from a range of sources. This presentation will focus on the upcoming publication, out on 11 November, which has a focus on land use, including changes in habitat types, farming practices, and the impact of temperature on agriculture and wildlife
European comparisons of greenhouse gases – this presentation looks at Eurostat and ONS data on greenhouse gas emissions resulting from economic activity across member states, as well as the UK, covering greenhouse gases, CO2 emissions, fossil fuel extraction and environmental tax revenues
Measuring Green Jobs – a brief summary of our work exploring how to measure green jobs, and plans for upcoming work on this topic
A one-day event which discussed how the cost of living is affecting the UK economy and what this means for different households, informed by the range of statistics that the Office for National Statistics (ONS) produces.
These are the slides presented at the Economic Forum on 18 July 2022.
Showcasing the latest economic and social developments with a wide range of analytic topics. Each month we will feature "State of the Economy", providing a stocktake of the latest trends and developments.
Presentations this month include:
Subnational regional productivity in the UK
Homeworking in the UK - regional patterns: 2019 to 2022
Family spending in the UK
Transforming consumer prices statistics with new data and methods: rail fares and second-hand cars
Welcome to the monthly economic forum. Here we will be showcasing the latest economic and social developments with a wide range of analytic topics. Each month we will feature 'State of the Economy', providing a stocktake of the latest trends and developments.
Presentations this month include:
New estimates of core inflation - trimmed mean CPI
The Impact of the Coronavirus Pandemic on UK GDP
International Trade Flows of G7 Economies
We also welcome Fergal Shortall, Director of Monetary Analysis, Bank of England who will be providing a welcome to the forum.
This half day virtual event was opened by ONS senior leaders, offering their perspective on ONS ambitions for business statistics.
Attendees will hear updates from the producers of key UK business surveys, data, statistics and projects, including:
Annual Business Survey (ABS)
Annual Purchases Survey (APS)
Business Enterprise Research and Development (BERD) survey
Government Research and Development (GovERD) survey
Business Insights and Conditions Survey (BICS)
Regional Gross Domestic Product
Inter-Departmental Business Register (IDBR) and transformation to the Statistics Business Register (SBR)
Longitudinal Business Database (LBD) and other linked business microdata
Secure Research Service (SRS) and transformation to the Integrated Data Service (IDS)
The theme for this quarter is apprehension. In September, the US Federal Reserve announced a third 75 basis point increase in the federal funds rate. In the aftermath, the two-year treasury rate reached the highest level since before the 2008 financial crisis and the spread between two and ten-year rates went below negative 50basis points for the first time since the early eighties. Equity markets have begun to price in the likelihood of a recession and, if history is any indication, the impact on oil markets could be profound.
These are the slides presented at the Economic Forum on 26 September 2022.
Presentations this month:
Energy spending by businesses
We present our analysis of businesses' energy spending from the Annual Business Survey 2019 and the Annual Purchases Survey 2018 and the resulting experimental measures of energy intensity. We present how energy intensity varies across and within industries, by energy type and firm size, and depending on the type of measure used.
Tightness in the labour market
We will be presenting analysis of various measures of labour market slack and the relationship between industry unemployment and vacancies.
The ONS hosted our global first trade and investment user event. Over the last few years, feedback and extensive coverage of our trade and investment data has demonstrated how statistics have helped users; better understand the impacts of coronavirus and EU Exit, build collaborative partnerships with other countries for the purpose of making new trade deals, assess key research topics such as supply chains.
At this seminar you will hear from Daniel Arribas-Bel who is a Professor in Geographic Data Science at the University of Liverpool, and Deputy Programme Director for Urban Analytics at the Alan Turing Institute. Daniel will be presenting on "Making it easy for regional scientists to consider (urban) form & function".
ONS Local has been established by the Office for National Statistics (ONS) to support evidence-based decision-making at the local level. We aim to host insightful events that connect our users with exciting developments happening in subnational statistics and analysis at the ONS and across other organisations.
On 22 March ONS released this year's housing affordability ratios for local authorities. In this webinar, we discussed:
- The long-term and emerging patterns in the data
- The data quality of this year's figures
- The impact of covid-19 on the estimates
We'd be interested in hearing your feedback on the estimates, especially if you or colleagues are involved in the Local Housing Needs or Housing Delivery Target process.
At the same time ONS has been enabled (and challenged) to produce new tables, visualisations and analyses which we'll showcase, such as:
- Census 2021 housing topic report and maps
- Purchase affordability (household income based affordability, for Scotland, Wales, England and its regions)
- Private rental affordability (for NI, Wales, England and its regions)
- Energy efficiency of housing (down to LSOA level, for England and Wales)
- Cost of Living research, by tenure (national)
We talked about future ONS housing releases, and some of the range of new country-level cost of living analyses.
If you have any questions, please contact ons.local@ons.gov.uk
Digital 2022 Bhutan (February 2022) v01DataReportal
All the data, statistics, and trends you need to make sense of digital in Bhutan in 2022. Includes the latest reported numbers for internet users, social media users, and mobile connections in Bhutan, as well as key indicators of ecommerce use. For more reports, including the latest global trends and individual data for more than 230 countries around the world, visit https://datareportal.com/
Snapchat Global Platform Report July 2021 v01DataReportal
The latest insights into Snapchat's advertising audience around the world in July 2021. Find similar reports for a variety of other social platforms, together with in-depth data exploring digital behaviours in every country in the world, at https://datareportal.com/
Digital 2022 American Samoa (February 2022) v01DataReportal
All the data, statistics, and trends you need to make sense of digital in American Samoa in 2022. Includes the latest reported numbers for internet users, social media users, and mobile connections in American Samoa, as well as key indicators of ecommerce use. For more reports, including the latest global trends and individual data for more than 230 countries around the world, visit https://datareportal.com/
The theme for this quarter is momentum meets uncertainty. The upward trend in crude oil, natural gas, LNG and refined product prices that began in Q1 continued into Q2. Crude oil markets began the quarter just below $100/bbl and have closed below that level on only two days since late April. As we begin Q3, there are increasing concerns about the health of the global economy and how that might affect oil and gas demand.
EY Price Point: global oil and gas market outlookEY
We enter 2021 on a note of cautious optimism for global health, the world economy, and the oil and gas markets. The first weeks of December brought approval in the US and the UK of the first of several COVID-19 vaccines. The speed with which vaccine development occurred is unprecedented, but certainly welcome. In the weeks following the early November announcement of 90+% effectiveness by the manufacturer of the first approved vaccine, the price of WTI crude oil increased by US$10/bbl to US$48/bbl, the highest level since early March. Sustainability hasn’t returned yet, and whatever time it takes to get the world to normal, it will take even longer for normalization within the oil and gas markets. Inventories remain at historically high levels and, optimistically, it will take until April before inventory returns to levels observed in the preceding five years. That’s an estimate, and there has obviously been some difficulty properly calibrating the expectations of how balance will return and how long it will take. In late November, OPEC met to adjust its output plans because of the anemic rebound in demand. In mid-December, the IEA lowered its demand forecast for 2021 due mostly to continued sluggishness in aviation fuel demand.
A mild winter has interrupted a recovery in North American natural gas prices after a run-up motivated by curtailed capital expenditures, upstream activity and production. After an initial meltdown, with cargo cancellations and dramatic price reversal, LNG markets have made a remarkable comeback, and the spread between Asia and Henry Hub has reached a level we haven’t seen in almost three years. It may be the case that interruption in FIDs has brought us to the cusp of a balance that can support reliable returns.
ONS Regional Economic Forum presents the current state of the UK economy and present data and analysis for your area at a local level.
With Rebecca Riley, who is an Associate Professor of Impact, Engagement and Enterprise and the Business Development Director for City-REDI and Paul Forrest, Head of Research, Midlands Economic Forum.
These are the slides presented at the Economic Forum on 8 September 2022.
The ONS Regional Economic Forum will present the current state of the UK economy and present data and analysis for your area at a local level.
Presentations include:
Understanding the UK Economy.
Showcase exciting developments supporting the levelling up agenda and work on sub-national data.
Addressing the productivity puzzle: from ONS data to the Transformational Triangle.
This presentation covers the key question: Why dashboards? Local authorities and other public bodies have largely ended publishing reports and now produce dashboards. What are the factors that have contributed to this change?
This is the first presentation from our Workshop on 21 September 2023 on Dashboards, APIs and PowerBI.
ONS Local has been established by the Office for National Statistics (ONS) to support evidence-based decision-making at the local level. We aim to host insightful events that connect our users with exciting developments happening in subnational statistics and analysis at the ONS and across other organisations.
In April 2022, as the impact of increases in the Cost of Living really came to the forefront, Public Health & Communities, Suffolk County Council published a Cost of Living profile as part of the Joint Strategic Needs Assessment.
Alongside a written Cost of Living report ‘Making ends meet: The cost of living in Suffolk’, an interactive dashboard was also created using Power BI. In addition to internal data flows, publicly available data from sources such as the ONS have been used to provide a rich picture of the current situation for the local community.
The dashboard was developed in order to:
• Provide up to date data and information on the Cost of Living for Suffolk County Council, partner organisations, and members of the public.
• Deliver an interactive tool to allow users to focus on areas most relevant to them.
• Demonstrate that, while increases in the cost of living affect everyone, impact will be greatest for those who are already under financial pressure, exacerbating inequalities.
• Provide a source of actionable insight to support the system with the evidence base needed to support project development, drive change and really make a difference in the community.
Features of the dashboard:
• Place-focused - published at smaller geographies where possible
• Collaborative - Includes local data from across the system such as data shared by Citizens Advice and other system partners.
• Automated - Most data sources have automated connections, meaning there is little manual intervention required.
• Self-Service - Making the report publicly available puts data at the fingertips of colleagues, system partners and members of the public.
• Live - The dashboard is a living report which is frequently updated.
This session will:
• Provide a demonstration of Suffolk County Council’s Cost of Living dashboard
• Give an overview of data sources
• Explore opportunities for automation using Power BI
• Discuss how the data dashboard is used locally
This event is open to all; however, we anticipate it will be of most interest to anyone working on cost of living dashboards at the local level.
If you have any questions, please contact ons.local@ons.gov.uk.
ONS Local has been established by the Office for National Statistics (ONS) to promote evidence-based decision-making at the local level. We aim to host insightful workshops which will provide practical, technical support to help users make the most of ONS data. The Cross-Government Data Science Community brings together data scientists and analysts to build data science capability across the UK governments and public sector.
We are delighted to welcome you to our inaugural Workshop in our new series, entitled: 'How to use APIs'. The session will cover what Application Programming Interfaces (APIs) are, the advantages in using them and a practical demonstration of how they can be used. The journey of two Local Authority analysts as they begin using APIs in place of manual processes will be showcased to the audience. The session will conclude by explaining the plan for the forthcoming series of Workshops that will begin in September and introducing the Slack channel that ONS Local and Cross-Government DS community will be using to support users' technical questions going forward.
This event is open to all; however, we anticipate it will be of most interest to anyone working at a local level on creating data dashboards for internal or external use.
If you have any questions, please contact ons.local@ons.gov.uk.
ONS Local has been established by the Office for National Statistics (ONS) to support evidence-based decision-making at the local level. We aim to host insightful events that connect our users with exciting developments happening in subnational statistics and analysis at the ONS and across other organisations.
From 1 August 2019, the Secretary of State for Education delegated responsibility for the commissioning, delivery and management of London’s Adult Education Budget (AEB) to the Mayor of London. The AEB helps Londoners to get the skills they need to progress both in life and work. The overarching aim of London’s AEB is to make adult education in London even more accessible, impactful and locally relevant.
In this presentation, the Greater London Authority will be going through the results of the pioneering 2021/22 London Learner Survey (LLS). The survey’s objective is to gain insight into the outcomes of learners to inform and improve policy. The LLS consists of two linked surveys of learners who participated in GLA-funded Adult Education Budget (AEB) learning in the academic year 2021/22.
In the LLS, Learners are surveyed prior to and 5-7 months after completing their course to estimate the economic and social changes that learners experience following an AEB course.
In particular, the presentation will show the economic impact broken down by:
. Progression into employment
. Progression within work
. Progression into further learning.
The social impact will be explored by looking at changes in:
. Health and wellbeing
. Improved self-efficacy
. Improved social integration
. Participation in volunteering
The presentation will also cover how outcomes vary by funding type, breaking down the results by Community Learning and Adult Skills.
This event is open to all; however, we anticipate it will be of most interest to anyone working at a local level on skills, education and employment.
If you have any questions, please contact ons.local@ons.gov.uk.
ONS Local has been established by the Office for National Statistics (ONS) to support evidence-based decision-making at the local level. We aim to host insightful events that connect our users with exciting developments happening in subnational statistics and analysis at the ONS and across other organisations.
Are you interested in finding, visualising, comparing and downloading a wide range of geographically granular datasets in one place? If so, this webinar is definitely for you!
We will present ONS plans for the development of Explore Subnational Statistics (ESS), a public-facing digital service that will allow users to find out more about local areas across the UK.
We will retrace the main milestones in our journey to date, starting from the launch of ESS vision in the GSS subnational data strategy, then taking a closer look at the Subnational Indicators Explorer, and, finally, outlining a roadmap towards the Beta version of the service.
This event is open to all, however we anticipate it will be of most interest to anyone working at a local level, with data on the policy themes of economy, transport connectivity, education, skills, health and wellbeing, or interested in data visualisation products.
If you have any questions, please contact onslocal@ons.gov.uk
ONS Local has been established by the Office for National Statistics (ONS) to support evidence-based decision-making at the local level. We aim to host insightful events that connect our users with exciting developments happening in subnational statistics and analysis at the ONS and across other organisations.
Education and qualifications have been included as a separate analysis topic in Census for the first time in 2021. In this presentation the Census 2021 Education Analysis team will go through the results from the first two publications in their Analysis Plans, focusing on their impact and use for local authorities and other local users.
In the first publication published on 17th February 2023, 'How workforce qualification levels differ across England and Wales', the analysis looked at qualifications in the workforce population (adults aged 16 years and over who are economically active). The piece focused on trends across local authorities, exploring themes including the North-South divide, coastal towns and regional inequality.
The second publication examines the variations in the levels of qualifications that people hold by their country of birth. This includes establishing patterns across UK geographies for international migrants.
The session included live demonstrations of the interactive maps used in the publications, and how the data can be used by local authorities.
This recording is open to all, however we anticipate it will be of most interest to anyone working at a local level on skills, education and employment.
If you have any questions, please contact ons.local@ons.gov.uk
ONS Local has been established by the Office for National Statistics (ONS) to support evidence-based decision-making at the local level. We aim to host insightful events that connect our users with exciting developments happening in subnational statistics and analysis at the ONS and across other organisations.
Have you ever wondered which local authorities are similar to each other? This presentation discusses cluster analysis ONS has published to draw insight into which local authorities are performing in a similar way against key policy themes, promoting greater joined up working between local authorities with similar characteristics to address common problems they face. Our analysis also provides local authorities with control groups for investigating the impact of policy interventions.
In this webinar, we will cover the methods used to create our outputs, demonstrate some of our findings in our interactive visualisation tool and present information on our future plans to expand on this work.
This event is open to all, however we anticipate it will be of most interest to anyone working at a local level, or with data on the policy themes of economy, transport connectivity, education, skills, health and wellbeing.
If you have any questions, please contact ons.local@ons.gov.uk
ONS Local has been established by the Office for National Statistics (ONS) to support evidence-based decision-making at the local level. We aim to host insightful events that connect our users with exciting developments happening in subnational statistics and analysis at the ONS and across other organisations.
On 28th June 2022, Census 2021 released their first results, followed by data covering eight topics and more recently launched a new ‘Create a custom dataset’ tool. We will take you through a tour of the products such as census maps, build a custom area profile, create your own custom dataset tool and pre-built tables, as well as census analysis plans and how you can carry out your own analysis using census data.
This event is open to all, however we anticipate it will be of most interest to anyone working at a local level on Census data or on any Census topics.
If you have any questions, please contact ons.local@ons.gov.uk
Public Policy Analysis Forums hosted our second Annual Crime and Justice Statistics Forum, which provided users of crime and justice statistics an opportunity to engage with experts, share insights and discuss the future of our statistics and foster future collaboration.
how can i use my minded pi coins I need some funds.DOT TECH
If you are interested in selling your pi coins, i have a verified pi merchant, who buys pi coins and resell them to exchanges looking forward to hold till mainnet launch.
Because the core team has announced that pi network will not be doing any pre-sale. The only way exchanges like huobi, bitmart and hotbit can get pi is by buying from miners.
Now a merchant stands in between these exchanges and the miners. As a link to make transactions smooth. Because right now in the enclosed mainnet you can't sell pi coins your self. You need the help of a merchant,
i will leave the telegram contact of my personal pi merchant below. 👇 I and my friends has traded more than 3000pi coins with him successfully.
@Pi_vendor_247
where can I find a legit pi merchant onlineDOT TECH
Yes. This is very easy what you need is a recommendation from someone who has successfully traded pi coins before with a merchant.
Who is a pi merchant?
A pi merchant is someone who buys pi network coins and resell them to Investors looking forward to hold thousands of pi coins before the open mainnet.
I will leave the telegram contact of my personal pi merchant to trade with
@Pi_vendor_247
what is the future of Pi Network currency.DOT TECH
The future of the Pi cryptocurrency is uncertain, and its success will depend on several factors. Pi is a relatively new cryptocurrency that aims to be user-friendly and accessible to a wide audience. Here are a few key considerations for its future:
Message: @Pi_vendor_247 on telegram if u want to sell PI COINS.
1. Mainnet Launch: As of my last knowledge update in January 2022, Pi was still in the testnet phase. Its success will depend on a successful transition to a mainnet, where actual transactions can take place.
2. User Adoption: Pi's success will be closely tied to user adoption. The more users who join the network and actively participate, the stronger the ecosystem can become.
3. Utility and Use Cases: For a cryptocurrency to thrive, it must offer utility and practical use cases. The Pi team has talked about various applications, including peer-to-peer transactions, smart contracts, and more. The development and implementation of these features will be essential.
4. Regulatory Environment: The regulatory environment for cryptocurrencies is evolving globally. How Pi navigates and complies with regulations in various jurisdictions will significantly impact its future.
5. Technology Development: The Pi network must continue to develop and improve its technology, security, and scalability to compete with established cryptocurrencies.
6. Community Engagement: The Pi community plays a critical role in its future. Engaged users can help build trust and grow the network.
7. Monetization and Sustainability: The Pi team's monetization strategy, such as fees, partnerships, or other revenue sources, will affect its long-term sustainability.
It's essential to approach Pi or any new cryptocurrency with caution and conduct due diligence. Cryptocurrency investments involve risks, and potential rewards can be uncertain. The success and future of Pi will depend on the collective efforts of its team, community, and the broader cryptocurrency market dynamics. It's advisable to stay updated on Pi's development and follow any updates from the official Pi Network website or announcements from the team.
when will pi network coin be available on crypto exchange.DOT TECH
There is no set date for when Pi coins will enter the market.
However, the developers are working hard to get them released as soon as possible.
Once they are available, users will be able to exchange other cryptocurrencies for Pi coins on designated exchanges.
But for now the only way to sell your pi coins is through verified pi vendor.
Here is the telegram contact of my personal pi vendor
@Pi_vendor_247
how to sell pi coins on Bitmart crypto exchangeDOT TECH
Yes. Pi network coins can be exchanged but not on bitmart exchange. Because pi network is still in the enclosed mainnet. The only way pioneers are able to trade pi coins is by reselling the pi coins to pi verified merchants.
A verified merchant is someone who buys pi network coins and resell it to exchanges looking forward to hold till mainnet launch.
I will leave the telegram contact of my personal pi merchant to trade with.
@Pi_vendor_247
US Economic Outlook - Being Decided - M Capital Group August 2021.pdfpchutichetpong
The U.S. economy is continuing its impressive recovery from the COVID-19 pandemic and not slowing down despite re-occurring bumps. The U.S. savings rate reached its highest ever recorded level at 34% in April 2020 and Americans seem ready to spend. The sectors that had been hurt the most by the pandemic specifically reduced consumer spending, like retail, leisure, hospitality, and travel, are now experiencing massive growth in revenue and job openings.
Could this growth lead to a “Roaring Twenties”? As quickly as the U.S. economy contracted, experiencing a 9.1% drop in economic output relative to the business cycle in Q2 2020, the largest in recorded history, it has rebounded beyond expectations. This surprising growth seems to be fueled by the U.S. government’s aggressive fiscal and monetary policies, and an increase in consumer spending as mobility restrictions are lifted. Unemployment rates between June 2020 and June 2021 decreased by 5.2%, while the demand for labor is increasing, coupled with increasing wages to incentivize Americans to rejoin the labor force. Schools and businesses are expected to fully reopen soon. In parallel, vaccination rates across the country and the world continue to rise, with full vaccination rates of 50% and 14.8% respectively.
However, it is not completely smooth sailing from here. According to M Capital Group, the main risks that threaten the continued growth of the U.S. economy are inflation, unsettled trade relations, and another wave of Covid-19 mutations that could shut down the world again. Have we learned from the past year of COVID-19 and adapted our economy accordingly?
“In order for the U.S. economy to continue growing, whether there is another wave or not, the U.S. needs to focus on diversifying supply chains, supporting business investment, and maintaining consumer spending,” says Grace Feeley, a research analyst at M Capital Group.
While the economic indicators are positive, the risks are coming closer to manifesting and threatening such growth. The new variants spreading throughout the world, Delta, Lambda, and Gamma, are vaccine-resistant and muddy the predictions made about the economy and health of the country. These variants bring back the feeling of uncertainty that has wreaked havoc not only on the stock market but the mindset of people around the world. MCG provides unique insight on how to mitigate these risks to possibly ensure a bright economic future.
Falcon stands out as a top-tier P2P Invoice Discounting platform in India, bridging esteemed blue-chip companies and eager investors. Our goal is to transform the investment landscape in India by establishing a comprehensive destination for borrowers and investors with diverse profiles and needs, all while minimizing risk. What sets Falcon apart is the elimination of intermediaries such as commercial banks and depository institutions, allowing investors to enjoy higher yields.
How to get verified on Coinbase Account?_.docxBuy bitget
t's important to note that buying verified Coinbase accounts is not recommended and may violate Coinbase's terms of service. Instead of searching to "buy verified Coinbase accounts," follow the proper steps to verify your own account to ensure compliance and security.
Currently pi network is not tradable on binance or any other exchange because we are still in the enclosed mainnet.
Right now the only way to sell pi coins is by trading with a verified merchant.
What is a pi merchant?
A pi merchant is someone verified by pi network team and allowed to barter pi coins for goods and services.
Since pi network is not doing any pre-sale The only way exchanges like binance/huobi or crypto whales can get pi is by buying from miners. And a merchant stands in between the exchanges and the miners.
I will leave the telegram contact of my personal pi merchant. I and my friends has traded more than 6000pi coins successfully
Tele-gram
@Pi_vendor_247
how to sell pi coins effectively (from 50 - 100k pi)DOT TECH
Anywhere in the world, including Africa, America, and Europe, you can sell Pi Network Coins online and receive cash through online payment options.
Pi has not yet been launched on any exchange because we are currently using the confined Mainnet. The planned launch date for Pi is June 28, 2026.
Reselling to investors who want to hold until the mainnet launch in 2026 is currently the sole way to sell.
Consequently, right now. All you need to do is select the right pi network provider.
Who is a pi merchant?
An individual who buys coins from miners on the pi network and resells them to investors hoping to hang onto them until the mainnet is launched is known as a pi merchant.
debuts.
I'll provide you the Telegram username
@Pi_vendor_247
how to sell pi coins at high rate quickly.DOT TECH
Where can I sell my pi coins at a high rate.
Pi is not launched yet on any exchange. But one can easily sell his or her pi coins to investors who want to hold pi till mainnet launch.
This means crypto whales want to hold pi. And you can get a good rate for selling pi to them. I will leave the telegram contact of my personal pi vendor below.
A vendor is someone who buys from a miner and resell it to a holder or crypto whale.
Here is the telegram contact of my vendor:
@Pi_vendor_247
What website can I sell pi coins securely.DOT TECH
Currently there are no website or exchange that allow buying or selling of pi coins..
But you can still easily sell pi coins, by reselling it to exchanges/crypto whales interested in holding thousands of pi coins before the mainnet launch.
Who is a pi merchant?
A pi merchant is someone who buys pi coins from miners and resell to these crypto whales and holders of pi..
This is because pi network is not doing any pre-sale. The only way exchanges can get pi is by buying from miners and pi merchants stands in between the miners and the exchanges.
How can I sell my pi coins?
Selling pi coins is really easy, but first you need to migrate to mainnet wallet before you can do that. I will leave the telegram contact of my personal pi merchant to trade with.
Tele-gram.
@Pi_vendor_247
Poonawalla Fincorp and IndusInd Bank Introduce New Co-Branded Credit Cardnickysharmasucks
The unveiling of the IndusInd Bank Poonawalla Fincorp eLITE RuPay Platinum Credit Card marks a notable milestone in the Indian financial landscape, showcasing a successful partnership between two leading institutions, Poonawalla Fincorp and IndusInd Bank. This co-branded credit card not only offers users a plethora of benefits but also reflects a commitment to innovation and adaptation. With a focus on providing value-driven and customer-centric solutions, this launch represents more than just a new product—it signifies a step towards redefining the banking experience for millions. Promising convenience, rewards, and a touch of luxury in everyday financial transactions, this collaboration aims to cater to the evolving needs of customers and set new standards in the industry.
Poonawalla Fincorp and IndusInd Bank Introduce New Co-Branded Credit Card
ONS Economic Forum
1. Economic Forum
Chair – Grant Fitzner
@ONSfocus #ONSEconForum slido #28660
Chief Economist
Director, Macroeconomic and
Environment Statistics and Analysis
@GrantFitzner
2. Agenda
09:30am – 09:35am Welcome and introduction – Grant Fitzner, Chief Economist, Office for National
Statistics
09:35am – 09:50am State of the Economy – Sam Beckett, Second Permanent Secretary, Office
for National Statistics
09:50am – 10:05am The Purchasing Power of GDP – Sumit Dey-Chowdhury, Office for National
Statistics
10:05am – 10:15am Transformation of UK Consumer Price Statistics: Rail fares – Andrew Whiteley
and Emma Halshaw, Office for National Statistics
10:15am – 10:25am Questions and Answers
10:25am – 10:30am Closing remarks – Grant Fitzner, Chief Economist, Office for National Statistics
@ONSfocus #ONSEconForum slido #28660
3. State of the Economy
February 2023
Sam Beckett
Second Permanent Secretary
Joint Head of the Government Economic Service,
Office for National Statistics
@ONSfocus #ONSEconForum slido #28660
4. GDP was flat in Quarter 4 2022 but fell 0.5% in
December
Source: ONS – Quarterly National Accounts Source: ONS – Monthly GDP
-0.25 -0.2 -0.15 -0.1 -0.05 0 0.05 0.1
Human health and social work activities
Education
Arts, entertainment and recreation
Transport and storage
Wholesale and retail trade
Accommodation and food service activites
Other service activities
Informations and communication
Real estate activites
Public administration and defence
Activities of HH as employers
Financial and insurance activities
Administrative and support activities
Professional, scientific and technical activities
Percentage Points
Services contributions to real GDP,
December 2022
75
80
85
90
95
100
105
2019
Q4
2020
Q1
2020
Q2
2020
Q3
2020
Q4
2021
Q1
2021
Q2
2021
Q3
2021
Q4
2022
Q1
2022
Q2
2022
Q3
2022
Q4
2019
Q4
=
100
Level of real GDP,
Quarter 1 2019 – Quarter 4 2022
@ONSfocus #ONSEconForum slido #28660
5. The trade in goods deficit widened to nearly 10%
in 2022 in response to the energy price shocks
Source: ONS – UK Trade Source: ONS – Purchasing Power of GDP; IMF – Primary
Commodity Prices
-12.0%
-10.0%
-8.0%
-6.0%
-4.0%
-2.0%
0.0%
-12%
-10%
-8%
-6%
-4%
-2%
0%
2010 2011 2012 2013 2014 2015 2016 2017 2018 2019 2020 2021 2022
Per
cent
of
nominal
GDP
Trade in Goods
Quarter 1 2010 - Quarter 4 2022
Fuels All commodities, Excluding unspecificed goods
0
100
200
300
90
95
100
105
2010 2011 2012 2013 2014 2015 2016 2017 2018 2019 2020 2021 2022
2019
=
100
2019
=100
UK terms of trade vs Global energy price index,
Quarter 1 2010 - Quarter 4 2022
Terms of Trade (LHS)
Energy Index (RHS)
@ONSfocus #ONSEconForum slido #28660
6. Global supply chain pressures are easing
Source: ONS – Consumer Price Inflation; New York Federal
Reserve – GSCPI; Bank of England – Monetary Policy Report
Source: Bank of England – Inflation Attitudes Survey
-2.5
-1.5
-0.5
0.5
1.5
2.5
3.5
4.5
-2
0
2
4
6
8
10
12
2007 2009 2011 2013 2015 2017 2019 2021 2023
SD
from
average
value
Per
cent
CPI inflation vs global supply chain pressures
UK CPIH OECD Forecast GSCPI
0
1
2
3
4
5
Feb-09 Aug-10 Feb-12 Aug-13 Feb-15 Aug-16 Feb-18 Aug-19 Feb-21 Aug-22
Per
cent
Inflation expectations, Feb 2009-Nov 2022
1-year ahead 2-year ahead 5-year ahead
@ONSfocus #ONSEconForum slido #28660
7. Job vacancies are beginning to fall but reported
and expected wage inflation are still increasing
Source: ONS – Labour Markets Source: Bank of England – Decision Maker Panel survey
-150000
-100000
-50000
0
50000
100000
150000
-1.2
-0.8
-0.4
0
0.4
0.8
1.2
V/U
Unemployment vs Vacancies
January 2017 - November 2022
MonM Change in Vacancies Vacancy/Unemployment ratio (LHS)
4.0
5.0
6.0
7.0
May-22 Jun-22 Jul-22 Aug-22 Sep-22 Oct-22 Nov-22 Dec-22
Per
cent
Reported and expected wage growth
Wage growth, last 12mths Wage growth, next 12mths
@ONSfocus #ONSEconForum slido #28660
8. Inflation is driving pay settlements
Source: Bank of England – Monetary Policy Report Source: ONS – Business Insights and Impacts survey
-20 -10 0 10 20 30 40 50 60
Economic uncertainty
Change in profitability
Ability to pass on cost increases to prices
Change in non-pay rewards
Union activity
Change in productivity
Change in the NLW
Ability to recruit and retain staff
Consumer price inflation (expected)
Market/industry pay changes
Consumer price inflation (current)
Net balance of respondents (per cent)
Factors affecting pay settlements in 2023
0 5 10 15 20 25 30 35
All
Services
Construction
Production
Expected price rises - goods and services sold,
net change
January 2023 February 2023
@ONSfocus #ONSEconForum slido #28660
9. Individuals are reducing their consumption
Source: ONS – Opinions and Lifestyle survey Source: ONS – Business Insights and Impacts survey
0 10 20 30 40 50 60 70
Using savings
Cutting back on non-essential vehicle journeys
Spending less on food shopping and essentials
Shopping around more
Using less fuel such as gas or electricity at home
Spending less on non-essentials
Per cent
Proportion of adults taking actions because of
increases in the cost of living
Early-January 2022 Mid-June 2022 Early-January 2023
-25 -20 -15 -10 -5 0 5
All
Services
Construction
Production
Net percentage
Reported and expected turnover increase, net change
December Reported Febuary Expected
@ONSfocus #ONSEconForum slido #28660
10. The economic outlook is still challenging
-2 0 2 4 6 8 10 12
World
United Kingdom
Germany
France
United States
Japan
China
India
Per cent
Cumulative real GDP, 2023-24
January 2023 projections
October 2022 projections
Sources: Bank of England – Monetary Policy Report Source: IMF – World Economic Outlook
95
96
97
98
99
100
2024 Q4
2024 Q2
2023 Q4
2023 Q2
2022 Q4
2022 Q2
2021 Q4
2021 Q2
2019
Q4
=
100
UK Gross Domestic Product
ONS - QNA
Bank of England - November 2022
Bank of England - February 2023
@ONSfocus #ONSEconForum slido #28660
11. Conclusions
• The UK narrowly avoided falling into a technical recession as the
economy flatlined in Quarter 4 2022
• The labour market remains tight but there are some signs of a
cooling in labour demand
• External forecasts point to a challenging year ahead
@ONSfocus #ONSEconForum slido #28660
12. Senior Economist
Office for National Statistics
The Purchasing Power of
GDP
Sumit Dey-Chowdhury
@ONSfocus #ONSEconForum slido #28660
13. There has been a decline in UK terms-of-trade
Ratio of export prices to import prices (PX/PM)
• Rate of exchange between internationally
traded goods and services produced by one
country relative to another country
• How many imports an economy can purchase
in its currency per unit of its exports
Movements in the terms-of-trade
• International cost of factors of production
• Exchange rate movements
• Rates of inflation between countries
• Productivity between countries
70
75
80
85
90
95
100
105
1970 1975 1980 1985 1990 1995 2000 2005 2010 2015 2020
2019
=
100
The UK Terms-of-Trade
@ONSfocus #ONSEconForum slido #28660
14. Higher fuel prices has driven goods import inflation
The UK is a net energy importer
• Fuel price changes explain over 3/5 of the
increase in goods imports prices over the last
year
• Energy prices tend to be a key driver of
producer price inflation – direct and indirect
effects
Higher import prices
• Food and live animals – e.g. dairy and eggs
• Crude materials
• Fuels – e.g. gas and electricity
• Animal and vegetable oils & fats
• Chemicals – e.g. fertiliser
-5
0
5
10
15
20
25
30
2021 Q1 2021 Q2 2021 Q3 2021 Q4 2022 Q1 2022 Q2 2022 Q3
Per
cent
Contribution of fuel import price changes to
change in goods imports prices
SITC 3 Goods Imports
@ONSfocus #ONSEconForum slido #28660
15. The largest negative UK terms-of-trade effect
since the mid-1970s
A change in the terms-of-trade has an impact on
the purchasing power of a country
• Real GDP: The volume of goods and services
produced by a country
• Real GDI: The purchasing power of a
country’s GDP over goods and services in
global markets
Real GDI falls relative to real GDP: (PX/PM)↓
• The purchasing power of domestic output is
diminished – a negative impact on welfare
• The same volume of exports can now be used
to purchase a lower volume of imports
-2.5
-2.0
-1.5
-1.0
-0.5
0.0
0.5
1.0
1.5
1970 1975 1980 1985 1990 1995 2000 2005 2010 2015 2020
Percentage
points
Change in real GDI – Change in real GDP
@ONSfocus #ONSEconForum slido #28660
16. Much of Europe has experienced a fall in
its purchasing power
All open economies have experienced a change
in their purchasing power
• 11 of these 37 OECD countries have had a
positive impact on their purchasing power
(e.g. Norway; Canada; USA)
• 26 of these 37 OECD countries have had a
positive impact on their purchasing power
(e.g. France; Italy; Germany; Japan)
-12
-10
-8
-6
-4
-2
0
2
4
Colombia
Greece
Ireland
Estonia
Canada
Denmark
Luxembourg
Israel
United
States
Latvia
Iceland
Australia
Finland
Switzerland
New
Zealand
France
Slovenia
Sweden
Portugal
United
Kingdom
Poland
Japan
Austria
Costa
Rica
Netherlands
Germany
Italy
Spain
Chile
Türkiye
Czech
Republic
Belgium
Slovak
Republic
Korea
Hungary
Lithuania
Percentage
points
Change in real GDI – Change in real GDP
@ONSfocus #ONSEconForum slido #28660
17. Conclusions
The fall in the purchasing power of the UK in the last year explains the
unavoidable hit to UK real national income
• Production
• Welfare
The size and persistence of this terms-of-trade effect
• How these export and import prices evolve
• The reliance of net energy imports – (1) import substitution and (2) energy
intensity of GDP
@ONSfocus #ONSEconForum slido #28660
18. Annex
70
75
80
85
90
95
100
105
1970 1975 1980 1985 1990 1995 2000 2005 2010 2015 2020
2019
=
100
The UK Terms-of-Trade
-2.5
-2.0
-1.5
-1.0
-0.5
0.0
0.5
1.0
1.5
1970 1975 1980 1985 1990 1995 2000 2005 2010 2015 2020
Percentage
points
Change in real GDI – Change in real GDP
@ONSfocus #ONSEconForum slido #28660
19. Business Change Implementation Team
Prices Division
Office for National Statistics
Transformation of UK
Consumer Price Statistics:
Rail fares
Andrew Whiteley
Emma Halshaw
@ONSfocus #ONSEconForum slido #28660
20. How are we transforming consumer prices?
0 5 10 15 20 25 30 35
Communication
Education
Clothing and footwear
Furniture, household equipment and
maintenance
Miscellaneous goods and services
Restaurants and hotels
Recreation and culture
Transport
Alcoholic beverages and tobacco
Food and non-alcoholic beverages
Housing, water, electricity, gas and other
fuels
Rental prices
(~24% CPIH)
Grocery
scanner data
(13% CPIH)
Rail Delivery Group
(transaction) and Auto
Trader (web provided)
data (2.3% CPIH)
• Obtaining Alternative Data Sources (ADS),
including scanner and web-scraped data
• Researching and integrating new methodologies
to process the data
• Developing statistical systems
• Embedding new processes
Allows us to improve the accuracy, efficacy and
representativity of consumer price inflation statistics
Primarily, new data will help us to inform the narrative
around what is driving inflation for our users.
@ONSfocus #ONSEconForum slido #28660
21. Rail fares data in CPIH, CPI, and RPI
• Transaction-level rail fares data will be incorporated in the CPIH, the CPI
and the RPI from February 2023, first published on 22 March 2023
• Historic impact analysis shows that the transformation of rail fares indices
would not have affected CPIH, CPI or RPI at headline level
• Small impacts (up to 0.1 percentage points) at Transport division level
• The key benefit of new data sources is the greater depth of
understanding on what is driving consumer prices trends
@ONSfocus #ONSEconForum slido #28660
22. Rail fares: Improved granularity of indices
• Data provided by the Rail Delivery Group, sourced from LENNON ticket
revenue system
• Publishing six new indices based on ticket types:
• Further stratification by individual regions in GB is calculated but not
published
• GB peak
• GB off-peak
• GB super off-peak
• GB advance
• GB short season
• Northern Ireland
@ONSfocus #ONSEconForum slido #28660
23. Quality assurance and testing
• Conducted an extensive readiness assessment
• Successfully mimicked live production using real data
• Thorough testing complete, providing a high level of confidence in the
data, system behaviour and their reliability
• Reviewed contingency plans and mitigating actions to ensure business
readiness for potential risks to monthly production round
@ONSfocus #ONSEconForum slido #28660
24. Update on second-hand cars
• Data and methods are more complex than rail fares (such as filtering and
imputation procedures)
• Quality assurance highlighted challenges in the methods that may affect
reliability of statistical production process
• We will be incorporating only rail fares into headline consumer price
statistics at this time
• Plans and timelines for second-hand cars will be updated in Spring 2023
@ONSfocus #ONSEconForum slido #28660
25. Final impact of transformed rail fares indices on
12-month rate for CPIH transport division
• Overall impact negligible on
headline consumer price
statistics
• Rail fares has contributed to less
than 7% of transport division of
CPIH since 2019
• Implemented improved outlier
detection and removal
methods, as detailed in
our Outlier detection for rail fares
and second-hand cars dynamic
price data methodology
@ONSfocus #ONSEconForum slido #28660
26. Transformation offers greater insights – by ticket type
Source: ONS Source: ONS
@ONSfocus #ONSEconForum slido #28660
27. What's next for prices transformation
• February 2023: we will incorporate the rail fares data into headline
consumer price statistics
• 22 March 2023: we will first publish our CPIH, CPI and RPI which
incorporates our rail fares data
• Spring 2023: we will publish our updated timelines as part of our
Transformation of UK consumer price statistics series
More detail surrounding the work covered in this presentation, can be
found in our most recent publication.
@ONSfocus #ONSEconForum slido #28660
28. Transformation timeline
March 2023 November 2023 January 2025
March 2024
Go/no-go decision
Final impact assessment
to determine suitability of new
data for second-hand cars,
groceries & private rents
Rail fares new data goes
into live production
Rolling programme Further
data acquisition and research
for priority categories
Second-hand cars,
grocery scanner
and private rents
data into live production
November 2022 –
January 2023
Go/no-go decision
Final impact assessments to
determine suitability of new data
for rail fares and second-hand
cars
@ONSfocus #ONSEconForum slido #28660
29. Closing remarks
Grant Fitzner
Chief Economist
Director, Macroeconomic and
Environment Statistics and Analysis
@GrantFitzner
@ONSfocus #ONSEconForum slido #28660
30. Forthcoming ONS economic analysis
13 February 2023 Labour demand volumes by profession and local authority, UK: January 2017 to December 2022
13 February 2023 Characteristics associated with experiencing energy and food insecurity among adults in Great
Britain: 22 November to 18 December 2022
13 February 2023 Characteristics of homeworkers, Great Britain: September 2022 to January 2023
14 February 2023 Labour Market Theme Day
15 February 2023 Prices Theme including CPIH-consistent inflation rate estimates for UK household groups: October
to December 2022
17 February 2023 How workforce qualification levels differ across England and Wales
17 February 2023 UK trade in goods, year in review: 2022
20 February 2023 Impact of increased cost of living on adults across Great Britain: September 2022 to January 2023
21 February 2023 How has discretionary spending been impacted in recent winters?
27 February 2023 Subnational labour market trends, England and Wales: Census 2021
03 March 2023 The impact of population changes on economic inactivity trends, UK: 2019 to 2022
All information on upcoming analysis can be found via the ONS website
@ONSfocus #ONSEconForum slido #28660
31. Dates for your diary
13 March 2023 ONS Economic Forum – Registration to open shortly
15 March 2023 Annual crime and justice statistics forum 2023
Further details on the above event and any upcoming events will be published at
ons.gov.uk/economicevents
@ONSfocus #ONSEconForum slido #28660
32. Transforming the ONS’s household financial
statistics consultation
We are seeking views on our ambitious plans for the transformation of our household financial
statistics.
These statistics cover the income, expenditure and wealth of UK Households and are a vital source
of information for understanding people’s finances including the effects from the rising cost of living.
This consultation sets out our plans for the next two and half years, laying out necessary
transformation steps, consistent with that longer term aim and building on our existing research in
this space.
We ask you to consider our proposals for the transformation of household financial statistics and to
provide your responses to this consultation by Thursday 23 February 2023.
@ONSfocus #ONSEconForum slido #28660
33. Your views matter – complete our stakeholder
satisfaction survey
@ONSfocus #ONSEconForum
At the ONS, we're committed to ensuring we continue to provide high quality data and analysis for
the public good, and that our statistics meet user needs.
We have launched our annual stakeholder satisfaction survey and would be grateful if you could
take a few minutes to complete it.
It can be completed anonymously and will remain open until 27 February 2023.
Click the link to complete the survey. ONS stakeholder satisfaction survey - Office for National
Statistics
slido #28660
34. Thank you for attending the
Economic Forum
You can keep up to date on all upcoming events via
ons.gov.uk/economicevents
If you would like to ask a question or provide any feedback, please do so
via economic.engagement@ons.gov.uk