Downloaded 313 times


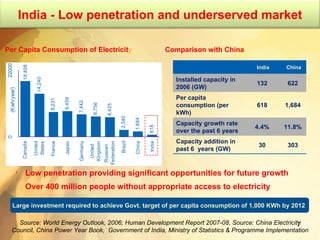
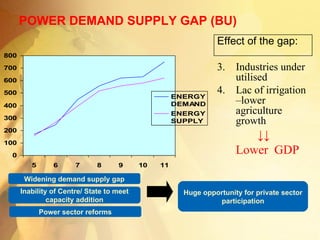
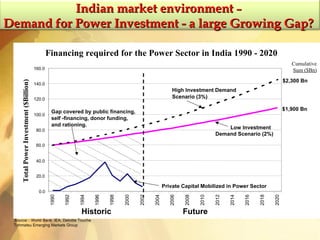
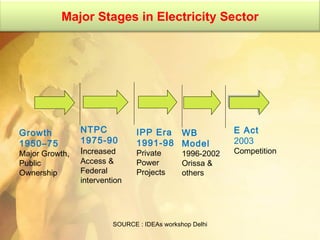
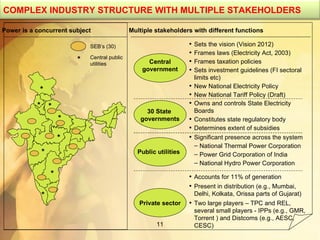


The document provides an overview of India's power sector, including current challenges and future opportunities. It notes that power demand is growing rapidly but supply is not keeping pace, leaving a large gap. To meet the government's targets for increased access and per capita consumption, massive investment will be needed in both conventional sources like coal as well as renewable sources like wind and solar. The power sector is complex with many stakeholders at both central and state levels.


